![]()
This chapter explains suggestions in Skylar Automated RCA and how to asses and disposition them, and it also explains how to use Root Cause reports to quickly address issues.
Suggestions in Skylar Automated RCA
Skylar Automated RCA (Root Cause Analysis) uses unsupervised machine learning on logs to automatically find the root cause of software problems. It does not require manual rules or training, and it typically achieves accuracy within 24 hours.
As Skylar Automated RCA ingests logs, the Skylar artificial-intelligence (AI) engine analyzes the logs, looking for abnormal log line clusters that resemble problems, such as abnormally correlated rare and error events from across all log streams.
When the Skylar AI detects an "abnormal" cluster of problematic events, it generates a suggestion, which appears on the Alerts page (the home page) of the Skylar Automated RCA user interface along with the existing alerts:

On the Alerts page, the summary report for a suggestion and an alert contains the following main elements:
- AI-generated title. Displaying at the top of the summary pane, this title is generated using GPT Services that use new Generative AI models. You can enable or disable GPT services for a specific deployment of Skylar Automated RCA by using the GPT Services column on the Deployments page (Settings (
 )> Deployments).
 - Word Cloud. A set of relevant words chosen by the Skylar AI from the log lines contained in the alert. On the RCA report page, you can click a word in the cloud to highlight that word in the list of logs.
- Significance icon. Since not all suggestions that the Skylar AI generates will relate to problems that actually impact users, the engine attempts to reason over the data and assess whether a problem actually requires attention. Hover over this icon at the top of the list of logs to view the confidence level of the Skylar AI for this suggestion:
- A red icon (
 ) means "High" confidence.
 - A yellow icon (
 ) means "Medium" confidence.
 - A blue icon (
 ) means "Low" confidence.
- A red icon (
- AI Assessment . Since not all suggestions that the Skylar AI generates will relate to problems that actually impact users, the Skylar AI attempts to reason over the data and assess whether a problem actually requires attention. Depending on the quality of the data, some suggestions might not include an AI Assessment. This value is shown in the Skylar Automated RCA user interface as an AI Assessment value of one of the following:
- "Your Attention Needed" for content that the Skylar AI believes should be looked into.
- "No Attention Needed" for content that the Skylar AI assesses as unlikely to require immediate attention.
- Root Cause (RCA) Report Summary. The report contains the actual cluster of anomalous log lines that was identified by the Skylar AI. Up to eight of these log lines are shown in the summary view. You can click anywhere in the summary to view the full Root Cause report.
- Alert Key. One or two log lines, denoted with a key icon (
 ), that are used to identify the suggestion if this type of suggestion occurs again. The alert keys make up an alert rule.
You can click anywhere in the summary report for a suggestion or an alert to view a more detailed Root Cause Report page for that suggestion or alert. For more information, see Root Cause Reports.
Suggestions are generated when the Skylar AI finds a cluster of correlated anomalies in your logs that resembles a problem. However, this does not mean that all suggestions relate to actual important problems. This is especially true during the first few days of using Skylar Automated RCA, as the Skylar AI learns the normal patterns in your logs.
When you start getting suggestions on the Alerts page, you can review the word clouds and event logs that display in the summary views for the Root Cause reports for the suggestions. As a best practice, identify a specific time frame when a possible problem occurred, and then start looking at the reports that have the most interesting or relevant information related to the possible root cause of the problem.
You can choose to "accept" or "reject" a suggestion. For more information, see Assessing Suggestions.
You can also decide on the action to take if the same kind of alert type occurs again, such as sending a notification to Slack, email, or another type of notification. For more information, see Notification Channels.
If you currently use SL1 from ScienceLogic, you can configure an integration that lets you view Skylar Automated RCA suggestions in SL1 dashboards as well as on the SL1 Events page. For more information, see ScienceLogic Integrations.
Managing Suggestions in the Skylar Automated RCA User Interface
The Alerts page is also the Skylar Automated RCA home page, and you can get to this page by clicking the Skylar icon (![]() ) at the top left of any page in the Skylar Automated RCA user interface:
) at the top left of any page in the Skylar Automated RCA user interface:

Clicking the Skylar icon (![]() ) will clear any time range filters you might have applied. If you are viewing a Root Cause Report page, you can click the button (
) will clear any time range filters you might have applied. If you are viewing a Root Cause Report page, you can click the button (![]() ) below the Skylar icon to return to the Alerts page with the time range filters still in place.
) below the Skylar icon to return to the Alerts page with the time range filters still in place.
This page displays a list of filtering and search options at the top of the page. You can use these filters to manage the number of suggestions and alerts that display on the Alerts page. There is also a Search bar for text or regular expression (regex) searches, and a toggle for Core Events and All Events. For more information about filtering, see Using the Filters on the Alerts Page in Skylar Automated RCA.
Below the filters is a that displays a set of icons organized by time. These icons represent all known suggestions, accepted alerts, custom alerts, and rejected alerts for a specific period of time. For more information about the , see Using the Timeline Widget on the Alerts Page.
The Root Cause (RCA) reports that correspond to the items in the display in a summary view below the widget. If you click an icon in the , the RCA report for that icon moves to the top of the summary view below the widget. For more information about RCA reports, see Root Cause Reports.
Using the Filters on the Alerts Page in Skylar Automated RCA
At the top of the Alerts page, the button (![]() ) lets you change the time frame of the alerts. The default time frame for displaying alerts is the last 7 days.
) lets you change the time frame of the alerts. The default time frame for displaying alerts is the last 7 days.
In addition, you can click the button (![]() ) to select filters that will control which RCA reports display on the Alerts page. The Selected Filter dialog appears:
) to select filters that will control which RCA reports display on the Alerts page. The Selected Filter dialog appears:

You can filter by log types (which typically match container names), service groups, hosts, tags, and more. Any RCA reports that match these attributes will be shown in the filtered view.
You can click the Views icon (![]() ) to change the view that is currently displayed on the Alerts page. A view is a predefined set of filters for the user interface. You can also create your own view based on the filters you use regularly. For example, if you set up your filters on the Selected Filter dialog to only see the most recent occurrence in a specific service group, for the past seven days, then after you set those filters, you can click on the Views menu to create a view for those filters. Later you can select that new view from the Views menu to get your customized set of filters.
) to change the view that is currently displayed on the Alerts page. A view is a predefined set of filters for the user interface. You can also create your own view based on the filters you use regularly. For example, if you set up your filters on the Selected Filter dialog to only see the most recent occurrence in a specific service group, for the past seven days, then after you set those filters, you can click on the Views menu to create a view for those filters. Later you can select that new view from the Views menu to get your customized set of filters.
Most of the filters on the Selected Filter dialog are self-explanatory. However, you should pay attention to the following filters, especially if you are not seeing the reports you want to see on the Alerts page:
-
Alert Occurrences. By default, only the first occurrence of a suggestion will be shown in the list, so that if the same type of alert occurs more than once, you will only see its first instance. You can change this if you wish to see all alert occurrences, the most recent alert occurrences, or other options.
If you are not seeing as many suggestions as you would like, set this filter to All alert occurrences.
-
Alert Rule State. You can filter by some or all custom alerts, suggestions, accepted alerts, or rejected alerts.
-
Significance. The Skylar AI assigns a value of Low, Medium, or High to each suggestion, based on how likely that suggestion is related to a problem. By default, only suggestions with a significance of Medium and High are shown on the Alerts page.
If you are not seeing as many suggestions as you would like, set this filter to Low or greater.
-
AI Assessment. Since not all suggestions that the Skylar AI generates will relate to problems that actually impact users, the Skylar AI attempts to reason over the data and assess whether a problem actually requires attention. This value is displayed as the AI Assessment. You can filter by Needs Your Attention and No Attention Needed.
You can further filter the log events by typing a text string or a PCRE2-compliant regular expression into the Search field at the top of the page. Regular expression filters should use the syntax "/regex/". You can also change the search scope by toggling between Core Events and All Events on the Search field.
You can also highlight any desired alphanumeric strings within the visible log events by typing text or a regular expression in the Highlight Events that Match field at the bottom right of the Alerts page. This field also displays on the RCA Report pages.
If you do not see a report in a time of interest where you believe a problem occurred, the Skylar AI might have suppressed it by the existing Significance filter settings.
You can also force the Skylar AI to do a deep scan and create a report on demand by clicking the button on the Settings menu (![]() ) and specifying a time of interest. Any Root Cause reports generated by that scan include a lightning bolt icon and the text "Result of RC Scan".
) and specifying a time of interest. Any Root Cause reports generated by that scan include a lightning bolt icon and the text "Result of RC Scan".
Using the Timeline Widget on the Alerts Page
The displays at the top of the Alerts page, and it lets you control which RCA report summaries display in the lower portion of the page:

The displays a list of the currently active filters at the top of the widget. For more information about filtering, see Using the Filters on the Alerts Page.
The main section of the contains a time-based chart with different icons that represent the following Skylar Automated RCA elements:
- Suggestion (
 ). A yellow diamond represents a potential problem found by the Skylar AI. If you go to the RCA Report page for that suggestion, you can choose to accept or reject that suggestion.
 - Accepted Alert (
 ). A green circle represents a suggestion that you or another Skylar Automated RCA user has accepted.
 - Custom Alert (
 ). A blue triangle represents a custom alert, which you or another user defined by writing a regular expression in Skylar Automated RCA that searches for a specific pattern.
 - Rejected Alert (
 ). A red triangle represents a suggestion that you or another Skylar Automated RCA user has rejected as not relevant to your environment. This icon only appears if you included Rejected as a filter for the Alert Rule State on the Filtering dialog.
When you click an icon in the , the summary view for the corresponding RCA report for that suggestion or alert moves the top of list below the . Click anywhere in the summary view to open its RCA Report page.
When you hover over an icon in the chart, a pop-up window appears with date and time information about that specific suggestion, along with a title and word cloud that contains suggestions and information about the likely root cause:

The also includes the following graphical elements:
-
Spike. A gray vertical line appears on the widget if too many suggestions or alerts exist for a specific time for the user interface to show them all:

You can click and drag the spike to the left or right to zoom in so you can see all of the suggestions for that specific time. Click to go back to the default view settings.
-
Log Lines timeline. Hover over this gray line to view a pop-up window that displays the number of log lines that have been ingested within this time interval.
-
Rare Events timeline. Hover over this red line to view a pop-up window that displays the number of events marked as rare, such as possible issues or problems, that have been ingested within this time interval. Rare events are often the most diagnostic anomalies in the logs.


Click the button to get the most recently updated data for this page.
When you suspect a problem, you can drill down and view the RCA report from the timeline or the report summary view. The RCA Report page for that suggestion or alert appears. For more information, see Root Cause Reports.
Root Cause Reports
On the Alerts page, you can click anywhere in the summary view for a suggestion to open the Root Cause Report page. This page displays a more complete list of log events compiled by the Skylar AI to describe this particular problem:

A typical Root Cause Report page contains the following elements:
-
If this is a suggestion, the top pane states "Suggested by AI/ML", and you have the option of accepting or rejecting the suggestion:
- If you accept the suggestion, Skylar Automated RCA will create a rule for the settings for that suggestion in the future.
- If you reject the suggestion, Skylar Automated RCA will no longer show a suggestion with the same settings as that suggestion in the widget.
For more information, see Assessing Suggestions.
-
At the top right of the page is a panel that shows the number of occurrences of this type of event, a drop-down for each occurrence, and a sine wave depicting the time of each occurrence over the course of two to three days:

-
The next pane down on the left contains a toggle for Core Events or All Events:
- Core Events display by default, and they are the set of events that the Skylar AI determined were the most likely events to explain the problem. Typically, the "core" list in an RCA report will contain somewhere between five and 25 log events.
- All Events includes an much more expanded list of events that includes other surrounding anomalous log events, warnings, and errors surrounding this core list of events.
-
On the same pane, you can also toggle between and for displaying the logs in the pane below. You can also click to view the log contents as text in a new dialog, in case you need to copy large amounts of text.
-
The large pane on the left contains the list of log events that make up the report. You can think of these as the key log lines that explain a problem. You will usually see a combination root cause indicator and symptom log lines. There are typically 10-100 log lines in a report that span multiple log types.

The columns in each log line show the event timestamp, a severity level, if available, the log type or service, and the text of the log. In addition, the following icons might appear to the left of some of the log events in the pane:
- Alert Key (). One or two log events in the report might display this icon, which signifies that the Skylar AI is using these event logs as a "signature" or alert rule to detect if the same type of alert occurs again in the future. Click the key icon () to view the definition of the key. To ensure accurate detection in the future, verify and edit the Alert Keys on the Settings menu () > Alert Rules & Settings page to match the one or two log events that best characterize this type of problem.
- Log line of interest (
 ). This icon appears next to any log events in the report that the Skylar AI has identified as possible events to explore. These events appeared in the report summary view on the Alerts page. This is just an informational icon.
You can hover over a log event to access the Actions button, which lets you perform additional actions related to that log event. For more information, see Additional Actions on the RCA Report Page.
- Alert Key (
-
The bottom pane on the left lists the numbers of events that are currently being displayed. This number changes if you click a word in the word cloud, or if you type text or a regular expression in the Highlight Events that Match field.
-
In the group of smaller panes to the right, the top pane contains the Insights panel, which contains an AI Assessment, a Summary, and Details that are generated with GPT Services that use new Generative AI models. You can enable or disable GPT services for a specific deployment of Skylar Automated RCA by using the GPT Services column on the Deployments page (Settings (
)> Deployments).
To determine the AI Assessment value, the Skylar AI attempts to reason over the data and assess whether a problem actually requires attention. Not all suggestions will include an AI Assessment, depending on the quality of the data. This value is shown in the Skylar Automated RCA user interface as an AI Assessment value of one of the following:
-
"No Attention Needed" for content that the Skylar AI assesses as unlikely to require immediate attention.
-
"Your Attention Needed" for content that the Skylar AI believes should be looked into.
-


-
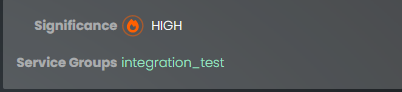
The next pane displays the significance of the alert assigned by the Skylar AI, from Low to High. The pane also includes the name of the Service Group impacted by the event.
-
The next pane displays the word cloud, which displays a set of keywords that the Skylar AI selected from the report. For each word, the font size denotes how rare it is (smaller is more rare), and the color denoting how "bad" the underlying events were. For example, a word for a critical event displays in red.
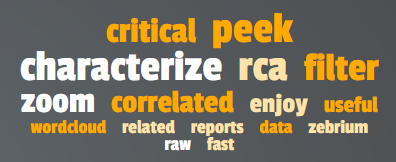
Click a word in the cloud to highlight the log events that contain that word in the list of logs on the left.
-
Under the word cloud is a histogram that lists the number of events over time. Under each gray rectangle in the histogram are vertical rows of colored dots that represent the log events from the list on the left, arranged by micro-service and host name. The horizontal location of the dots are chronological, based on the histogram at the top of the pane. When you click a dot, the corresponding log event is highlighted on the left.

Additional Actions on the Root Cause Report Page
On the Root Cause Report page, you can hover over a log event to access the Actions button, which lets you perform the following actions related to that log event:
- Peek. Peek mode shows the surrounding log lines from the log type (log stream) itself, and you can drill down on logs from a particular host or pod. This is similar to looking at the log file for a single log generator. To exit Peek mode, click the button.
- Annotations. For an accepted alert, you can add notes relevant to this event log. A note icon displays to the right of the event log, with a red badge listing the number of notes for that log.
- Related Incidents. Searches for other incidents that include this event. You can view the RCA report summaries for the related events for more information about the event.
- Include this event type in future alerts. Adds this event type to future alerts.
- Exclude this event type in future alerts. Excludes this event type from future alerts.
- Create a custom alert rule using this event type. Lets you create a custom alert rule using this event type.
- Advanced: These options let you create and use custom, include, and exclude Regular Expressions for this log event.
On the Root Cause Report page for an Accepted Alert, you can perform the following activities by clicking the button at the top of the page:
- Edit Alert Rule Metadata. Opens the Edit Alert Metadata dialog so you can update the metadata of the alert rule.
- Edit Alert Rule. Opens the Edit Alert Rule Keys pane so you can change the alert keys, if needed.
- Send One Time Alert. Lets you send a one-time alert to the notification channel you specify here. For more information, see Notification Channels.
- Reject this Alert. Changes the status of the accepted alert to rejected. For more information, see Rejecting a Suggestion.
- Revert to Suggested. Changes the status of the accepted alert to a suggestion.
The button on the Root Cause Report page for a custom alert lets you augment the alert with related suggestions that the Skylar AI uncovers in the surrounding log lines. You can use this button to help determine the root cause of a problem by showing a list of other alerts and suggestions that contain the same event.
Assessing Suggestions
The Skylar AI constantly scans logs for clusters of correlated anomalies that resemble problems. When it detects a potential problem, it proactively generates a suggestion. Be aware that while some suggestions will relate to important issues or problems, others will not be useful at all. As a result, do not think of suggestions in the same way that you normally think about alerts in other tools.
On a regular schedule, you should assess (or disposition) your suggestions in Skylar Automated RCA by accepting, rejecting, or ignoring the suggestions, as this will help improve the accuracy of the suggestions you will see in the future.
Accepting a Suggestion
You should Accept a suggestion if it relates to a real problem. If you accept the suggestion, Skylar Automated RCA creates a rule for the settings for that suggestion in the future. Accepting a suggestion turns it into a Accepted Alert and creates an Accepted Alert Rule.
If you accept a suggestion but no longer want to use it as a rule, you can revert it to make the rule back into a suggestion again.
To accept a suggestion:
-
On the RCA Report page for the suggestion, click . The Edit Alert Rule Metadata dialog appears.
-
Complete the following fields:
- Title. Edit the name for this rule, or add a name if no name exists.
- Summary. Expand this field and edit the summary for this rule, or add a summary if none exists.
- Detail. Expand this field and edit the detail text for this rule, or add detail text if none exists.
- Send Alert To. Alerts will be sent to all dashboards that you have configured, along with any notification channel you specify here. You can set up notification channels in the Integrations and Collectors page. For more information, see Notification Channels. This field is required, but you can also click as an option.
- Owner. Type the name of the owner of this rule.
- Alert Priority. Set the priority from P1 (highest) to P5 (lowest). Required.
- Manual Tags. Select a tag as needed.
- Alert Volume. Select whether you want to alert at most once per day, once per hour, or once per minute.
- Tracking URL. Add a URL to use for tracking this rule.
-
Click , the Edit Alert Rule Keys pane appears:

- You can use the currently selected keys, or you can edit one or both keys.
- To edit the alert keys, click a key from the top list to remove it. Click a key from the second list of keys to use that key instead.
- Click and then click to return to the Alerts page.

Rejecting a Suggestion
To reject a suggestion:
- On the RCA Report page for the suggestion, click . A dialog appears with the options to Ignore or Reject.
- Click if you are not sure if it is a good suggestion, which gives other members of your team the option of reviewing the suggestion. The suggestion will still appear on the Alerts page, but will not generate a suggestion in the future.
- Click if you are sure that the suggestion is not helpful. Skylar Automated RCA will hide the suggestion on the Alerts page, and will not notify you of future occurrences of the same suggestion type.
You can restore a rejected alert by filtering for Rejected Alerts, navigating to the RCA report page for that alert, and clicking . The alert is restored and marked as accepted, and Skylar Automated RCA creates a rule based on the selected event keys. You can edit the alert metadata as needed before saving it.
Key Use Cases for Suggestions and Root Cause Reports
This section covers the main use cases and concepts related to using Skylar Automated RCA, along with some tips and best practices.
Automated Root Cause Analysis Only
When you know a problem has occurred, you can look at Skylar Automated RCA alerts around the time of the problem. As long as details of the problem are present in the logs, you should find that the Skylar AI has generated a useful alert containing a report that explains the root cause of the problem. In this mode, the Skylar AI typically identifies the root cause more than 90% of the time.
Proactive Detection and Root Cause Analysis
The Skylar AI constantly scans logs for clusters of correlated anomalies that resemble problems. When it detects a potential problem, it proactively generates a suggestion. Be aware that while some suggestions will relate to important issues or problems, others will not be useful at all. As a result, do not think of suggestions in the same way that you normally think about alerts in other tools.
Instead of paging an operator with each new suggestion, as a best practice you should review suggestions at a convenient time periodically. When reviewing a suggestion, you can choose to:
- Accept the suggestion. This creates an alert rule that will detect if the same thing happens in the future.
- Reject the suggestion. This tells the Skylar AI not to create such an alert in the future.
- Ignore the suggestion without doing anything more; you will need to click the button for the suggestion first. Future occurrences will be filtered out by default.
Spending a few minutes each day reviewing suggestions from Skylar Automated RCA will help to improve the signal-to-noise ratio of future suggestions.
Deterministic Detection of Known Problems
After you accept a suggestion, you can use it to deterministically notify you if the same problem occurs again. This is like having a robot that can generate alert rules for you.
You can also build your own custom rules to detect already known problems. When custom rules trigger, the Skylar AI automatically generates a report with additional anomalies from the logs that can help to explain the root cause.
Getting the Best Results from Skylar Automated RCA
The Skylar AI will start working within a few minutes of logs arriving, detecting root causes for problems that occur in your environment, and presenting them as suggestions within the Skylar Automated RCA user interface. The signal-to-noise ratio improves with time, and typically achieves a good level in about 24 hours.
If you are not satisfied with the quality of the results, there are a few things you can do. The next few topics address this situation.
Ingest Complete Logs That Contain a Real Problem
Sometimes users connect Skylar Automated RCA to a software environment that is in a steady state, where nothing bad happens. In such cases, the logs do not actually contain any unusual events or significant errors. Naturally, in such cases, the Skylar AI will not be able to generate a useful Root Cause report.
Also, sometimes users will upload a subset of the logs, or even a single log file, which also degrades the ability of the Skylar AI to create meaningful root cause reports. For good results, connect Skylar Automated RCA to a software environment where real problems occur, or where you can deliberately break things.
You can achieve equivalent results by uploading static log files from a real problem, but in this case, be sure to ensure that the log collection is complete; anything that a human would need for troubleshooting should be included. Also, make sure that the files are tagged with correct metadata, and that the logs cover a time range of 24 hours or more before the problem occurred.
Review RCA Settings
A number of Skylar AI settings are visible on the Report Settings page (Settings (![]() ) > Root Cause Settings.
) > Root Cause Settings.
The most common setting to consider adjusting is the Root Cause Significance setting. Think of this like a filter level; the higher the significance setting, the more selective the Skylar AI will be in alerting. Significance is a cumulative score for each suggestion, based on the rareness and "badness" (log severity level) of the constituent log events within that alert. The higher the significance setting, the more rare and bad the Root Cause events have to be to show up in an alert feed.
"Badness" is derived from the log severity level, but there are additional hidden settings that can optionally scan the log text, as well as add your own keywords or strings that have a special meaning for your software stack.
If you find that Skylar Automated RCA is generating too many suggestions that amount to "noise", set the Root Cause Significance on this page to high.
There are other settings that might be useful in rare cases, such as excluding a particular log type entirely if it is not useful from a diagnostics perspective.
Be Mindful of Elapsed Time
By default, Skylar Automated RCA has a few settings that govern whether, and how well, a root cause report is created.
For instance, the Skylar AI needs some history to build an event catalog, to learn normal patterns, and to learn the dependencies between log streams. If you connect Skylar Automated RCA to a brand-new environment, for best results you should let it learn for about 24 hours before attempting tests. It is possible to get reasonable results much quicker, such as one to two hours after setup, but be prepared for noisier results.
Also, if the same kind of problem keeps occurring within a day, the Skylar AI might consider it "typical", and not create a root cause report for it at all.
A common issue users encounter is that they induce the same problem more than once, and do not realize that default filter settings will only show the first occurrence of the problem. For more information, see Using the Filters on the Alerts Page.
Review Service Group Setup
Service groups are a way to inform the Skylar AI about the failure domains within your log streams. Only log streams or files coming from services, containers, and hosts that could affect each other should be placed in the same service group. If you see log events in a RCA report that originate from completely unrelated services, you can partition them by changing your log collector settings to place them in different service groups. Aside from assigning a Service Group label per daemonset, you can also map sets of k8s labels (like apps, or namespaces) into a particular Service Group by editing the YAML file for the log collector.
Use Integrations to Separate High-priority Alerts
The Skylar AI creates RCA reports when it identifies clusters of rare events and bad events, such as events with higher log severity, like warning or error, that are highly unlikely to occur by random chance. Nevertheless, all such clusters may not be due to high priority (P1 or P2) issues, and therefore may not need immediate attention.
One way to distinguish the high priority issues from others is to set up incident management integrations with tools such as Opsgenie or PagerDuty. When an incident is created in one of these tools, due to an alert from some other observability tool, for example, the integration signals the Skylar AI to analyze logs from the same environment and respond with a RCA report. The report is automatically appended to the incident, such as in the timeline or notes fields.
As a result, Skylar Automated RCA reports can be matched up with incident priorities that were already assigned based on other rules.
You can also use inbound integrations to route alerts rather than incidents to Skylar Automated RCA. In this case Skylar Automated RCA will not be able to update any incident fields, because it does not receive incident notifications. However, Skylar Automated RCA will use the alerts as triggers to generate RCA reports, which will be sent to the outbound channels that are already configured.
Note that the Skylar AI will continue to proactively detect alerts, even when there is no signal from a third-party tool like PagerDuty or Opsgenie, but these proactive alerts can now be routed to lower priority alert queues.
Manage Alert Destinations
There are multiple ways to manage and segregate alerts. The easiest way is to set up notification channels for every combination of deployments or service groups that you would like to route uniquely.
Notification Channels provide a mechanism to define the methods that Skylar Automated RCA will use to send notifications from RCA reports. The supported types of notification channels include email, as well as Microsoft Teams, Slack, and Webex Teams notifications.

After you have created one or more notification channels, you can link any number of these to any RCA report created by the Skylar AI. Linking a set of notification channels to a RCA report will send notifications of future RCA reports of the same type to those channels.
For more information, see Notification Channels.
Use Routing Rules to Classify and Route Alerts
An even more powerful way to manage and route alerts is to set up routing rules on the Alert Rules & Settings page (Settings (![]() ) > Alert Rules & Settings), on the tab.
) > Alert Rules & Settings), on the tab.
This allows you to set up rules regarding service group, event labels (such as the Kubernetes app or pod name), as well as string matches in the actual log event. Each routing rule lets you automatically triage alerts and RCA reports, and send them to the appropriate destination.
For example, you might want to create a "Networking" tag for alerts that involves logs from Kubernetes pods that affect networking services, or contain key words related to network issues, and send them to an email alias or Slack channel for the networking team:

For more information about creating the rules for the Event Labels and Event Text fields, see Defining Rules.
Example: Ensure that the Skylar AI Engine Highlights Significant Events When They Happen Nearby
As an example, let’s say that your engineers know that a specific log event is useful from a troubleshooting perspective. If that event occurs in the vicinity of an auto-detected alert, you might want to ensure that it gets pulled into the core event list of any alert.
If you want this outcome, go to the Alert Rules & Settings page (Settings (![]() ) > Alert Rules & Settings), click the tab, and define the pattern to match these events.
) > Alert Rules & Settings), click the tab, and define the pattern to match these events.
For example, the rule below will make sure any events coming from the Postgres log stream that contain the keyword "restart" will be pulled into an RCA report if the Skylar AI detects unusual events within the vicinity of this restart event:

For more information about creating the rules for the Event Labels and Event Text fields, see Defining Rules.
Example: Ensure the AI/ML Engine Ignores Spam Events When They Happen Nearby
This configuration does the opposite of the previous feature. Let’s say your engineers know that a specific log event is spam and low value from a troubleshooting perspective. If you want to keep it from showing up in RCA reports, simply specify the event label and pattern match to tell the Skylar AI to exclude these events:
If you want this outcome, go to the Alert Rules & Settings page (Settings (![]() ) > Alert Rules & Settings), click the tab, and define the pattern to exclude this kind of event:
) > Alert Rules & Settings), click the tab, and define the pattern to exclude this kind of event:

For more information about creating the rules for the Event Labels and Event Text fields, see Defining Rules.