![]()
Use the following menu options to navigate the Skylar One user interface:
- To view a pop-out list of menu options, click the menu icon (
 ).
). - To view a page containing all of the menu options, click the Advanced menu icon (
 ).
).
What is a Geographic Map?
A geographic map is an interactive tool that visually represents location-based data associated with different devices or services. The map displays devices or services as nodes positioned according to their physical locations (longitude and latitude).
Each node on the map reflects the current status based on calculated health: for devices, this is determined by the most severe active event (device state); for services, it represents the service’s overall calculated health. By integrating data types with mapping layers, Skylar One provides intuitive insights into the health and location of a system or service.
In the AP2 Mochi release, geographic maps supported plotting devices. Starting with the AP2 Nougat release, maps also support plotting services, providing a more comprehensive view of network entities. For more information, see the AP2 release notes.
Viewing Geographic Maps
The Geographic Maps page (Maps > Geographic Maps) lists all geographic maps associated with your organization. Each map visually represents devices or services, also referred to as nodes, within your environment that have been discovered by Skylar One. Geographic maps position objects using their longitude and latitude coordinates and plot them based on the physical location of each device or service.
This page includes a table that lists key details for each map entry. The available columns might vary depending on the AP2 version you are using:
-
Name. The name assigned to the geographic map.
-
Organization. The organization associated with the map.
-
Last Edited By. The user who last modified the map.
-
Date Edited. The date and time of the most recent edit.
-
Created By. The user who originally created the map.
-
Map Entity. The entity type represented by the map.
-
ID. A unique identifier for the map record.
-
Date Created. The date and time the map was initially created.
In the AP2 Mochi release, the table included two columns by default: Name and Organization. Starting with the AP2 Nougat release, the table includes three additional columns by default: Map Entity Last Edited By, and Date Edited. You can add additional columns ID, Created By, and Date Created at any time; these optional columns are hidden by default.
If you do not see one of these columns, click the gear icon (![]() ) and then select Column Preferences to add or remove columns. You can also drag columns to different locations on the page or click on a column heading to sort the list by the values in that column. Skylar One retains any changes you make to the columns that appear on the page and will automatically recall those changes the next time you visit the page. For more information,
) and then select Column Preferences to add or remove columns. You can also drag columns to different locations on the page or click on a column heading to sort the list by the values in that column. Skylar One retains any changes you make to the columns that appear on the page and will automatically recall those changes the next time you visit the page. For more information,
To view a geographic map, go to the Geographic Maps page (Maps > Geographic Maps) and click the name of the map you want to view under the Name column. The geographic map view is split into two sections:
- The geographic map
- The geographic map table
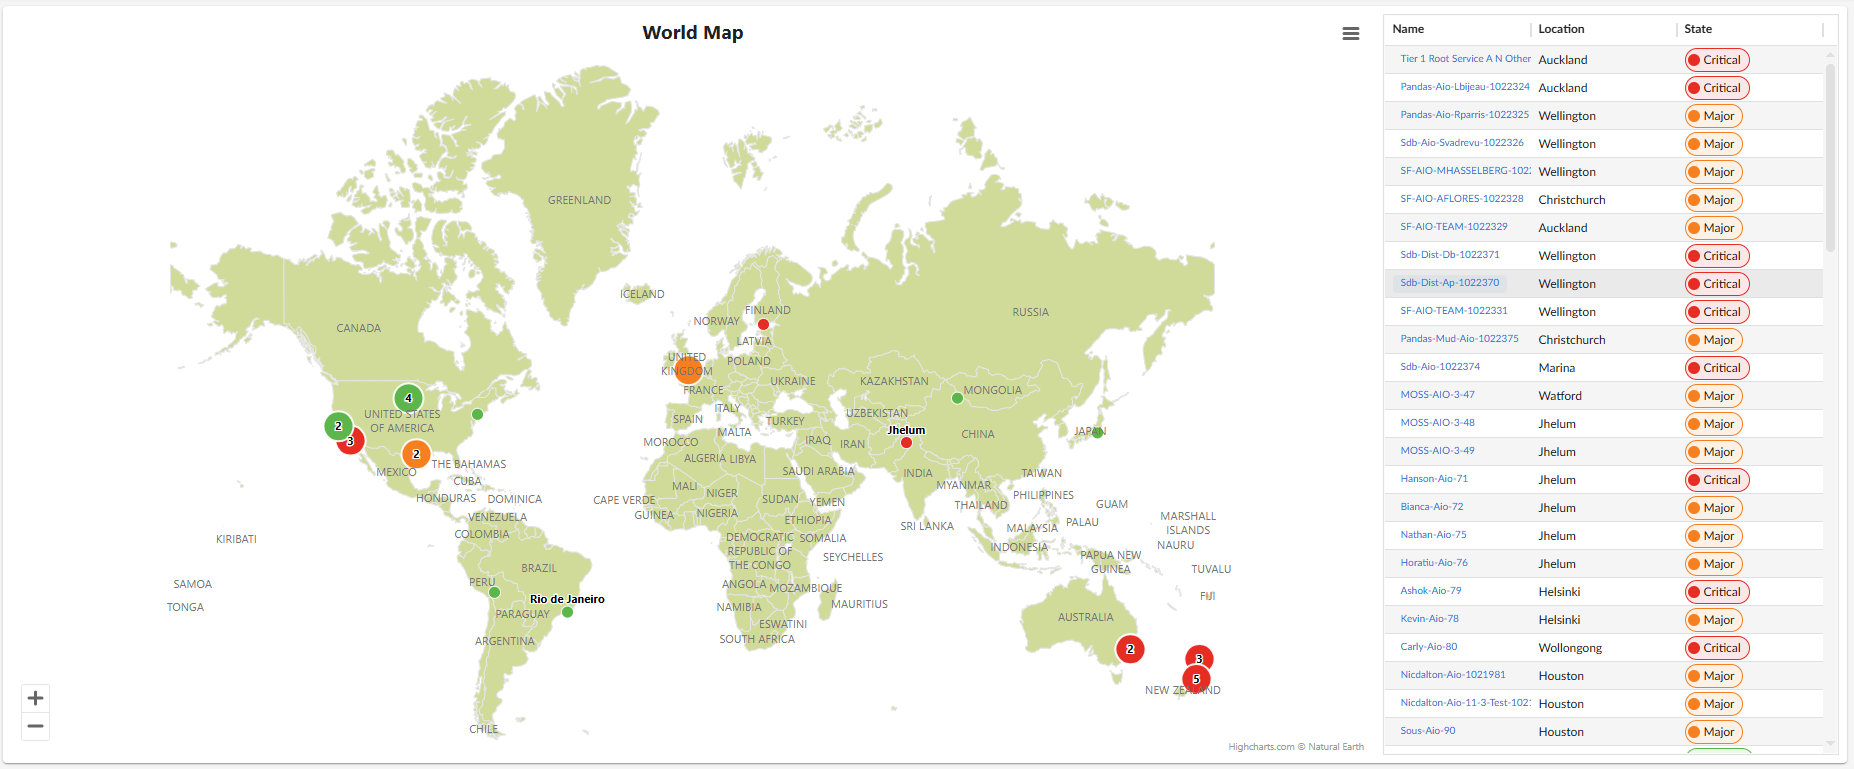
Viewing Geographic Map Nodes
Geographic maps display nodes based on the locations of devices or services. When the map is zoomed out, different node types indicate whether a location contains a single device or service, multiple devices or services, or when several locations are clustered together. As you zoom in, nodes representing multiple locations split into individual location nodes.
When the map is zoomed out, nodes use different icons to indicate whether a location contains a single device or service, multiple devices or services, or represents a cluster of several locations. As you zoom in, clustered nodes split into individual location nodes, each labeled with its location name. Hovering over a node displays a list of devices or services at that location. Zooming in further breaks down multi-location nodes into single-location nodes for detailed visibility.
Viewing the List of Devices or Services Associated with a Geographic Map
When viewing devices or services on the geographic map, a table to the right lists all items plotted on the map. You can customize which columns are shown, including additional attributes such as location details or device/service metadata. The set of available columns varies depending on the AP2 release version and whether you are viewing a geographic map of devices or services.
- Mochi Release: Column Definitions
- Nougat Release: Column Definitions (Devices)
- Nougat Release: Column Definitions (Services)
In the AP2 Mochi release, geographic maps supported plotting devices. Starting with the AP2 Nougat release, maps also support plotting services, providing a more comprehensive view of network entities.
If you do not see one of these columns, click the gear icon (![]() ) and then select Column Preferences to add or remove columns. You can also drag columns to different locations on the page or click on a column heading to sort the list by the values in that column. Skylar One retains any changes you make to the columns that appear on the page and will automatically recall those changes the next time you visit the page. For more information,
) and then select Column Preferences to add or remove columns. You can also drag columns to different locations on the page or click on a column heading to sort the list by the values in that column. Skylar One retains any changes you make to the columns that appear on the page and will automatically recall those changes the next time you visit the page. For more information,
Mochi Release: Column Definitions
The Mochi release includes a fixed set of 16 columns that list basic device and location details. These fields provide essential identifying and geographic information for each device.
| Column Name | Definition |
| Name |
The device name. Clicking the name takes you to the Device Investigator page for that device. |
| Device State |
The current condition of the device, based upon events generated by the device. |
| Device Organization |
The organization to which the device is assigned. |
| Location ID |
A unique identifier associated with the device’s assigned geographic location. |
| Location |
The location of a device based on its city name. |
| Latitude |
The geographic latitude of the device’s location. |
| Longitude |
The geographic longitude of the device’s location. |
| Street |
The street address associated with the device’s location. |
| City |
The city in which the device’s location resides. |
| State |
The state, province, or region of the device’s location. |
| Zipcode |
The postal or ZIP code of the device’s location. |
| Country |
The country associated with the device. |
| Domestic Region |
The internal region within the country in which the device's location resides. |
| Global Region |
The device's broader geographic classification such as EMEA and APAC. |
| Location Notes |
Any additional comments or annotations associated with the location. |
| Location Description |
A more detailed description of the location. |
Nougat Release: Column Definitions (Devices)
In the Nougat release, the table includes a comprehensive set of 38 columns that capture detailed device, classification, polling, and location information. These fields provide an expanded view of each device’s technical attributes and geographic context.
| Column Name | Definition |
| Favorite |
Indicates whether the device has been marked as a favorite for quick access. |
| ID |
A unique identifier assigned to the device. |
| Device Name |
The device name. Clicking the name takes you to the Device Investigator page for that device. |
| State |
The current condition of the device, based upon events generated by the device. |
| Hostname |
The network hostname associated with the device. |
| IP Address |
The primary IP address used to reach the device. |
| Date Added |
The date the device was added to the system inventory. |
| Date Created |
The original creation date of the device record. |
| Organization |
The organization to which the device is assigned. |
| Organization ID |
A unique identifier for the organization associated with the device. |
| Class |
The device’s classification category (for example: server, router, appliance). |
| Class ID |
A unique identifier associated with the device’s classification. |
| Category |
A broader grouping that describes the type or role of the device. |
| Category ID |
A unique identifier for the device’s assigned category. |
| Type |
Specifies the device type, often tied to its functional characteristics. |
| Collector Group |
The name of the collector group responsible for polling the device. |
| Collector Group ID |
A unique identifier for the assigned collector group. |
| Asset ID |
An asset‑tracking identifier used for inventory. |
| Last Poll |
The date and time when the device was most recently polled. |
| Uptime |
Shows how long the device has been running since its last restart. |
| Collection State |
Indicates whether the device is actively being polled or monitored. |
| SNMP Credential |
Identifies the SNMP credential used to poll the device. |
| SNMP Version |
Specifies the SNMP protocol version used for polling. |
| SL Agent |
Indicates whether the device is reporting through an installed ScienceLogic Agent. |
| ID (Location) |
A unique identifier associated with the device’s assigned geographic location. |
| Name (Location) |
The location of a device based on its city name. |
| Latitude (Location) |
The geographic latitude of the device’s location. |
| Longitude (Location) |
The geographic longitude of the device’s location. |
| Street (Location) |
The street address associated with the device’s location. |
| City (Location) |
The city in which the device’s location resides. |
| State (Location) |
The state, province, or region of the device’s location |
| Zipcode (Location) |
The postal or ZIP code of the device’s location. |
| Country (Location) |
The country associated with the device. |
| Domestic Region (Location) |
The internal region within the country in which the device's location resides. |
| Global Region (Location) |
The device's broader geographic classification such as EMEA and APAC. |
| Notes (Location) |
Any additional comments or annotations associated with the location. |
| Description (Location) |
A more detailed description of the location. |
| Organizations (Location) |
Lists the organizations linked to or operating within the location of the device. |
Nougat Release: Column Definitions (Services)
In the Nougat release, the table includes a comprehensive set of 32 columns that capture service identifiers, operational and health details, policy information, contact data, and complete location attributes. These fields provide a detailed snapshot of each service and its associated geographic and organizational context.
| Column Name | Definition |
| Favorite |
Indicates whether the service has been marked as a favorite for quick access. |
| ID |
A unique identifier assigned to the service. |
| Name |
The service name. Clicking the name takes you to the Service Investigator page for that service. |
| Description |
A short explanation of the service and what it represents. |
| Label |
A tag or label applied to categorize or group the service. |
| Type |
Specifies the type or classification of the service. |
| Health |
Shows the current health status of the service. |
| Availability |
Indicates whether the service is currently available or experiencing downtime. |
| Risk |
Represents the assessed risk level associated with the service. |
| Policy |
Displays the policy or rule set applied to the service. |
| Organization |
Identifies the organization associated with the service. |
| Date Updated |
The most recent date when service details were updated. |
| Last Updated By |
The user or system that last modified the service record. |
| Contact User |
The primary user contact associated with the service. |
| Contact Organization |
The organization responsible for or linked to the service’s primary contact. |
| Service Analysis |
Shows summary analysis or diagnostic insights related to the service. |
| Status |
Indicates the current operational status of the service. |
| Refresh Interval |
Specifies how frequently the service data is refreshed or polled. |
| ID (Location) |
A unique identifier associated with the device’s assigned geographic location. |
| Name (Location) |
The location of a device based on its city name. |
| Latitude (Location) |
The geographic latitude of the service’s location. |
| Longitude (Location) |
The geographic longitude of the service’s location. |
| Street (Location) |
The street address associated with the service’s location. |
| City (Location) |
The city in which the service’s location resides. |
| State (Location) |
The state, province, or region of the service’s location |
| Zipcode (Location) |
The postal or ZIP code of the service’s location. |
| Country (Location) |
The country associated with the service. |
| Domestic Region (Location) |
The internal region within the country in which the service's location resides. |
| Global Region (Location) |
The service's broader geographic classification such as EMEA and APAC. |
| Notes (Location) |
Any additional comments or annotations associated with the location. |
| Description (Location) |
A more detailed description of the location. |
| Organizations (Location) |
Lists the organizations linked to or operating within the location of the service. |
You can save the current list of items as a comma-separated list by clicking the gear icon (![]() ) and selecting Export to CSV.
) and selecting Export to CSV.
Interacting With Geographic Maps
There are several ways to interact with a geographic map. You can zoom in and out to reveal different levels of detail about a given location. Zooming in displays individual devices; zooming out clusters items. This applies to both device-oriented and service-oriented geographic maps. Additionally, when you hover your cursor over a node, it displays a list of all devices (by device name), or services (by service name) associated with that location.
-
Zoomed-out view (clustered locations): If multiple locations with devices or services are in close proximity, the map displays a single node showing the number of locations in that area. For example, a node marked "3" in California indicates that there are three locations nearby with devices.
-
Zoomed-in view (location separation): As you zoom in, the clustered node separates into individual nodes labeled by their specific location names, such as Los Angeles, Long Beach, and Marina. You can then hover your cursor over each location-specific node to see the devices or services in that particular area.
-
Single-location behavior: If there is only one location with devices or services in a region of the map, even when zoomed out, the map will display a single node marked by that location's name. Hovering over it with your cursor will show all devices or services in that location.
The map is automatically zoomed out by default to show a smaller map that includes all in-filter devices or services.
Managing Geographic Maps
You can create, edit, and delete geographic maps on the Geographic Maps page (Maps > Geographic Maps).
Creating a Geographic Map
Creating a geographic map is a two-step process. First, you must assign location data to the devices or services you want to display. This can be done either by importing location data in bulk using a spreadsheet and script, or by aligning devices or services through the Locations page (Manage > Locations) in the Skylar One user interface.
Once location data has been assigned, you can create a geographic map by selecting those devices or services from the Geographic Maps page (Maps > Geographic Maps).
How Location Data Is Used by Geographic Maps
Geographic maps display only devices or services that already exist in the Database Server and have location data assigned. Location data includes information such as latitude, longitude, and organization alignment. Devices or services without assigned location data will not appear as options when creating a geographic map.
Location data can be assigned using one of the following methods:
- Bulk import (spreadsheet and script). Best for initial setup or large-scale updates, where location data is assigned to many devices or services at once.
- Locations page (UI-based). Best for incremental updates, allowing you to align devices or services to locations directly through the interface.
Assigning location data through the Locations page is available only in systems running the AP2 Opera Cake release or later. Earlier AP2 releases require assigning location data using the bulk import workflow.
Both methods update the same underlying data and determine which devices or services are available when creating a geographic map.
Assigning Location Data Using Bulk Import
Device and service data can be managed in bulk using spreadsheets. This approach allows you to assign location data to multiple devices or services and upload them efficiently, rather than updating each individually. The process can be repeated as needed to keep location data current. Once uploaded, the devices or services will appear in the Geographic Maps page for selection during map creation.
Prerequisites for Bulk Assigning Location Data
To assign location data to devices or services using the bulk import method, you must first do the following:
Step 1: Download the "ScienceLogic: Geographic Maps" PowerPack
Download the latest version of the "ScienceLogic: Geographic Maps" PowerPack. This PowerPack contains the reports you will need to run to generate a spreadsheet of all of devices or services you want to plot on a geographic map. To do so:
-
Search for and download the PowerPack from the PowerPacks page at the ScienceLogic Support Center (Skylar One > PowerPacks, login required).
-
In Skylar One, go to the PowerPacks page (System > Manage > PowerPacks).
-
Click the Actions menu and choose Import PowerPack. The Import PowerPack modal appears.
-
Click and navigate to the "ScienceLogic: Geographic Maps" PowerPack.
-
Select the PowerPack file and click . The PowerPack Installer modal displays a list of the PowerPack contents.
-
Click . The PowerPack is added to the PowerPack Manager page.
Step 2: Download the "GeoMapImport" ZIP file
When creating a geographic map for devices or services, you need the bulk import file and its configuration file, both of which are included in the "GeoMapImport" ZIP file. The bulk import file uploads geographic data to the server. Later, you run a report (provided in the "ScienceLogic: Geographic Maps" PowerPack) to generate a spreadsheet of the devices or services you select, enter the location details in that spreadsheet, and upload the updated data to the Database Server.
To download the "GeoMapImport" ZIP file:
-
Go to the ScienceLogic Support Center and download version 11 of the "GeoMapImport" ZIP file locally to your machine from the AP2 Release Versions page (Skylar One > Downloads > AP2 Releases)
-
Select "GeoMapImport" from the Release Files table and then click the button located under the Release File Downloads section of the page. Doing so will download the ZIP file, Sciencelogic-geolocation-import-scripts-v11.zip.
-
Extract the ZIP file, locate the corresponding script (geo-location-import-device-v10.py for devices or geo-location-services-import-v1.py for services), and confirm that the target device is configured with the following:
-
Python 3.7 or later
-
Python PIP
-
The following Python packages installed:
- requests
- sys
- logging
- urlib3
- configparser
- os
- csv
- defaultdict
- time
- json
All of these packages are included by default when you install Skylar One.
-
The ZIP file includes both the bulk import script (geo-location-import-device-v10.py for devices and geo-location-services-import-v1.py for services) and its configuration file (geo_import.devices.cfg for devices and geo_import_services.cfg for services). You will need both files to create a geographic map.
Step 3 (Optional): Align The "ScienceLogic: Geographic Maps Usage" Dynamic Application
Align the "ScienceLogic: Geographic Maps Usage" Dynamic Application to the primary Database Server if you are on-premises, or ask a system administrator to align it to their virtual IP address if you are on a SaaS Skylar One deployment. Doing so will assist ScienceLogic with implementing future updates. After alignment, complete the steps outlined below:
-
Align the Dynamic Application to a Skylar One Database Server. For more information, see the section on
-
Make sure the Dynamic Application's Poll Frequency is set to run once every 24 hours. For more information, see the section on
-
Ensure the Dynamic Application runs successfully. For more information, see the section on
-
Schedule the "Geographic Maps V1 - Device location export" report for devices, or "Geographic Maps V1 - Service location export" for services, to run once a week and email the resulting .xlsx file to Geo-MapsPM@sciencelogic.com. For more information, see the section on
Files Required for the Bulk Import Method
To assign location data using the bulk import method, you must have the following files:
-
A spreadsheet file An Excel (.xlsx) that lists the devices or services to be assigned location data. This spreadsheet is generated by running either the Extract Location Data – Devices report or the Extract Location Data – Services report included in the "ScienceLogic: Geographic Maps" PowerPack. After generating the report, add the required location data and save the file in CSV UTF‑8 format.
-
Bulk import script The bulk import script uploads the devices or services and their associated location data from the spreadsheet into the Database Server. After the data is imported, the devices or services become available for selection in the Geographic Maps page.
-
Configuration file The configuration file controls how the bulk import script runs, including the target server and authentication details. This file is included in the same ZIP package as the bulk import script.
After extracting the "GeoMapImport" ZIP file (described in the prerequisites above), you will have both the bulk import script and its configuration file. The final step is to generate the spreadsheet, add location data, and run the script to upload the updated information. The script connects to the target Database Server specified in the configuration file and does not need to be run directly on the Database Server itself.
Once this process is complete, you can create a geographic map using the imported location data.
-
Generate the spreadsheet . Run the appropriate Extract Location Data report to generate an Excel spreadsheet containing the devices or services to be plotted.
-
Assign location data. Add latitude, longitude, and other optional location fields to the spreadsheet and save it in CSV UTF‑8 format.
-
Import the location data. Run the bulk import script to upload the updated spreadsheet to the Database Server.
-
Create the geographic map. Select the imported devices or services from the Geographic Maps page. Only entities with assigned location data will appear as options.
Generating the Excel Spreadsheet
To generate the Excel spreadsheet used to add location data to devices or services:
- Go to the Reports page.
- If you are creating a geographic map that plots devices, select Run Report > Asset Management > Location Data Extract - Devices. If you are creating a geographic map that plots services, Select Run Report > Asset Management > Location Data Extract - Services.
- For geographic maps that plot devices, in the Select devices by field, choose the devices you want to include in the report. You can list devices by Organization, Category, or Device Group. To select specific devices instead of all devices within these groups, select the Select individual devices checkbox and then select the individual devices you want to include.
- For geographic maps that plot services, select one or more organizations to include in the report. All services belonging to the selected organizations will be included automatically, or you can select the All Organizations checkbox to include every organization and all of their services.
- In the Output format field, select Microsoft Excel 2007+ Spreadsheet (.xlsx).
- Click .
Alternatively, you can select individual devices by selecting the Select individual devices checkbox, then selecting the individual devices you want to include in the report.
The devices or services selected when generating this report are uploaded to the Database Server, where they become available for selection when creating a geographic map.
Assigning Location Data to Devices or Services
To assign location data to the devices or services you want to add to your geographic map:
- When the report is generated, open the report spreadsheet and edit the necessary columns:
- For devices, the mandatory fields are:
- Device ID. The unique identifier assigned to the device.
- Latitude. The geographic latitude of the device’s location.
- Longitude. The geographic longitude of the device’s location.
- Organization ID. The unique identifier for the organization associated with the device.
- For services, the mandatory fields are:
- Service GUID. The globally unique identifier assigned to the service.
- Latitude. The geographic latitude of the service’s location.
- Longitude. The geographic longitude of the service’s location.
- Organization ID. The unique identifier for the organization associated with the service.
- Optional fields:
- Device Name. The name of the device.
- Service Name. The name of the service.
- Location Name. The location name of the device or service that will appear on your geographic map.
- Organization. The organizations to which the device or service is aligned. These organizations will appear on your geographic map.
- Longitude. The measurement of the device's or service's position north or south.
- Latitude. The measurement of the device's or service's position east or west.
- Global region. The broad area where the device or service is located, such as North America or Asia-Pacific.
- Country. The nation where the device or service is located.
- Domestic region. The internal or local area within a country where the device or service is located, such as Northeast or West Coast.
- City. The city or town where the device or service is located.
- Street. The street address or road name for the device's or service's location.
- Zip code. The postal code for the device's or service's location.
- Description. A brief explanation of the device's or service's purpose or details.
- State. The state where the device or service is located.
- Note. Any additional information relevant to the device or service.
The Service Name column is available only when creating a geographic map that plots services and when you have downloaded the "Location Data Extract - Services" report.
The cells under the Location Name column will be empty. This field is optional but highly recommended, as these are the location names that will appear on your geographic map.
If this is your first time creating a report for geographic maps, the cells under the Longitude and Latitude columns in the spreadsheet will be empty. You must supply values for each device in these two columns.
Populate the optional fields in the spreadsheet depending on the level of complexity required for your search filters.
- For devices, the mandatory fields are:
- After you have filled in all the required details, save the spreadsheet as a CSV file in UTF-8 format.
Importing location data
- For a geographic map that plots devices, move the geo-location-import-device.v10.py bulk import script file, the geo_import_devices.cfg script configuration file, and the spreadsheet file you have created and updated in the previous step to the same folder. If you are creating a geographic map that plots services, move the geo-location-import-services.v1.py bulk import script file, the geo_import_services.cfg script configuration file, and the spreadsheet file you have created and updated in the previous step to the same folder.
If you are working from an environment with no access to the Internet (air-gapped installations), copy the bulk import script file, script configuration file, and the spreadsheet to a Skylar One appliance by using SSH to access the Skylar One appliance. Then, move all files to the same folder.
- Update the geo_import_devices.cfg for devices or the geo_import_services.cfg script configuration files by adding the following information to the fields shown:
- URL. Enter the URL of the Skylar One stack to which you will upload the file, which is the IP address of the Database Server.
- Username. Enter the username used to connect to Skylar One.
- Password. Enter the password used to connect to Skylar One.
- Excel File Path. Enter the CSV file name you have created in the Generating the Excel Spreadsheet section above.
- Either go to the console of the Skylar One Database Server or use SSH to access the Database Server, then run the following Python script: python3.11 geo-location-import-device-v10.py. For a geographic map that plots services, run the following Python script: python3.11 geo-location-import-services-v1.py. The console will display 5 different logging levels with a number assigned to them.
- Enter the level of information you want on your geographic map by entering the number corresponding to the desired logging level. The script will read the spreadsheet file, de-duplicate locations, add new locations to Skylar One, and associates devices or services with location data.
- The script will connect with the GraphQL interface of the IP address, username, password, and Excel file path specified in the geo_import.cfg script configuration file. The script will also create a list of single entries for each device or service and their location. If devices or services have identical locations (longitude and latitude), the script will associate them to a single location, which is displayed as a single entry. This is so that the script can capture the number of unique locations in your spreadsheet report.
Alternatively, you can connect through the console of a server that has SSH access to the Database Server. In air-gapped environments, you can SSH into the Database Server itself.
Assigning Location Data Through the Locations Page
This method allows you to assign and manage location data directly through the user interface by using the Locations page (Manage > Locations). Instead of generating a spreadsheet and running bulk import scripts, you can select an organization, view the devices or services associated with it, and align those entities to locations through guided modals. Once devices or services are aligned, they automatically become available for selection when creating a geographic map.
For more information on managing locations and aligning devices or services to them, see the
Creating the Geographic Map
After you have assigned location data to your devices or services, they will appear as options when creating the map. To create the map:
-
Go to the Geographic Maps page (Maps > Geographic Maps).
-
Click the button.
-
Enter information in the following fields:
- Map Name. Enter a name for your geographic map.
- Organization. Select the organization that can view this map.
- Entity Type. Select Device or Service to choose whether to plot devices or services.
The Entity Type field is available starting in AP2 Nougat.
-
Under the Search and Filter Devices To Map field, enter the filter expression to specify which devices will appear in the geographic map.
-
Click .
If you have selected Service in the Entity Type field from the previous step, this field will be Search and Filter Services To Map.
A filter expression, sometimes referred to as an expression match, is used to locate and filter data from a database. This can be any combination of alphanumeric and multi-byte characters, up to 64 characters in length. Skylar One's expression matching is case-sensitive. For details on the regular-expression syntax allowed by Skylar One, see http://www.python.org/doc/howto/.
You can sort and filter the column data in the table on the page by clicking the Filter field under the column names.
Editing a Geographic Map
To edit an existing geographic map:
-
Go to the Geographic Maps page (Maps > Geographic Maps) and find the map you want to edit.
-
Click the Actions icon (
 ) for the geographic map you want to edit, then select Edit.
 -
You can make changes to the following fields:
- Map Name. The name for your geographic map.
- Organization. The organization that can view the map.
- Search and Filter Devices To Map. The filter expression to specify which devices appear in the geographic map.
If you have selected Service in the Entity Type field when creating the map, this field will be labeled Search and Filter Services To Map.
-
After you are done making your changes, click .
Deleting a Geographic Map
To delete a geographic map:
-
Go to the Geographic Maps page (Maps > Geographic Maps) and find the map you want to delete.
-
Click the Actions icon (
) for the geographic map you want to delete, then select Delete. The Delete Geographic map modal appears. -
Click to confirm.