The Anomaly Detection component of Skylar Analytics uses Skylar AI to identify unusual patterns that do not conform to expected behavior. Anomaly Detection provides always-on, unsupervised, machine-learning-based monitoring that automatically identifies unusual patterns in the real-time performance metrics and resource data that it observes. Anomalies do not necessarily represent problems or events to be concerned about; rather, they represent anomalous behavior that might require further investigation.
You can view anomalies on the Anomaly Detection page in SL1 and on the tab on the Device Investigator page for each device.
Anomaly Detection with Skylar Analytics works with all of the Performance Dynamic Applications in all SL1 PowerPacks.
What is Anomaly Detection?
Anomaly detection is a technique that uses machine learning to identify unusual patterns that do not conform to expected behavior. Anomaly detection provides always-on, unsupervised machine learning-based monitoring that automatically identifies unusual patterns in the real-time performance metrics and resource data that it observes.
Anomalies do not necessarily represent problems or events to be concerned about; rather, they represent unexpected behavior that might require further investigation.
Anomaly detection is calculated and displayed in the SL1 user interface for all Dynamic Application metrics. This detection is enabled by default and cannot be disabled.
You can control which device data gets sent to Skylar for analysis based on the organization aligned with the device or devices. All devices in the selected organization will get anomaly detection analysis.
For more information, see Enabling Skylar Analytics for One or More SL1 Organizations.
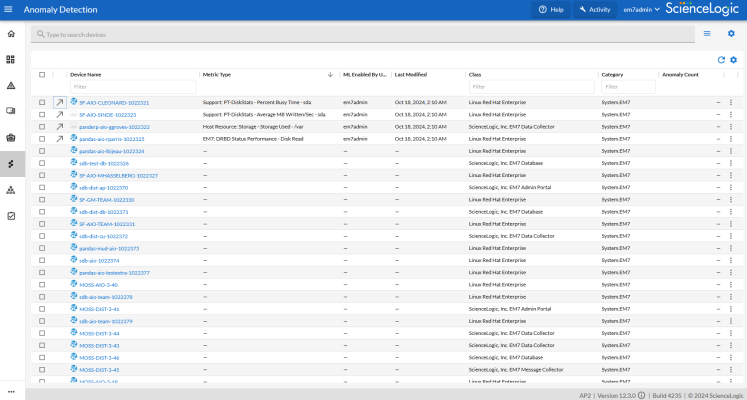
You can view a list of all devices that are being monitored for anomalies on the Anomaly Detection page in SL1 (Skylar AI (![]() ) > button for Skylar Anomaly Detection):
) > button for Skylar Anomaly Detection):
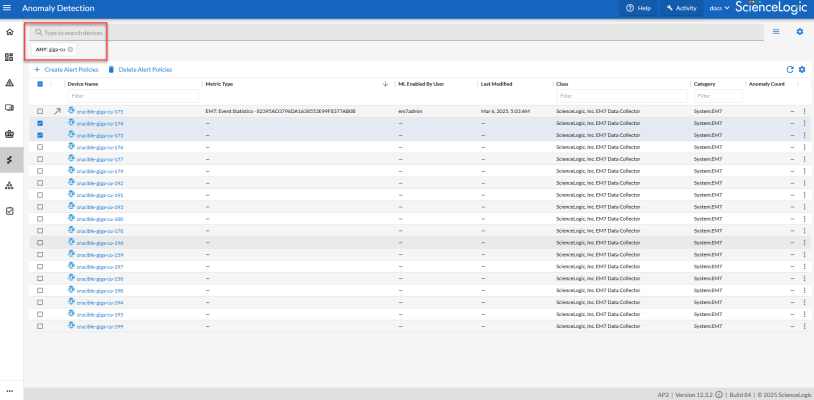
To filter the list of devices on this page by name, type some or all of a device name in the Search field at the top of the window, based on the device-naming convention you used for your devices:
On the Anomaly Detection page, the Anomaly Count column does not currently display the number of anomalies. Go to the tab on the Device Investigator page for a device to see the correct anomaly count. You can sort the Anomaly Count column to see which anomalies are happening the most often.
How Anomaly Detection Works
Initially, a historic profile for anomaly detecting is based on 24 hours of data. These values include minimum and maximum values, median lag differences, and median absolute deviation of those lag values (capturing the variance of lag values from the median lag value.)
Skylar AI uses these statistics to create bands at prediction time that determine anomalous and non-anomalous behavior.
Skylar AI periodically re-calculates and blends these values with the previously calculated values. In general, if the recent period shows more extreme behavior, then Skylar AI uses these values to update the model. If the recent period is less extreme, then the model statistics will move in the direction of these less extreme values.
At prediction time, the bands also take into consideration recent behavior that was deemed non-anomalous, allowing for gradual trends that go outside the pre-computed bands.
With the final min/max expected values computed, Skylar AI considers anything outside of those values to be anomalous. Skylar AI calculates a score based on the distance outside of the band, normalized by a value based on typical point-by-point changes.
Viewing Graphs and Data for Anomaly Detection
After SL1 begins performing anomaly detection for a device, you can view graphs and data about each anomaly. Graphs for anomalies appear on the following pages in SL1:
- The Anomaly Detection page (Skylar AI (
 ) > button for Skylar Anomaly Detection).
 - The tab in the Device Investigator.
- The tab in the Service Investigator for a business, IT, or device service.
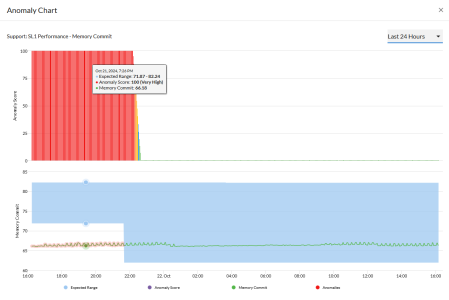
You can view the anomaly detection graphs for devices by clicking the Open icon (![]() ) in the first column of the table on the inventory page. The Anomaly Chart modal appears, displaying the "Anomaly Score" chart above the chart for the specified metric you are monitoring.
) in the first column of the table on the inventory page. The Anomaly Chart modal appears, displaying the "Anomaly Score" chart above the chart for the specified metric you are monitoring.
The "Anomaly Score" chart displays a graph of values from 0 to 100 that represent how far the real data for a metric diverges from its expected values. The anomaly score indicates the significance of an anomaly, with a greater severity as the number gets bigger. The lines in the chart are color-coded by the severity level of the event that gets triggered as the data diverges further.
The score is basically a running sum over a small window of time, so after the anomalies stop, the score will drop to zero over that time.
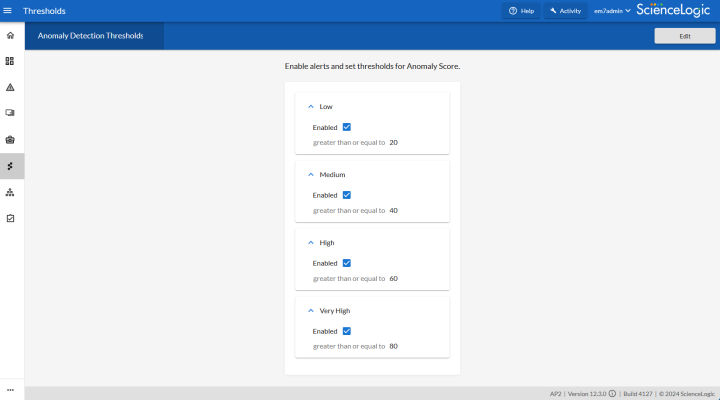
You can define the thresholds for the "Anomaly Score" chart on the Anomaly Detection Thresholds page (Skylar AI (![]() ) > button). You can also use this page to specify whether the Anomaly Score values generate alerts in SL1.
) > button). You can also use this page to specify whether the Anomaly Score values generate alerts in SL1.
For more information, see Enabling Thresholds and Alerts for the Anomaly Chart.
The second graph displays the following data:
- A blue band representing the range of probable values that SL1 expected for the device metric.
- A green line representing the actual value for the device metric.
- A red dot indicating anomalies where the actual value appears outside of the expected value range. The number of the red dots are listed in the Anomaly Count column on the tab of the Device Investigator page.
You can hover over a value in one of the charts to see a pop-up box with the Expected Range and the metric value. The Anomaly Score value also displays in the pop-up box, with the severity in parentheses: Normal, Low, Medium, High, or Very High.
You can zoom in on a shorter time frame by clicking and dragging your mouse over the part of the chart representing that time frame, and you can return to the original time span by clicking the button.
Enabling Thresholds and Alerts for the Anomaly Chart
You can define the thresholds for the "Anomaly Score" chart that displays on the Anomaly Chart modal, and whether those values generate alerts in SL1, on the Anomaly Detection Thresholds page (Skylar AI (![]() ) > button).
) > button).
You can view the alert levels when you hover over a value in one of the charts on the Anomaly Chart modal. The Anomaly Score severity level displays after the index value, in parentheses: Normal, Low, Medium, High, or Very High:
An Anomaly Score severity level of Normal is assigned to a value in the chart that is lower than the lowest enabled alert level. For example, if the threshold for the Low severity is enabled and set to 20 or higher, an Anomaly Score of 16 would have a severity level of Normal.
To edit the Anomaly Score thresholds:
- On the Anomaly Detection Thresholds page (Skylar AI (
 ) > button), click .
 - For each of the four severity levels, from Low to Very High, you can click to check Enabled to have SL1 generate an alert when the Anomaly Score is equal to or greater than the threshold for that severity level.
- You can edit the threshold value for each level if SL1 is generating too many (or not enough) anomalies of a certain severity level.
- For example, if you want to enable a Low level alert when the Anomaly Score value is between 25 and 39, you would go to the Low panel, select Enabled, and update the value from "20" to "25".
- Click .
- You can then edit an event policy that uses alerts based on the settings on this page to generate events in SL1. For more information, see Creating an Event Policy for Anomalies.
Enabling Anomaly Detection Events for Specific Metrics
While anomaly detection is enabled automatically as soon as you enable Skylar Analytics for one or more SL1 organizations, you can also set up anomaly detection events for specific Dynamic Application metrics on a device. When this is configured, an event policy is triggered when an anomaly is detected for that metric. Anomaly detection events display with an Event Source of Skylar AI on the Events page in SL1.
Enabling Anomaly Detection Events for a Metric on the Anomaly Detection Page
You can configure anomaly events for specific metrics on the Anomaly Detection page of SL1 for one or more devices.
To enable anomaly detection events for a metric for one or more devices:
-
In SL1, go to the Anomaly Detection page (Skylar AI (
 ) > button for Skylar Anomaly Detection)
 -
Click the checkbox for the device or devices on which you want to enable anomaly detection events and click the tab on the Device Investigator page.
To filter the list of devices on this page by name, start typing the naming convention you used for your devices in the Search field at the top of the window.
-
Click the button. The Select Available Metrics modal appears.
-
In the Select Metric drop-down, click the name of the metric on which you want to enable anomaly detection events for the device.
-
For some metrics, a second drop-down field might display that enables you to specify the device directory. If this field appears, click the name of the directory on which you want to enable anomaly detection. Also, if the same number or value appears more than once in the Select Metric drop-down, select the first instance of that number or value; this is a known issue that will be addressed in a future release of SL1
-
Click . That metric is enabled for events for that device, and you can view the metric on the Anomaly Detection page in SL1.
Enabling Anomaly Detection Events for a Metric on the Device Investigator Page
To enable anomaly detection events for a metric on the Device Investigator page:
-
On the Devices page (
), click the Device Name for the device on which you want to enable anomaly detection events and click the tab on the Device Investigator page.
If the tab does not already appear on the Device Investigator, click the More drop-down menu and select it from the list of tab options.
If your SL1 system does not have any Dynamic Applications enabled, you will see only dashes (—) listed in the table on the tab for a device.
-
On the tab, click the Actions icon (
 ) for any of the listed metrics and select Enable. The Select Available Metrics modal appears.
 -
In the Select Metric drop-down, click the name of the metric on which you want to enable anomaly detection events for the device.
-
For some metrics, a second drop-down field might display that enables you to specify the device directory. If this field appears, click the name of the directory on which you want to enable anomaly detection.
- Click . That metric is enabled for events for that device.
To disable anomaly detection events for a metric, click the Actions icon (![]() ) for that metric and select Disable.
) for that metric and select Disable.
Creating an Event Policy for Anomalies
You can create additional event policies that will trigger events in SL1 when anomalies are detected for those devices.
Because anomalies do not always correspond to problems, ScienceLogic recommends creating an event policy only for scenarios where anomalies appear to be correlated with some other behavior that you cannot otherwise track using an event or alert.
Because the anomaly detection model is constantly being refined as SL1 collects more data, you might experience a larger number of anomaly-related events if you create an event policy for anomalies soon after enabling anomaly detection compared to if you were to do so after SL1 has had an opportunity to learn more about the device metric's data patterns.
To create an event policy for anomalies:
- Go to the Event Policies page (Events > Event Policies, or Registry > Events > Event Manager in the classic SL1 user interface).
- On the Event Policies page, click the button. The Event Policy Editor page appears.
- In the Policy Name field, type a name for the new event policy.
- Click the tab.
- In the Event Source field, select Internal.
- In the Match Criteria field, click the button.
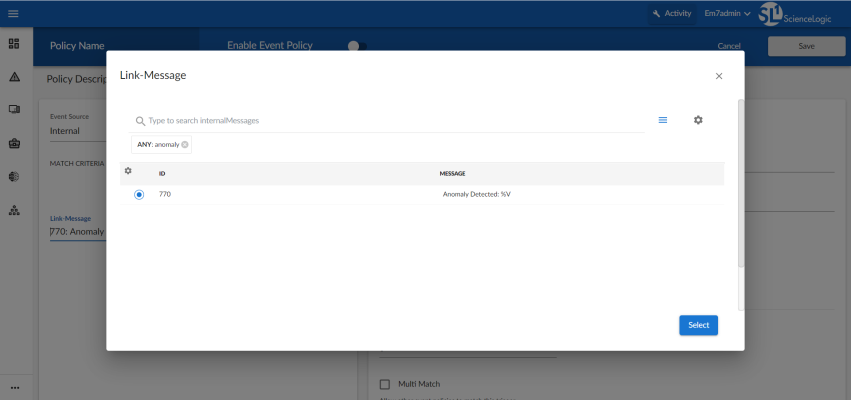
- In the Link-Message modal page, search for "Anomaly" to locate the message "Anomaly Detected: %V":
- Click the radio button for the message "Anomaly Detected: %V", and then click .
- Complete the remaining fields and tabs in the Event Policy Editor based on the specific parameters that you want to establish for the event. For more information about the fields and tabs in the Event Policy Editor, see Defining an Event Policy.
- To enable the event policy, click the Enable Event Policy toggle so that it is in the "on" position.
- When you are finished entering all of the necessary information into the event policy, click .
Using Anomaly-related Events to Trigger Automated Run Book Actions
SL1 includes automation features that allow you to define specific event conditions and the actions you want SL1 to execute when those event conditions are met. You can use these features to trigger automated run book actions whenever an anomaly-related event is generated in SL1.
To use anomaly-related events to trigger automated run book actions:
-
Go to the Automation Policy Manager page (Registry > Run Book > Automation).
-
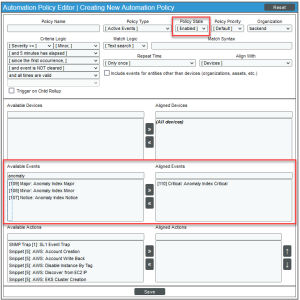
Click the button. The Automation Policy Editor page appears:
- In the Policy State field, select Enabled.
- In the Available Events field, search for and select one or more anomaly-related event policies, and then click the right-arrow icon to move each event to the Aligned Events field. For more information about anomaly-related events, see Creating an Event Policy for Anomalies.
- In the Available Actions field, search for and select one or more run book actions that you want to run when the anomaly event from step 4 occurs. Click the right-arrow icon to move each action to the Aligned Actions field. For example, you might want to send an email or create a ticket for that anomaly event.
- Complete the remaining fields on the Automation Policy Editor page based on the specific parameters that you want to establish for the automation policy. For more information about the fields on the Automation Policy Editor page, see Automation Policies.
- When you are finished, click .
