![]()
Version 102 of the Cisco CUCM: SL1 Dashboards PowerPack includes autoselect for context-driving widgets and the addition of events and forecast widgets to some dashboards.
NOTE: These dashboards are intended for use only in the new SL1 user interface and will not load in the classic ScienceLogic platform user interface.
- Minimum Required SL1 Version: 8.12.1
- Minimum Required AP2 Version: 5.125.44
- Minimum Required Widget Components Version: 2.175.0
- Minimum Required Cisco: CUCM Cisco Unified Communications Manager PowerPack Version: 111
Before You Install or Upgrade
Before installing Cisco CUCM: SL1 Dashboards PowerPack version 102, you must first ensure that you are running version 8.12.1 or later of SL1.
NOTE: For details on upgrading SL1, see the appropriate Release Notes.
You must also import and install theCisco: CUCM Cisco Unified Communications ManagerPowerPack version 111 or later before installing the PowerPack.
Installation or Upgrade Process
To install this PowerPack:
- Familiarize yourself with the Known Issues for this release.
- See the Before You Install or Upgrade section. If you have not done so already, upgrade your system to the 8.12.1 or later release.
- Download the "Cisco CUCM: SL1 Dashboards" version 102PowerPack from the Support Site to a local computer.
- Go to the PowerPack Manager page (System > Manage > PowerPacks). Click the menu and choose Import PowerPack. When prompted, import "Cisco CUCM: SL1 Dashboards" version 102.
- Click the button. For details on installing PowerPacks, see the chapter on Installing a PowerPack in the PowerPacks manual.
Features
The following dashboards are included in version 102 of the Cisco CUCM: SL1 Dashboards PowerPack:
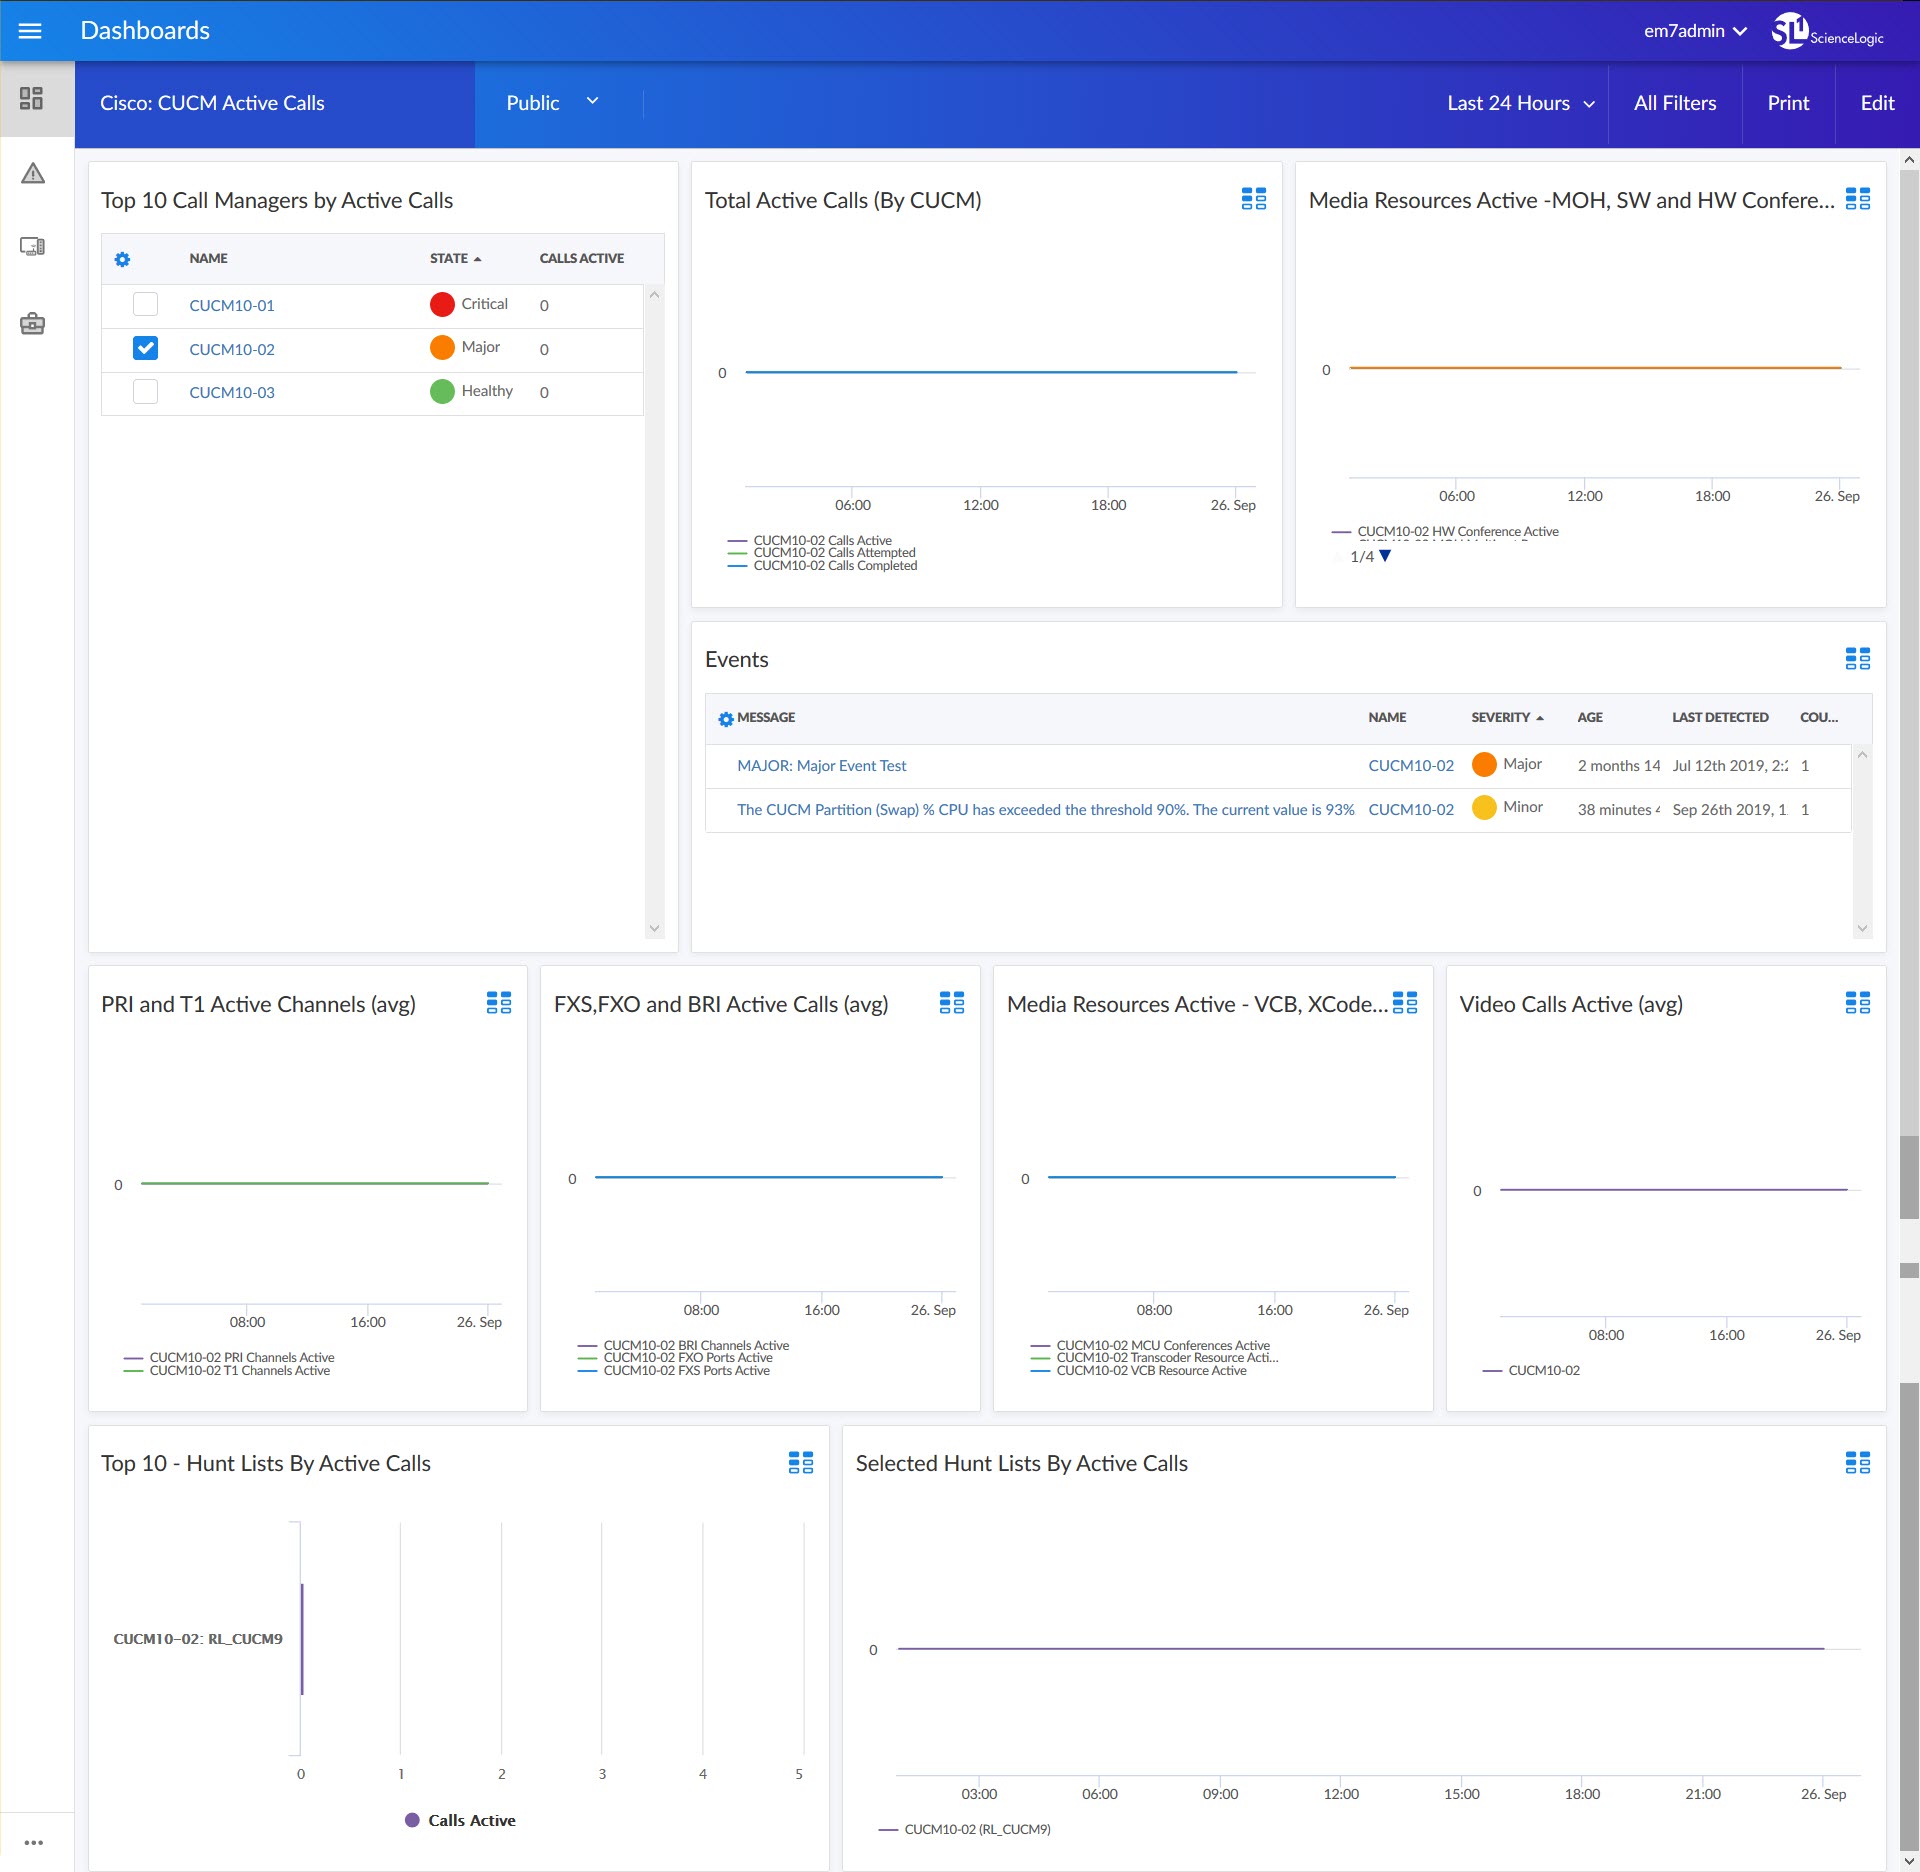
- A "Cisco: CUCM Active Calls" dashboard, which includes the following widgets that display overview data about your active CUCM calls:
- Top 10 Call Managers by Active Calls
- Total Active Calls by CUCM
- Media Resources Active - MOH, SW, and HW Conference
- Events
- PRI and T1 Active Channels (avg)
- FXS, FXO, and BRI Active Calls (avg)
- Media Resources Active - VCB, XCoders, MCU Conferences
- Video Calls Active (avg)
- Top 10 Hunt List by Active Calls
- Selected Hunt Lists by Active Calls
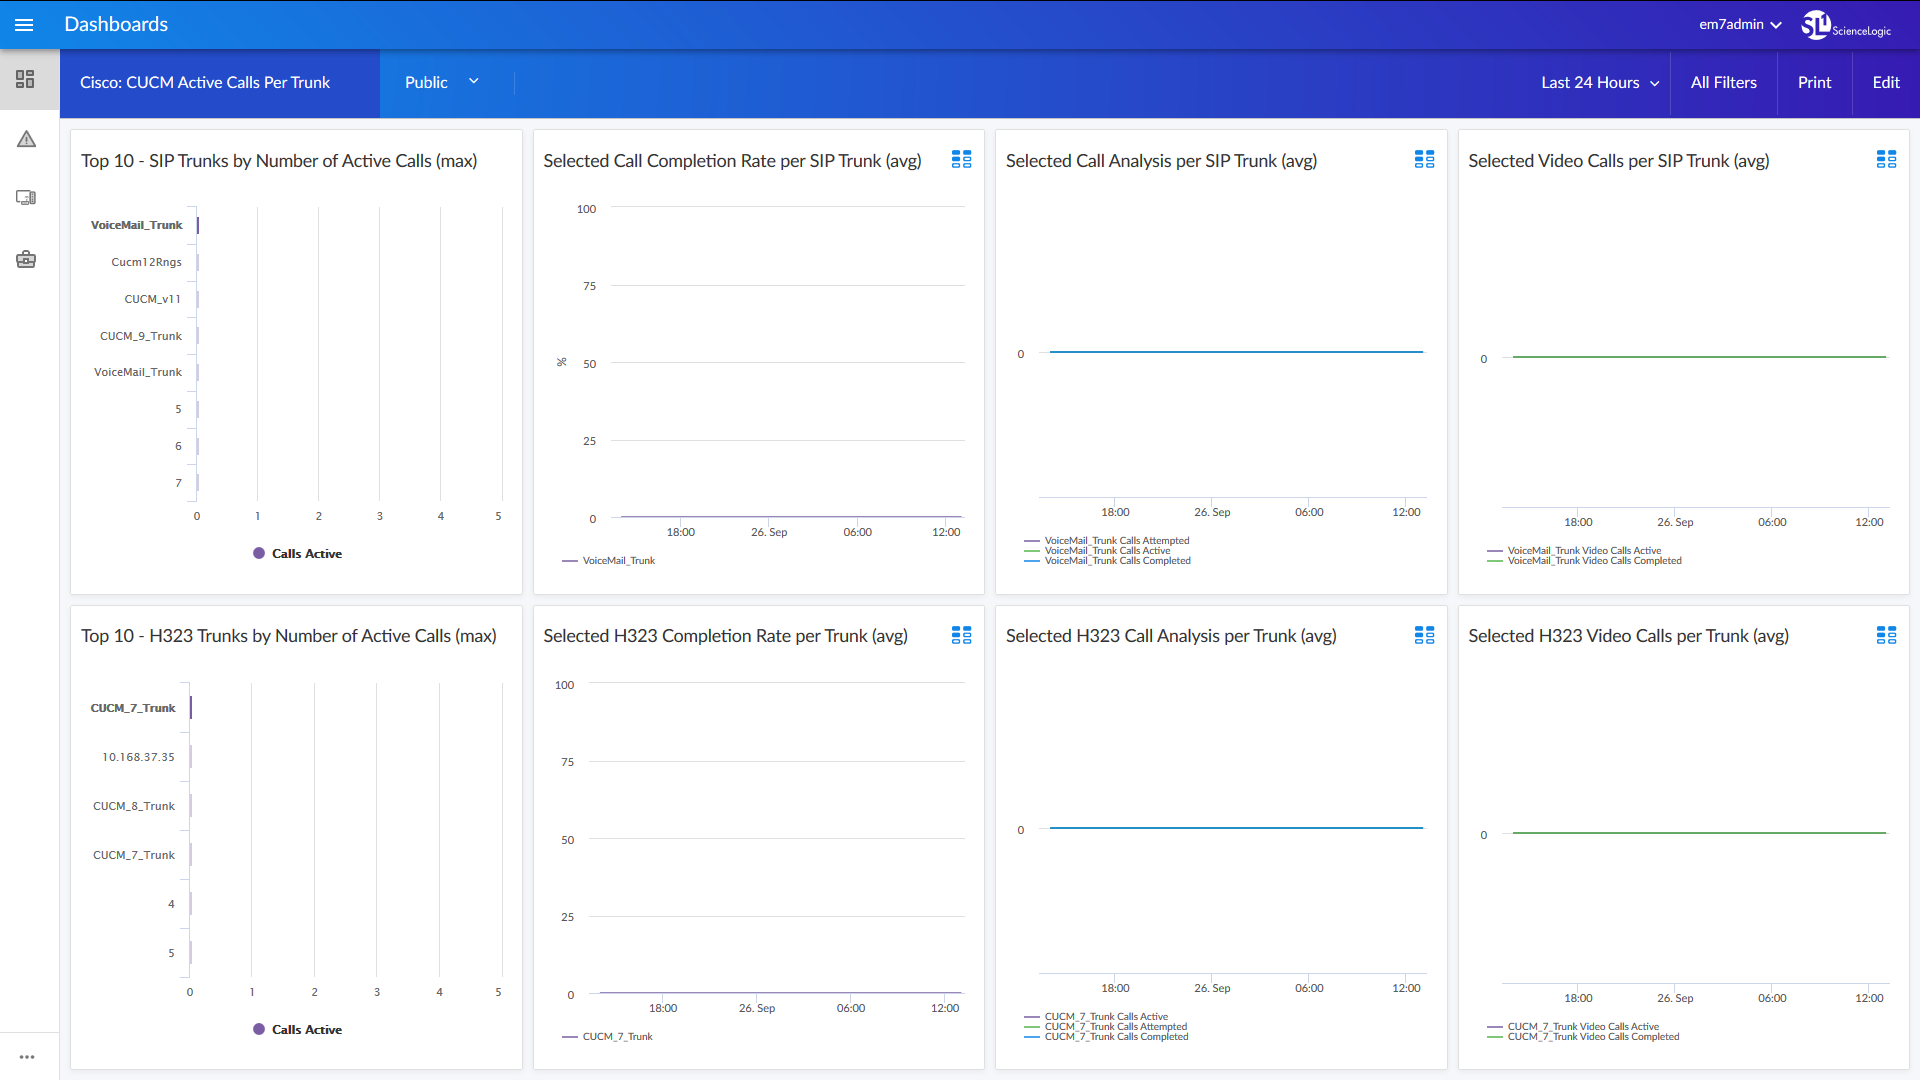
- A "Cisco: CUCM Active Calls Per Trunk" dashboard, which includes the following widgets that display data about your active CUCM calls, per trunk:
- Top 10 - SIP Trunks by Number of Active Calls (max)
- Selected Call Completion Rate per SIP Trunk (avg)
- Selected Call Analysis per SIP Trunk (avg)
- Selected Video Calls per SIP Trunk (avg)
- Top 10 - H323 Trunks by Number of Active Calls (max)
- Selected H323 Completion Rate per Trunk (avg)
- Selected H323 Call Analysis per Trunk (avg)
- Selected H323 Video Calls per Trunk (avg)
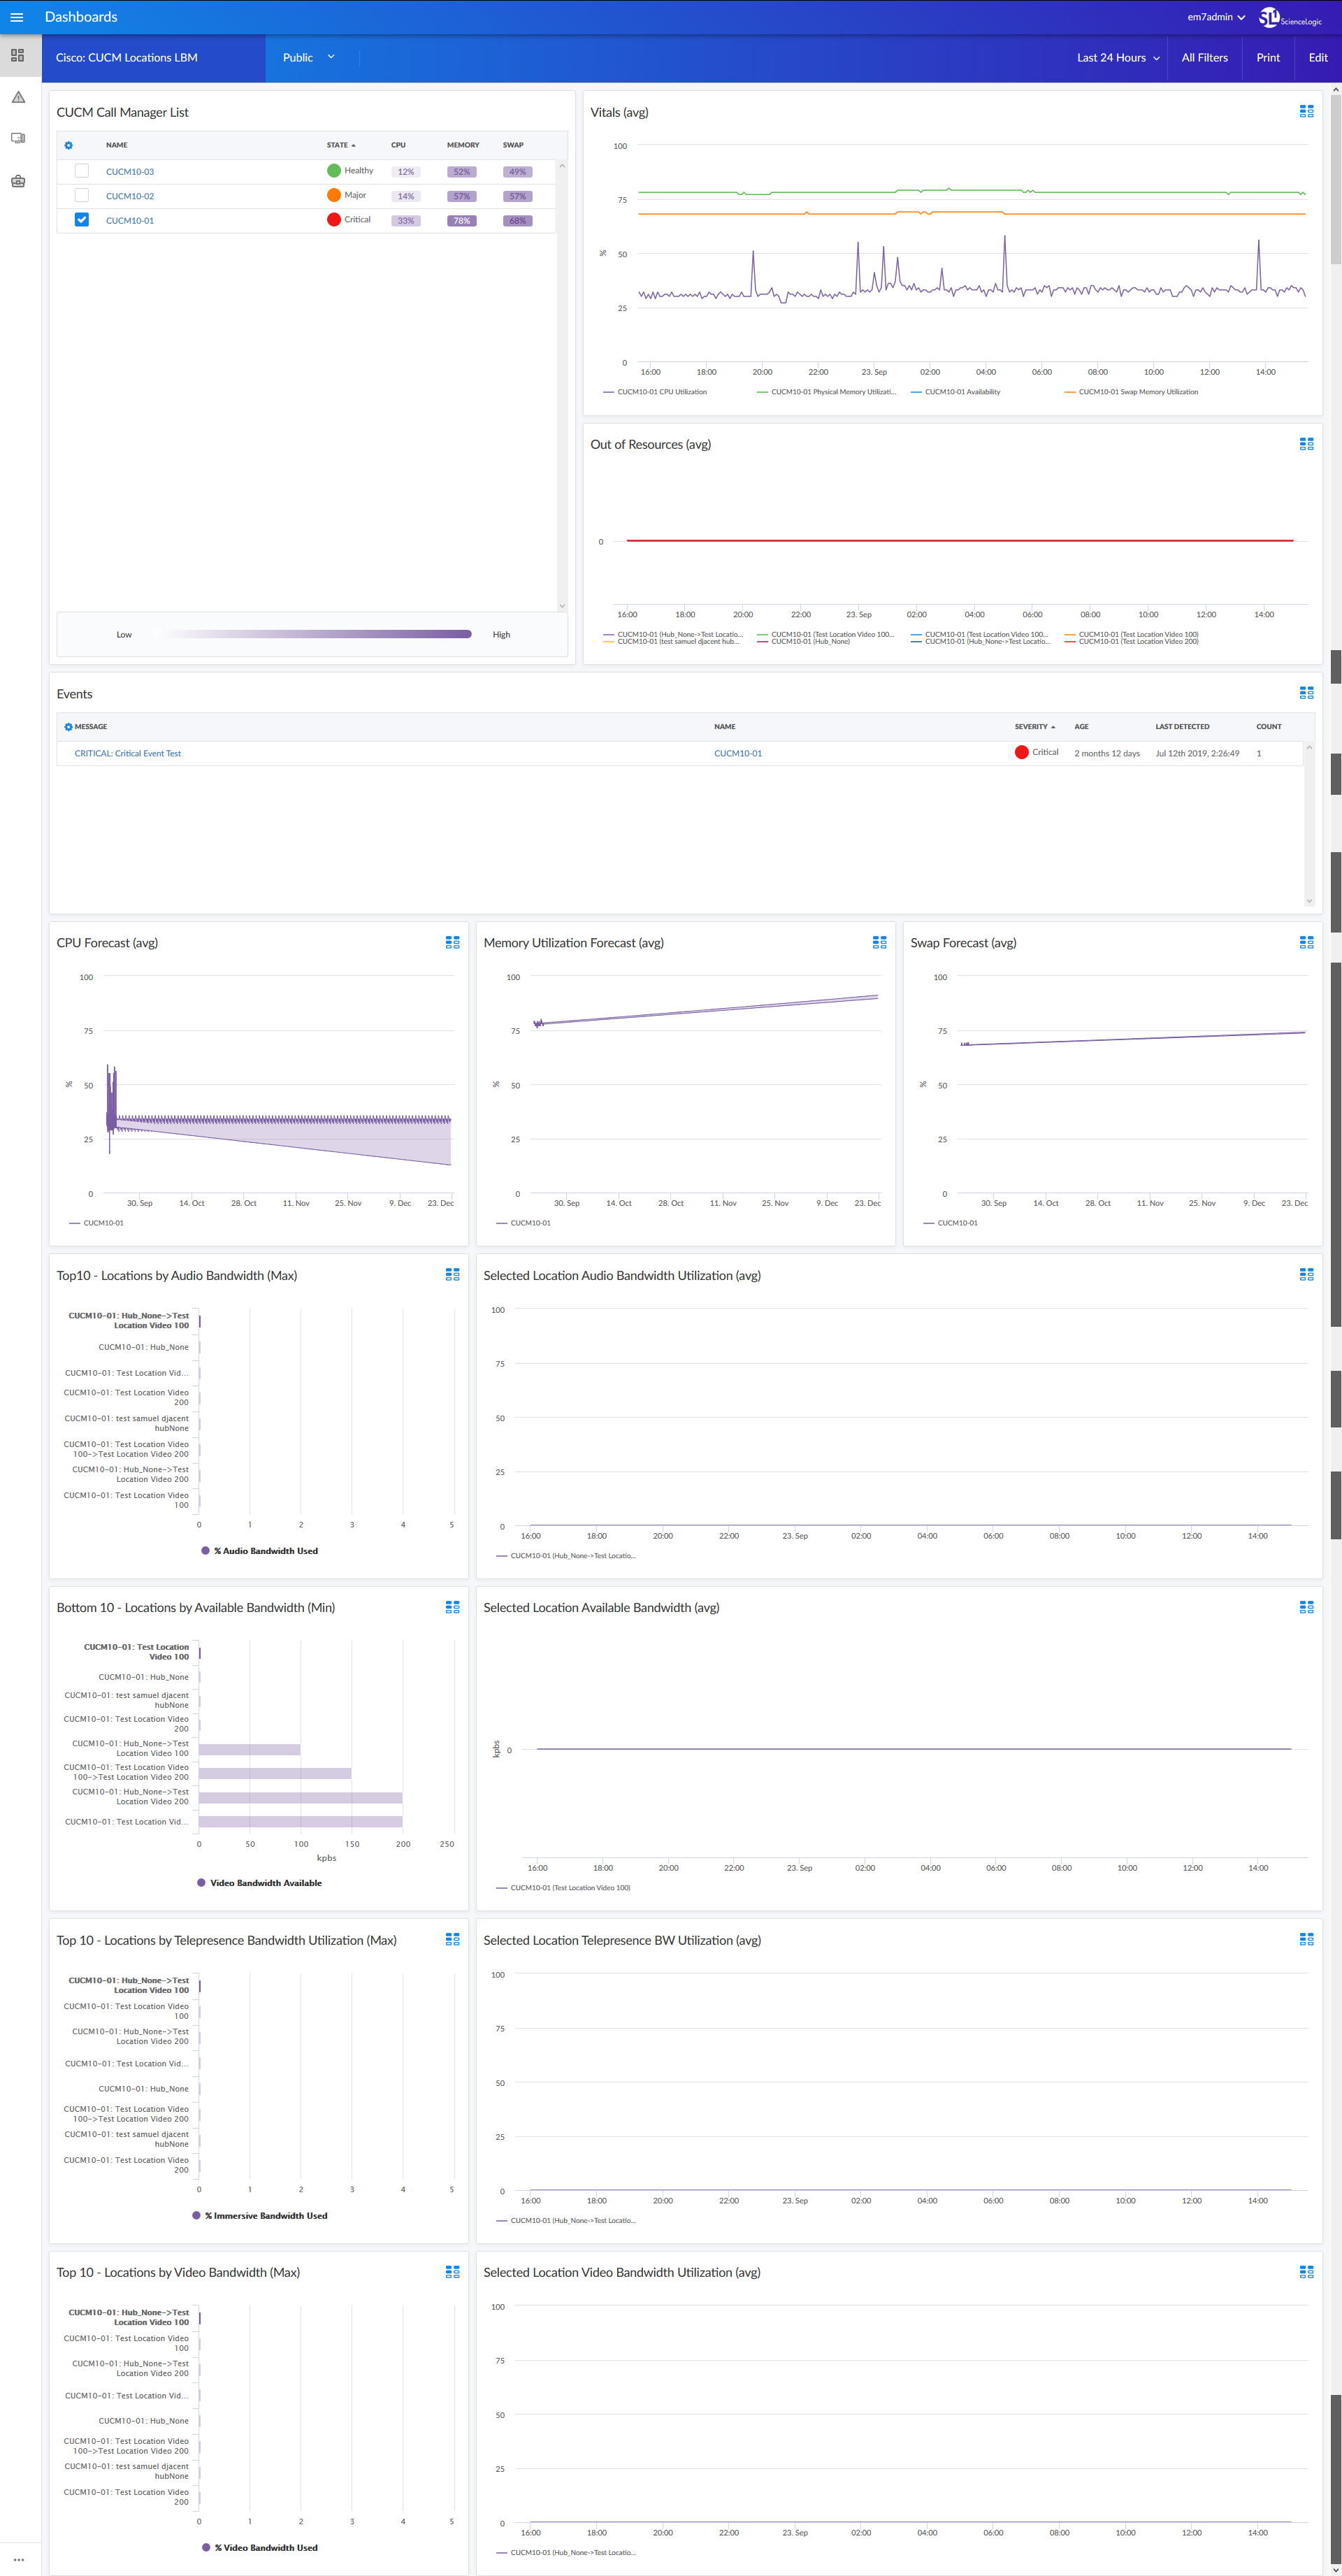
- A "Cisco: CUCM Locations LBM" dashboard, which includes the following widgets that display data about your CUCM Location Bandwidth Manager services:
- CUCM Call Manager List
- Vitals (avg)
- Out of Resources (avg)
- Events
- CPU Forecast (avg)
- Memory Utilization Forecast (avg)
- Swap Forecast (avg)
- Top 10 - Locations by Audio Bandwidth (Max)
- Selected Location Audio Bandwidth Utilization (avg)
- Bottom 10 - Locations by Available Bandwidth (Min)
- Selected Location Available Bandwidth (avg)
- Top 10 - Locations by Telepresence Bandwidth Utilization (Max)
- Selected Location Telepresence Bandwidth Utilization (avg)
- Top 10 - Locations by Video Bandwidth (Max)
- Selected Location Video Bandwidth Utilization (avg)
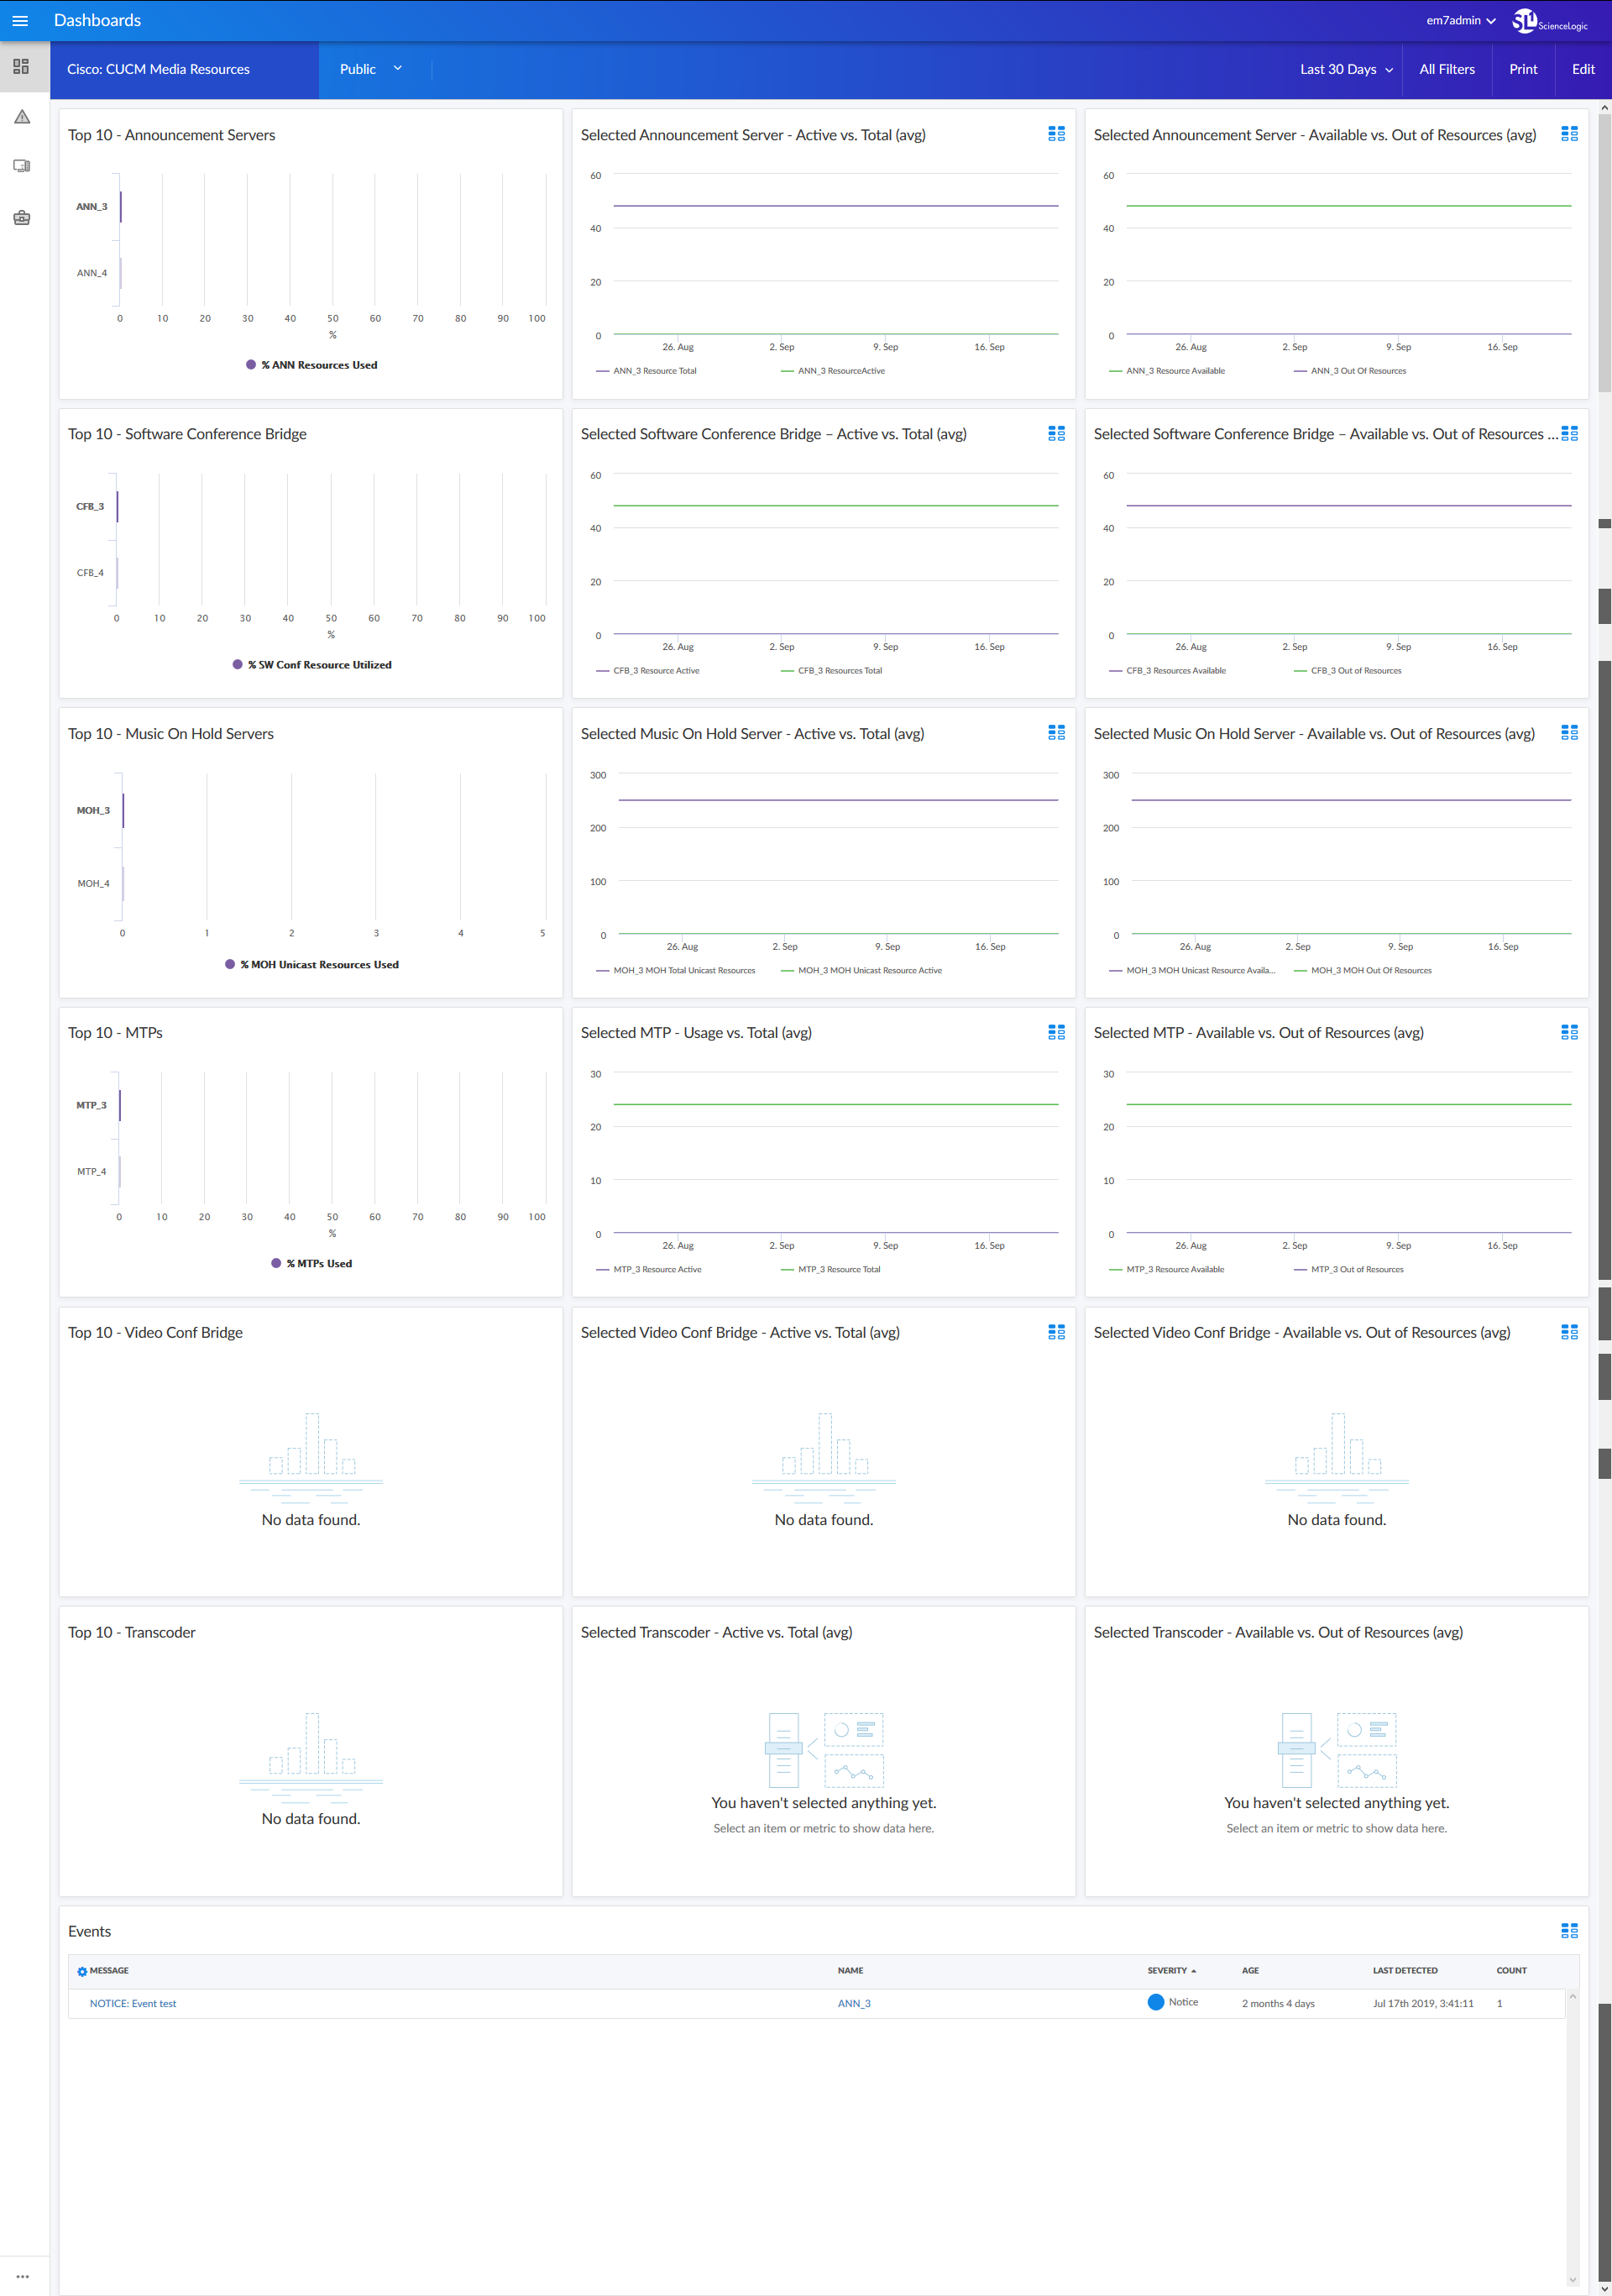
- A "Cisco: CUCM Media Resources" dashboard, which includes the following widgets that display data about your CUCM media resources:
- Top 10 - Announcement Servers
- Selected Announcement Server - Active vs. Total (avg)
- Selected Announcement Server - Available vs. Out of Resources (avg)
- Top 10 - Software Conference Bridges
- Selected Software Conference Bridges - Active vs. Total (avg)
- Selected Software Conference Bridges - Available vs. Out of Resources (avg)
- Top 10 - Music On Hold Servers
- Selected Music On Hold Servers - Active vs. Total (avg)
- Selected Music on Hold Servers - Available vs. Out of Resources (avg)
- Top 10 - MTPs
- Selected MTP - Usage vs. Total (avg)
- Selected MTP - Available vs. Out of Resources (avg)
- Top 10 - Video Conference Bridges
- Selected Video Conference Bridge - Active vs. Total (avg)
- Selected Video Conference Bridge - Available vs. Out of Resources (avg)
- Top 10 - Transcoder
- Selected Transcoder - Active vs. Total (avg)
- Selected Transcoder - Available vs. Out of Resources (avg)
- Events
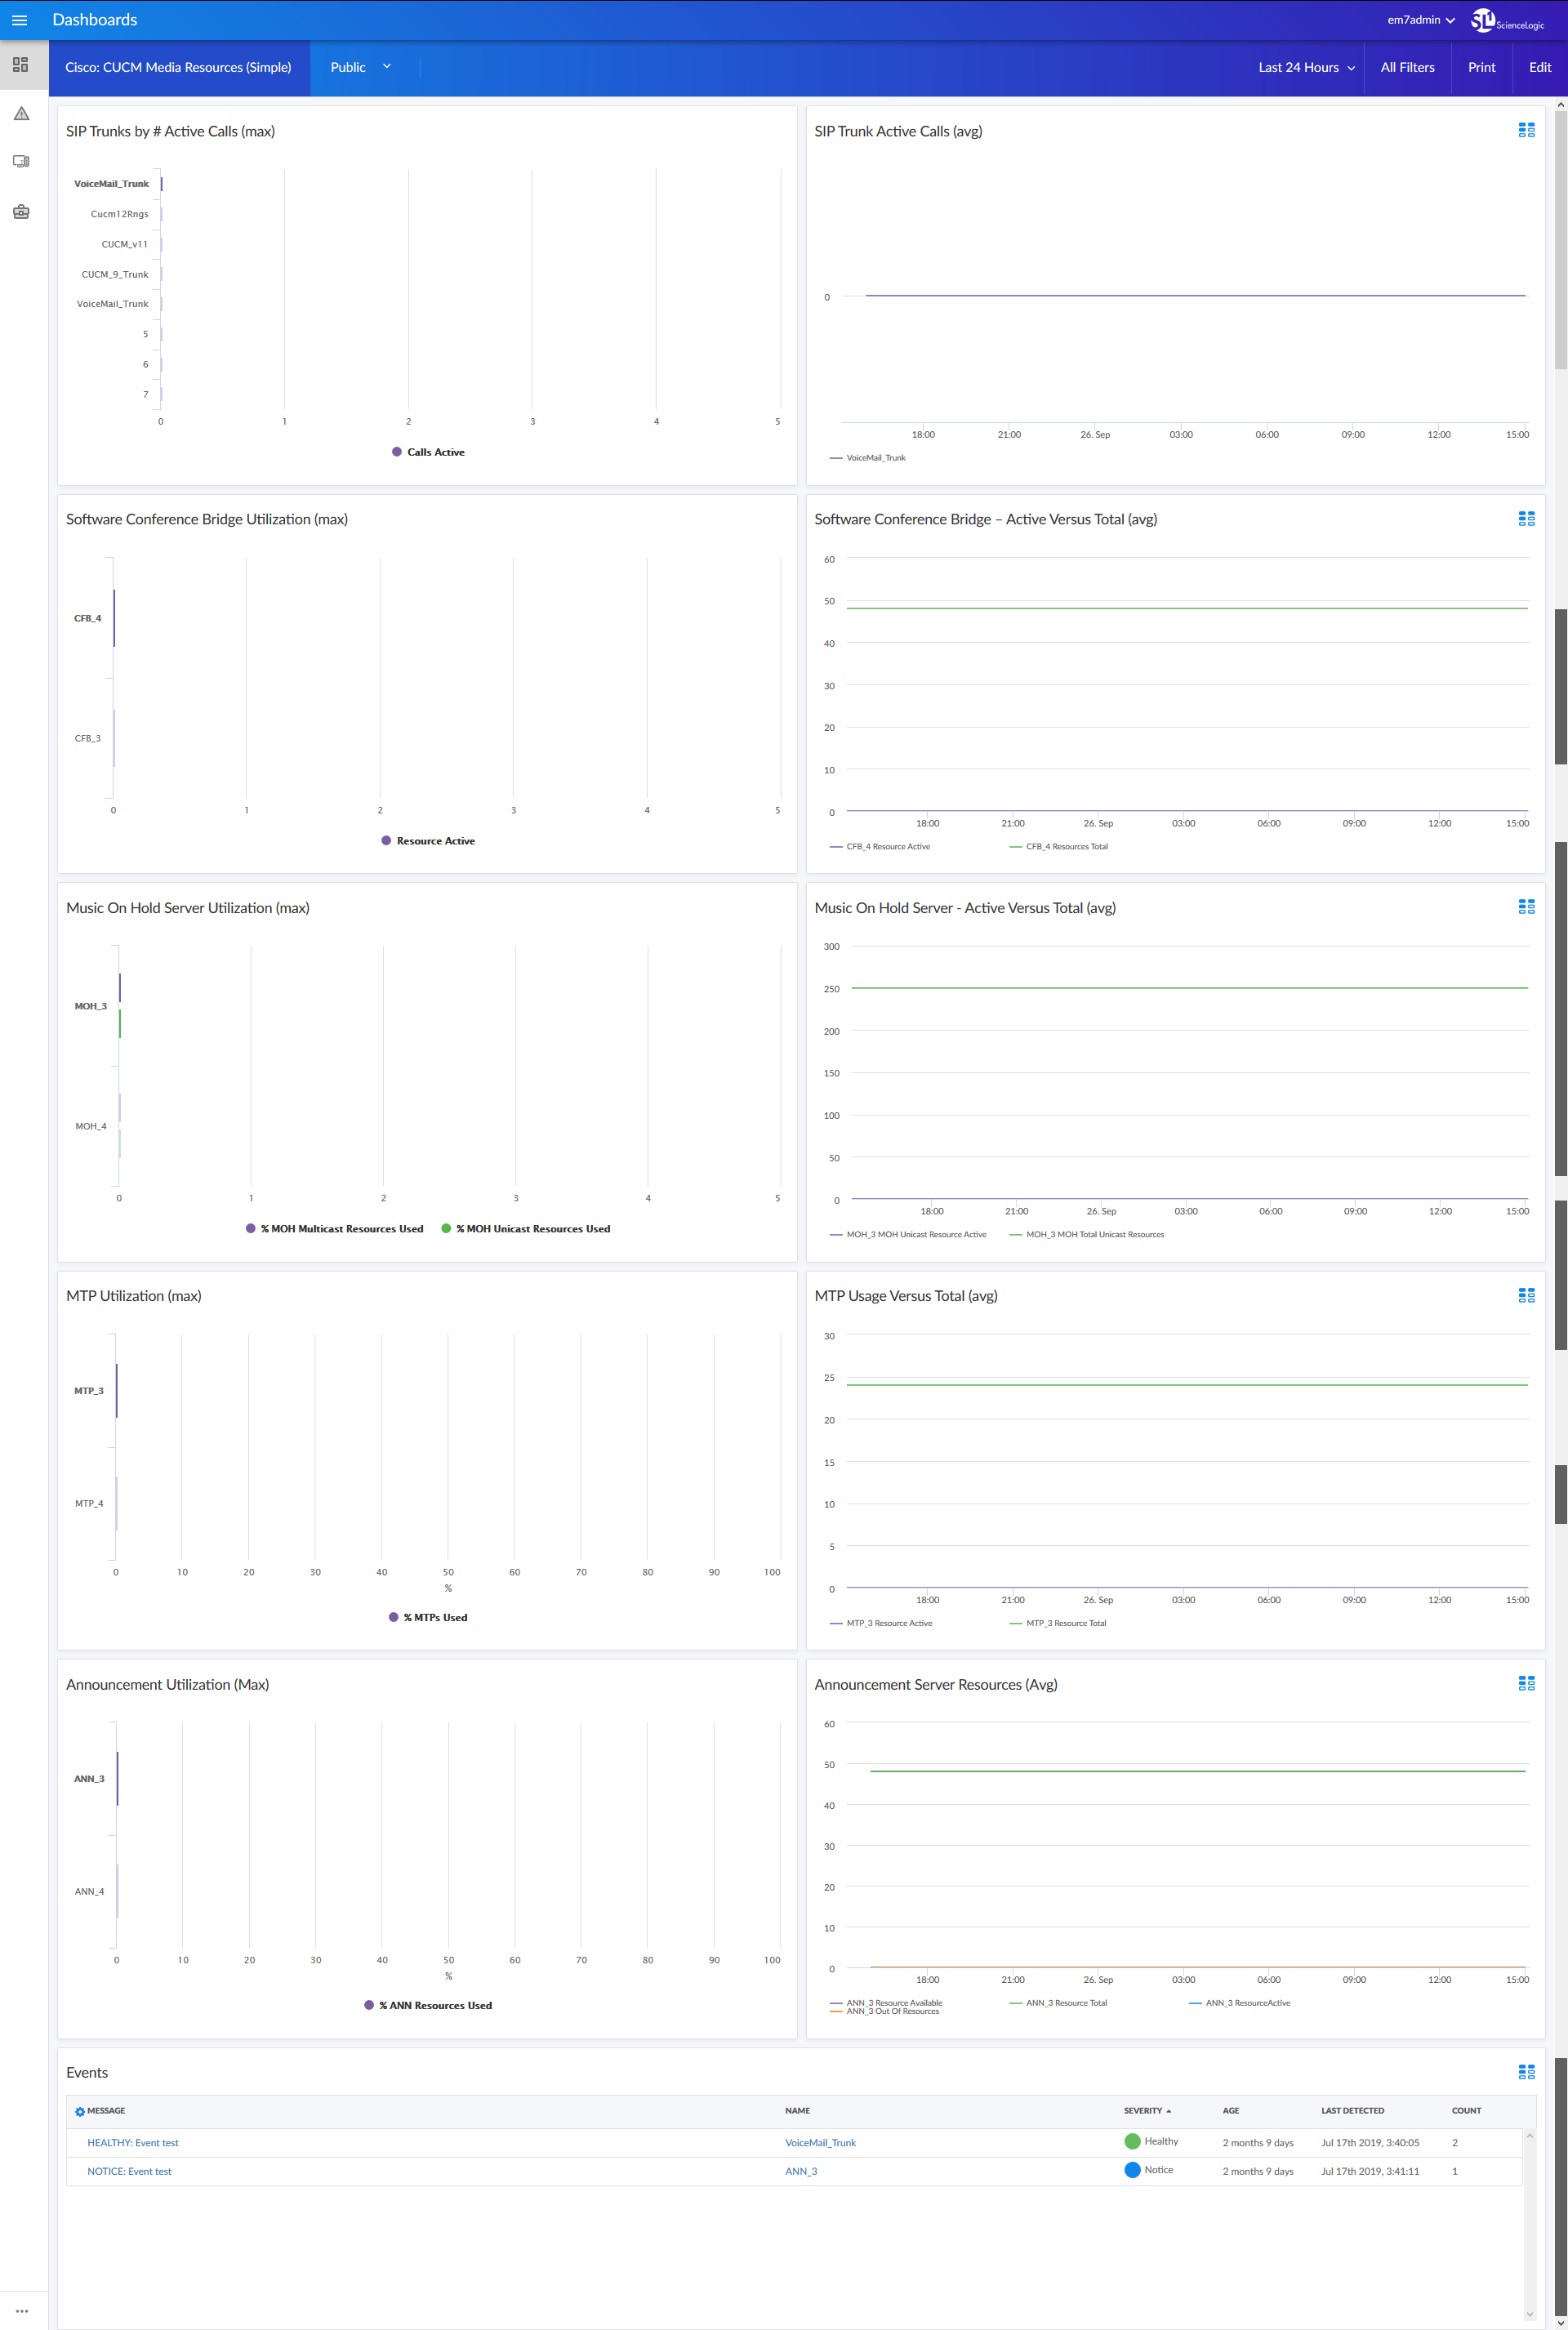
- A "Cisco: CUCM Media Resources (Simple)" dashboard, which includes the following widgets that display data about your CUCM media resources:
- SIP Trunks by Number of Active Calls (max)
- SIP Trunk Active Calls (avg)
- Software Conference Bridge Utilization (max)
- Software Conference Bridge - Active Versus Total (avg)
- Music On Hold Server Utilization (max)
- Music On Hold Servers - Active Versus Total (avg)
- MTP Utilization (max)
- MTP Usage Versus Total (avg)
- Announcement Utilization (max)
- Announcement Server Resources (avg)
- Events
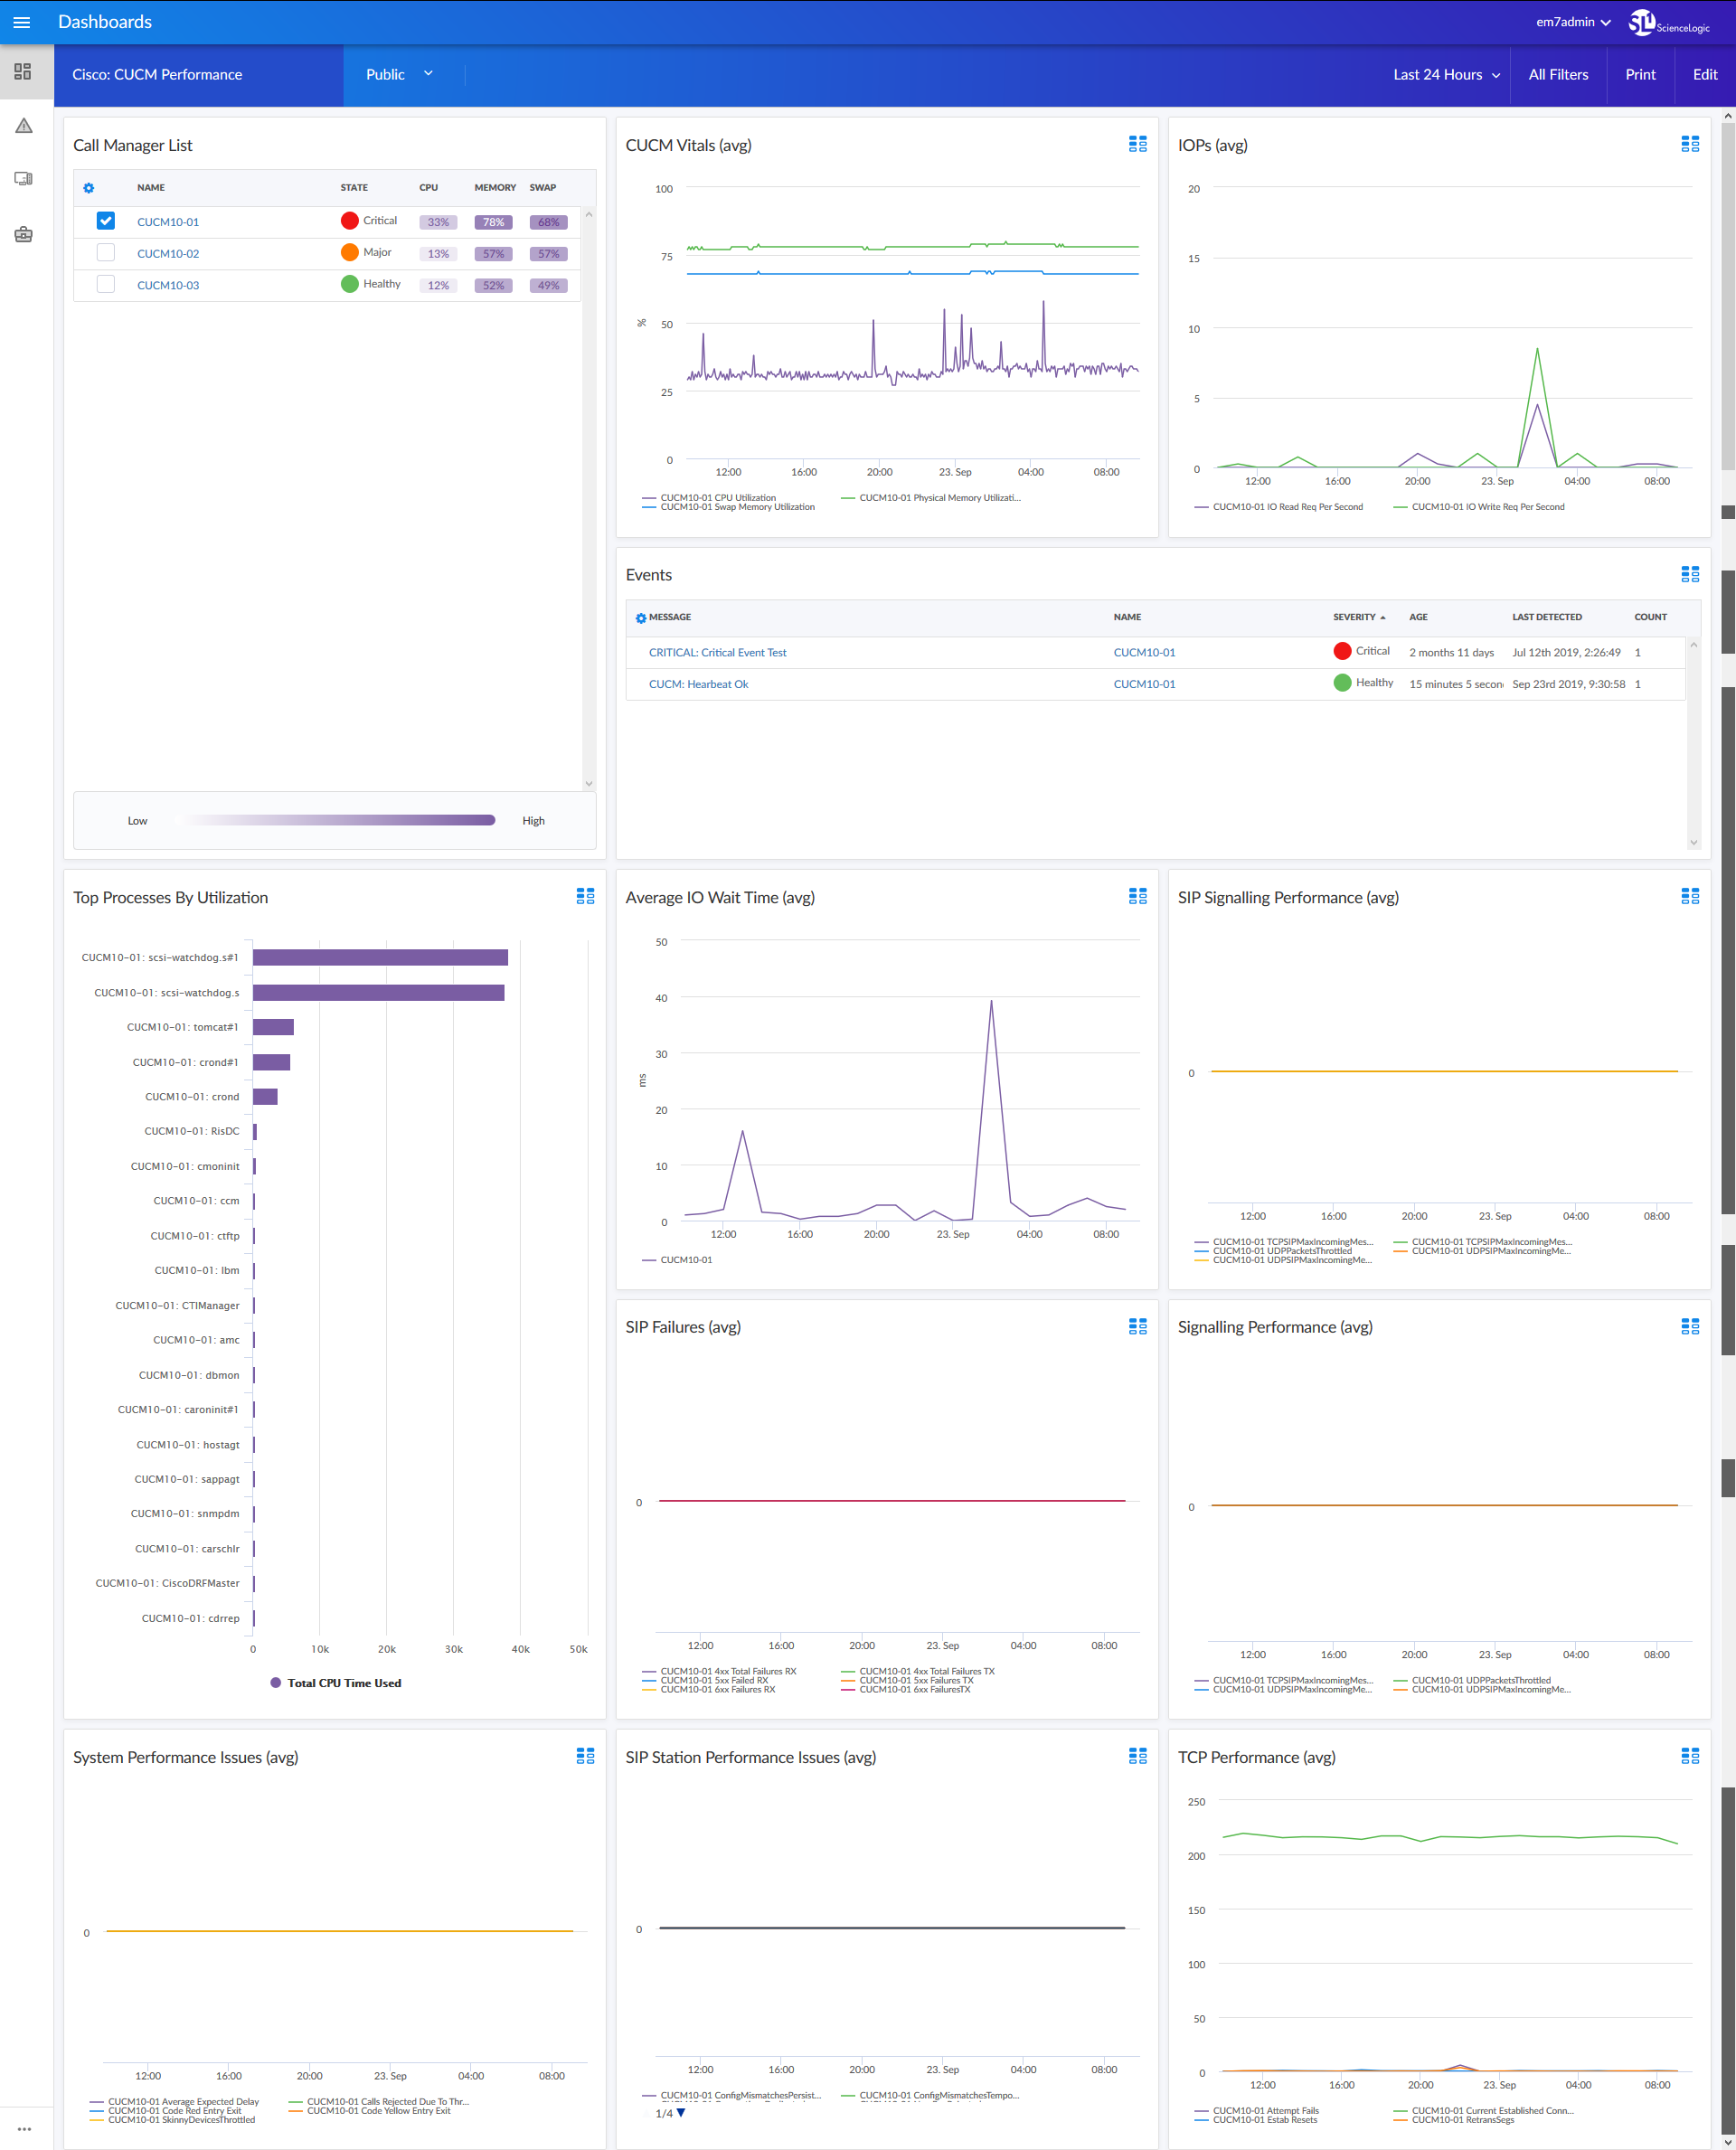
- A "Cisco: CUCM Performance" dashboard, which includes the following widgets that display data about your CUCM devices:
- Call Manager List
- CUCM Vitals (avg)
- Input/Output Per Second (avg)
- Events
- Top Processes by Utilization
- Average Input/Output Wait Time (avg)
- SIP Signaling Performance (avg)
- SIP Failures (avg)
- Signaling Performance (avg)
- System Performance Issues (avg)
- SIP Station Performance Issues (avg)
- TCP Performance (avg)
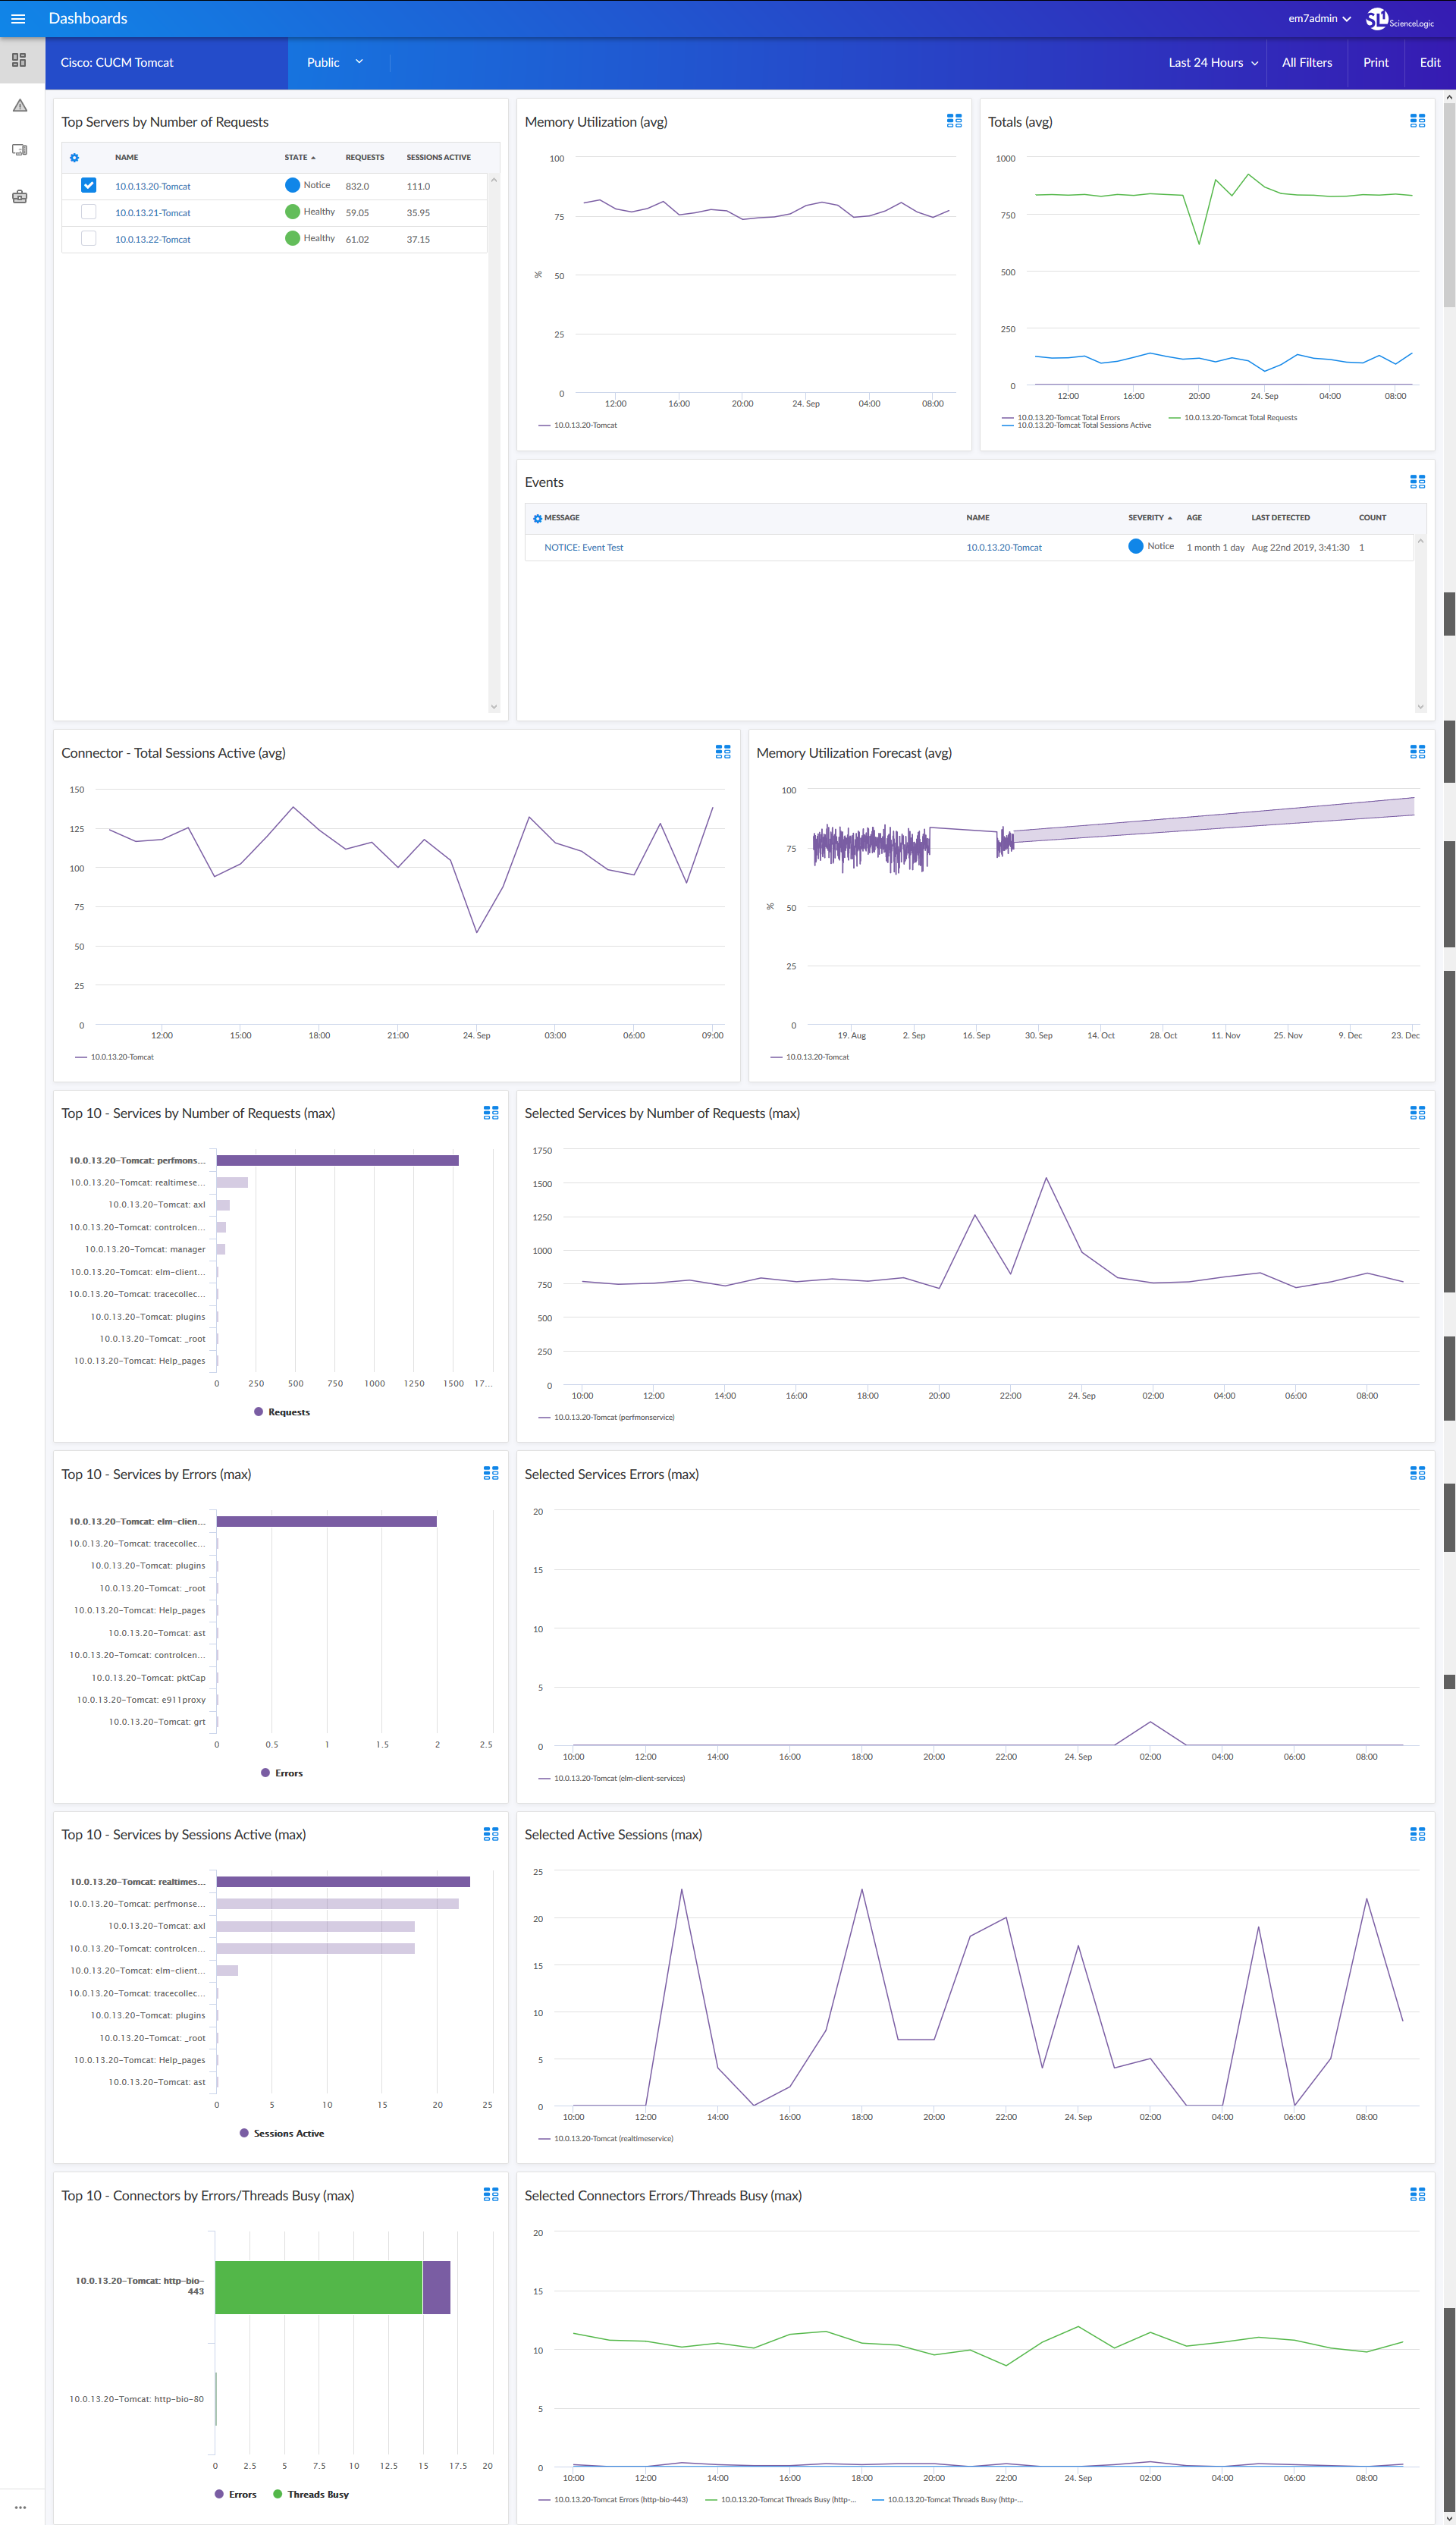
- A "Cisco: CUCM Tomcat" dashboard, which includes the following widgets that display data about your Cisco Tomcat services:
- Top Servers by Number of Requests
- Memory Utilization (avg)
- Totals (avg)
- Events
- Connector - Total Sessions Active (avg)
- Memory Utilization Forecast (avg)
- Top 10 - Services by Number of Requests (max)
- Selected Services by Number of Requests (max)
- Top 10 - Services by Errors (max)
- Selected Services Errors (max)
- Top 10 - Services by Sessions Active (max)
- Selected Active Sessions (max)
- Top 10 - Connectors by Errors/Threads Busy (max)
- Selected Connectors Errors/Threads Busy (max)
Enhancements and Issues Addressed
The following enhancements and addressed issues are included in version 102 of the Cisco CUCM: SL1 Dashboards PowerPack:
- Autoselect for context-driving widgets has been enabled in all dashboards.
- The Events and Selected Hunt Lists By Active Calls widgets were added to the "Cisco: CUCM Active Calls" dashboard.
- The Events, CPU Forecast, Memory Utilization Forecast, and Swap Forecast widgets were added to the "Cisco: CUCM Locations LBM" dashboard.
- The Events widget was added to the "Cisco: CUCM Media Resources" dashboard.
- In the "Cisco: CUCM Media Resources" dashboard, all driving widgets were changed to display the "Top 10" items.
- The Events widget was added to the "Cisco: CUCM Media Resources (Simple)" dashboard.
- The Events widget was added to the "Cisco: CUCM Performance" dashboard.
- The Events and Memory Utilization Forecast widgets were added to the "Cisco: CUCM Tomcat" dashboard.
- The Services by Sessions widget in the "Cisco: CUCM Tomcat" dashboard was updated to display the "Top 10" items.
Known Issues
Version 102 of the Cisco CUCM: SL1 Dashboards PowerPack has no known issues.