![]()
Version 102 of the Cisco ACI: SL1 Dashboards PowerPack includes autoselect for context-driving widgets and the addition of forecast widgets to some dashboards.
NOTE: These dashboards are intended for use only in the new SL1 user interface and will not load in the classic ScienceLogic platform user interface.
- Minimum Required SL1 Version: 8.12.1
- Minimum Required AP2 Version: 5.125.44
- Minimum Required Widget Components Version: 2.174.3
- Minimum Required Cisco: ACI PowerPack Version: 106
Before You Install or Upgrade
Before installing Cisco ACI: SL1 Dashboards PowerPack version 102, you must first ensure that you are running version 8.12.1 or later of SL1.
NOTE: For details on upgrading SL1, see the appropriate Release Notes.
You must also import and install the Cisco: ACI PowerPack version 106 or later before installing the PowerPack.
Installation or Upgrade Process
To install this PowerPack:
- Familiarize yourself with the Known Issues for this release.
- See the Before You Install or Upgrade section. If you have not done so already, upgrade your system to the 8.12.1 or later release.
- Download the "Cisco ACI: SL1 Dashboards" version 102PowerPack from the Support Site to a local computer.
- Go to the PowerPack Manager page (System > Manage > PowerPacks). Click the menu and choose Import PowerPack. When prompted, import "Cisco ACI: SL1 Dashboards" version 102.
- Click the button. For details on installing PowerPacks, see the chapter on Installing a PowerPack in the PowerPacks manual.
Features
The following dashboards are included in version 102 of the Cisco ACI: SL1 Dashboards PowerPack:
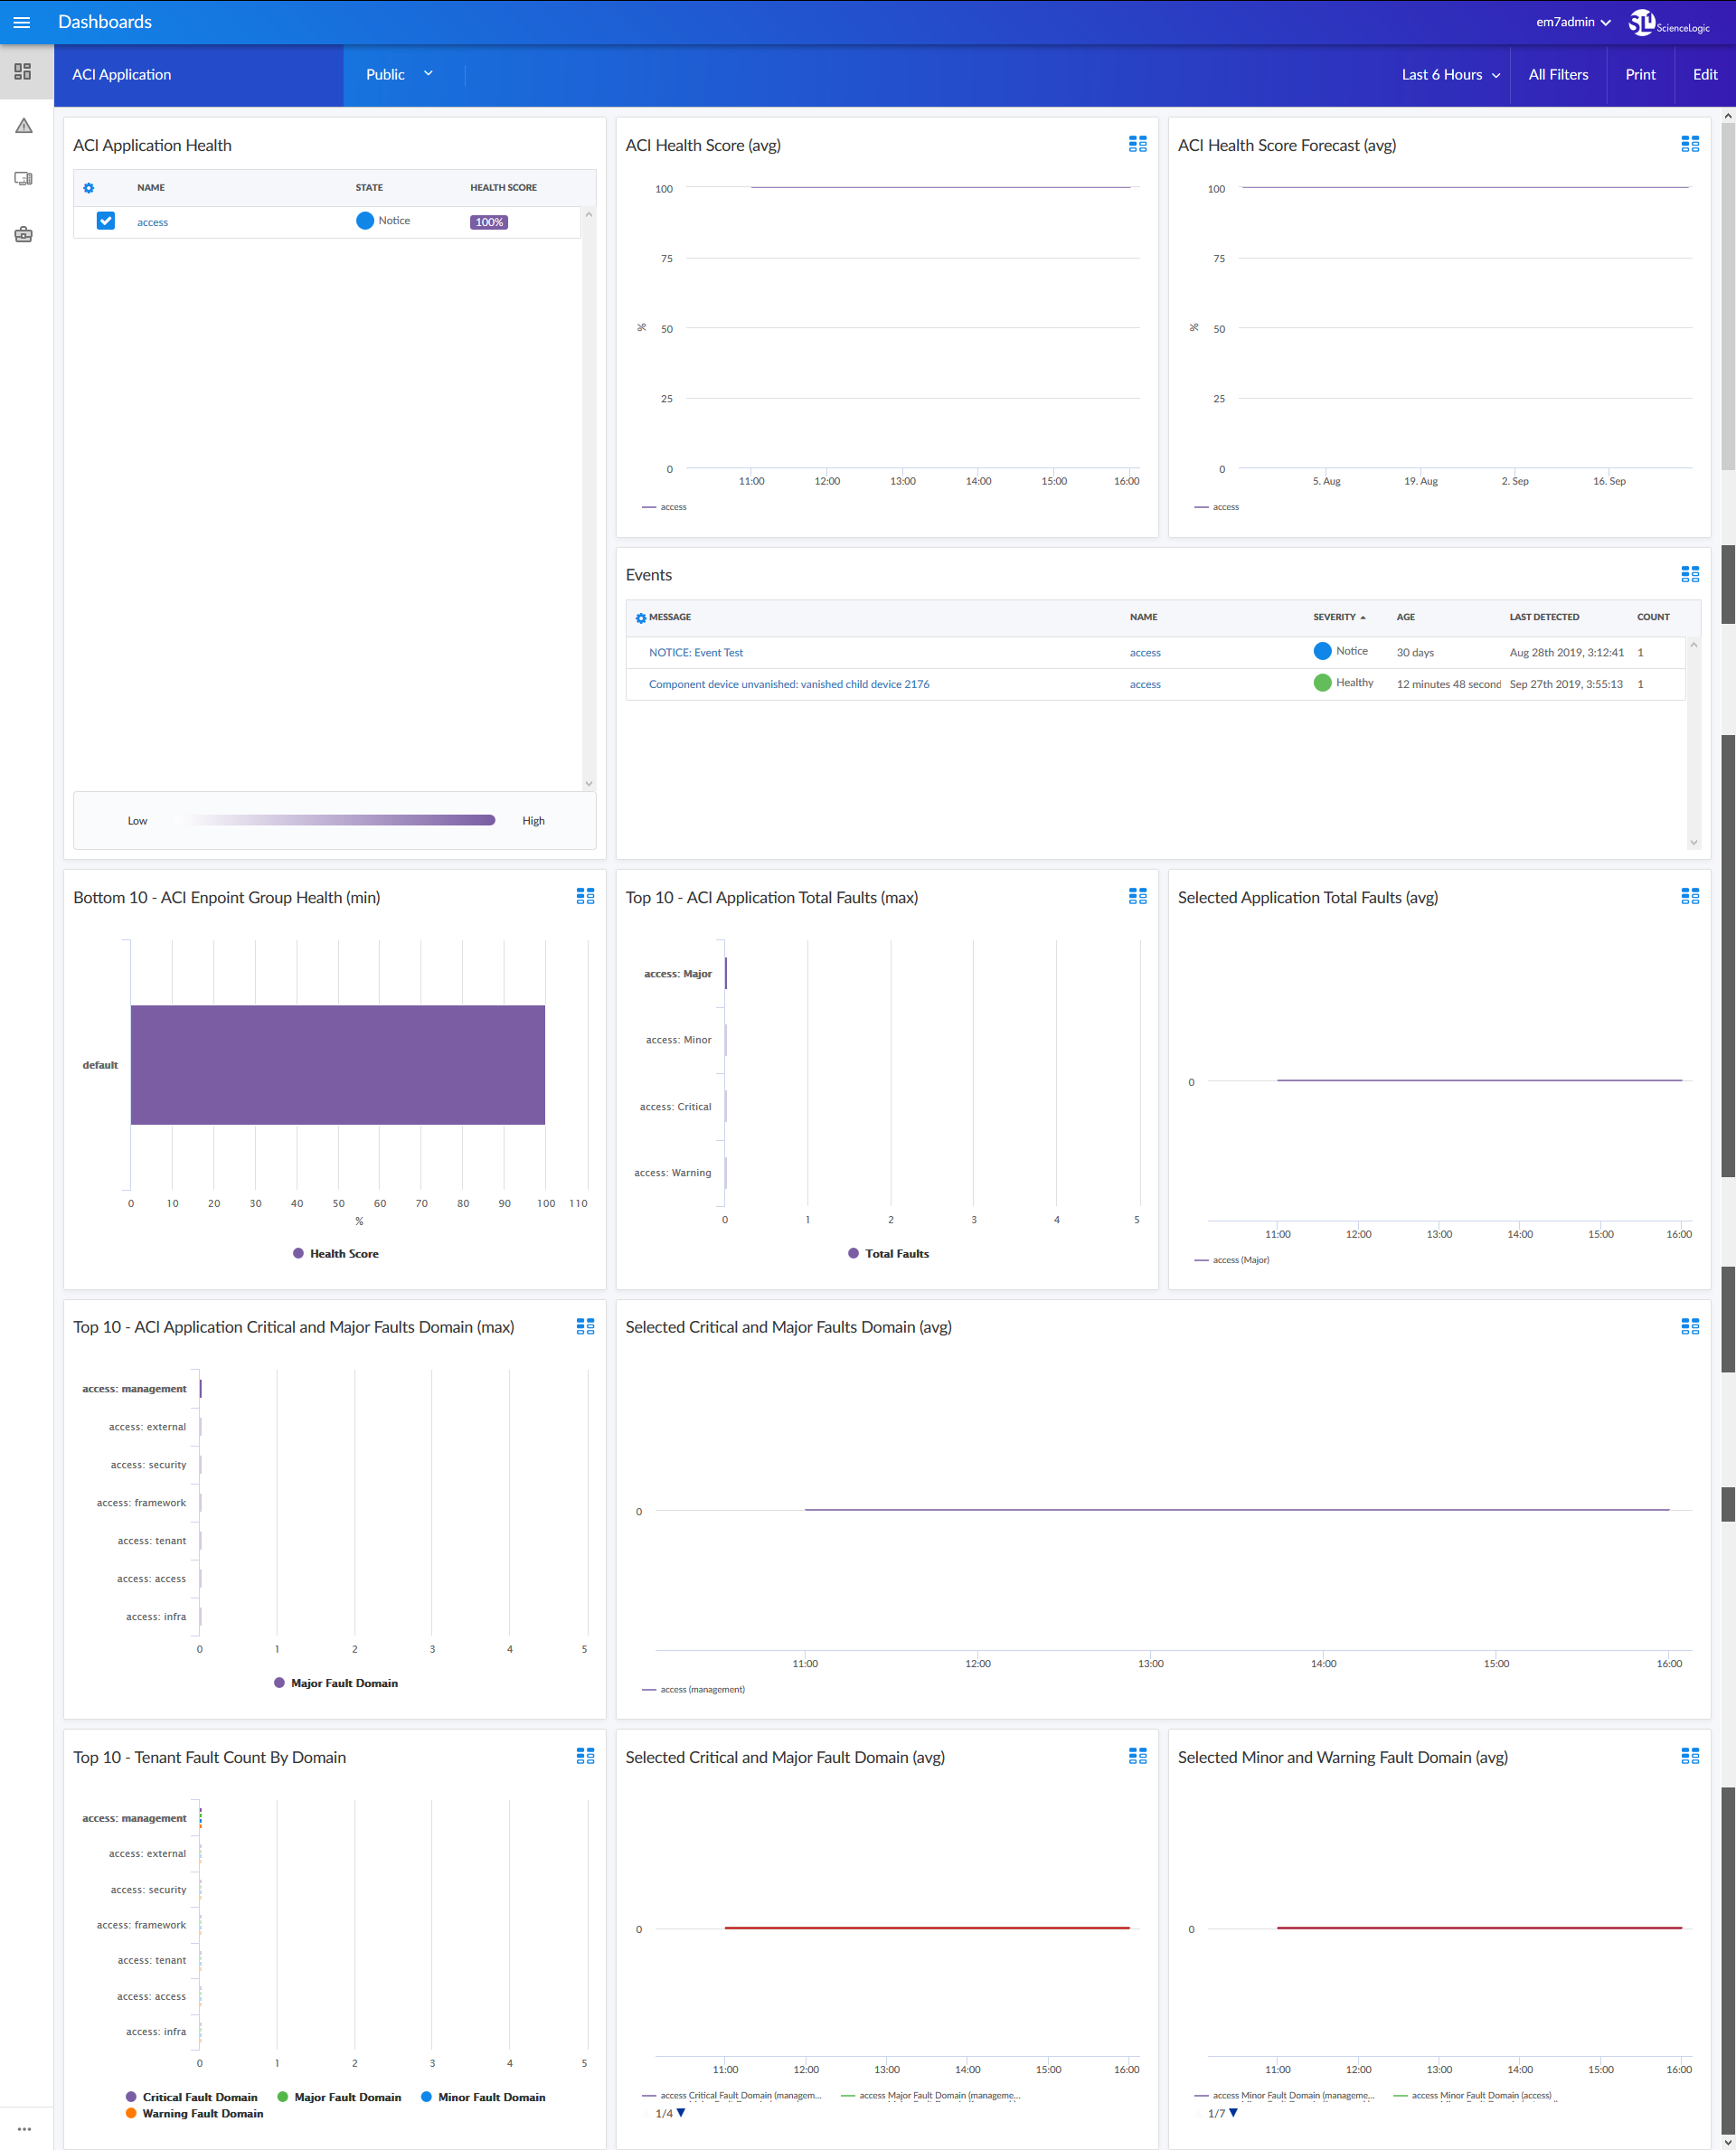
- An "ACI Application" dashboard, which includes the following widgets that display overview data about your ACI applications:
- ACI Application Health
- ACI Health Score (avg)
- ACI Health Score Forecast (avg)
- Events
- Bottom 10 - ACI Endpoint Group Health (min)
- Top 10 - ACI Application Total Faults (max)
- Selected Application Total Faults (avg)
- Top 10 - ACI Application Critical and Major Faults Domain (max)
- Selected Critical and Major Faults Domain (avg)
- Top 10 - Tenant Fault count by Domain
- Selected Critical and Major Fault Domain (avg)
- Selected Minor and Warning Fault Domain (avg)
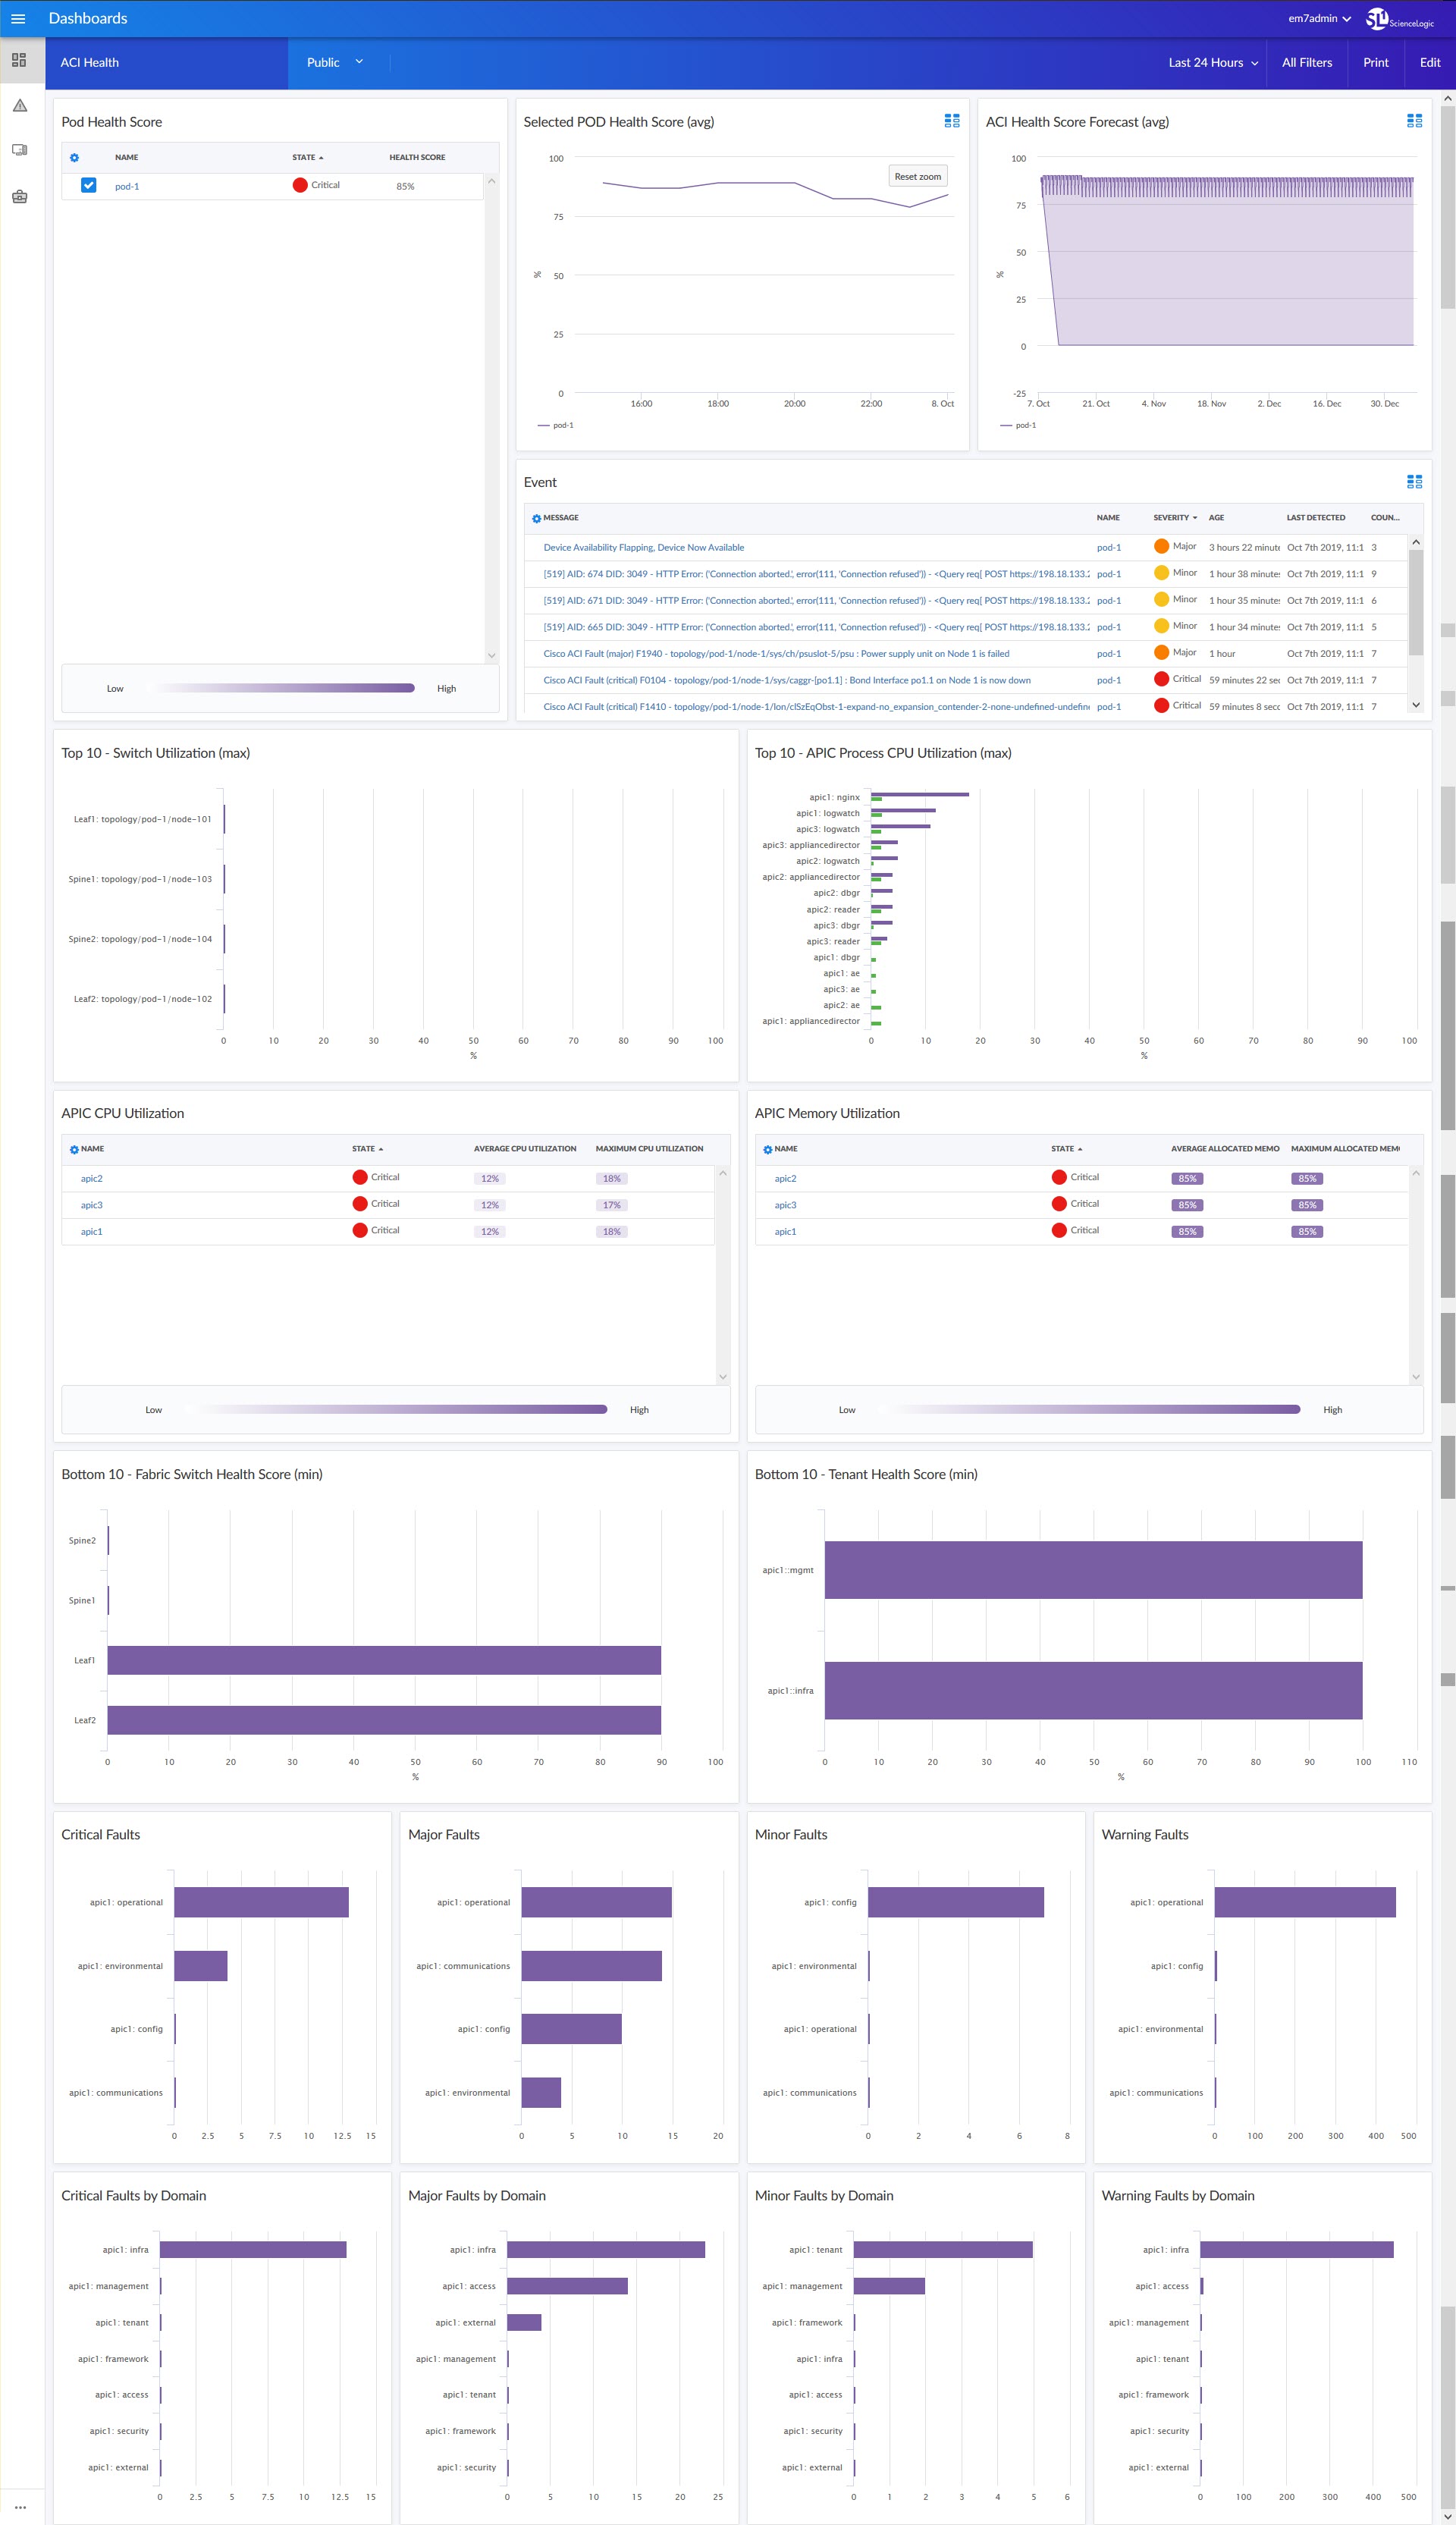
- An "ACI Health" dashboard, which includes the following widgets that display data about your ACI devices:
- Pod Health Score
- Selected Pod Health Score (avg)
- ACI Health Score Forecast (avg)
- Events
- Top 10 - APIC Process CPU Utilization (max)
- Top 10 - Switch Utilization (max)
- APIC CPU Utilization
- APIC Memory Utilization
- Bottom 10 - Fabric Switch Health Score (min)
- Bottom 10 - Tenant Health Score (min)
- Critical Faults
- Major Faults
- Minor Faults
- Warning Faults
- Critical Faults by Domain
- Major Faults by Domain
- Minor Faults by Domain
- Warning Faults by Domain
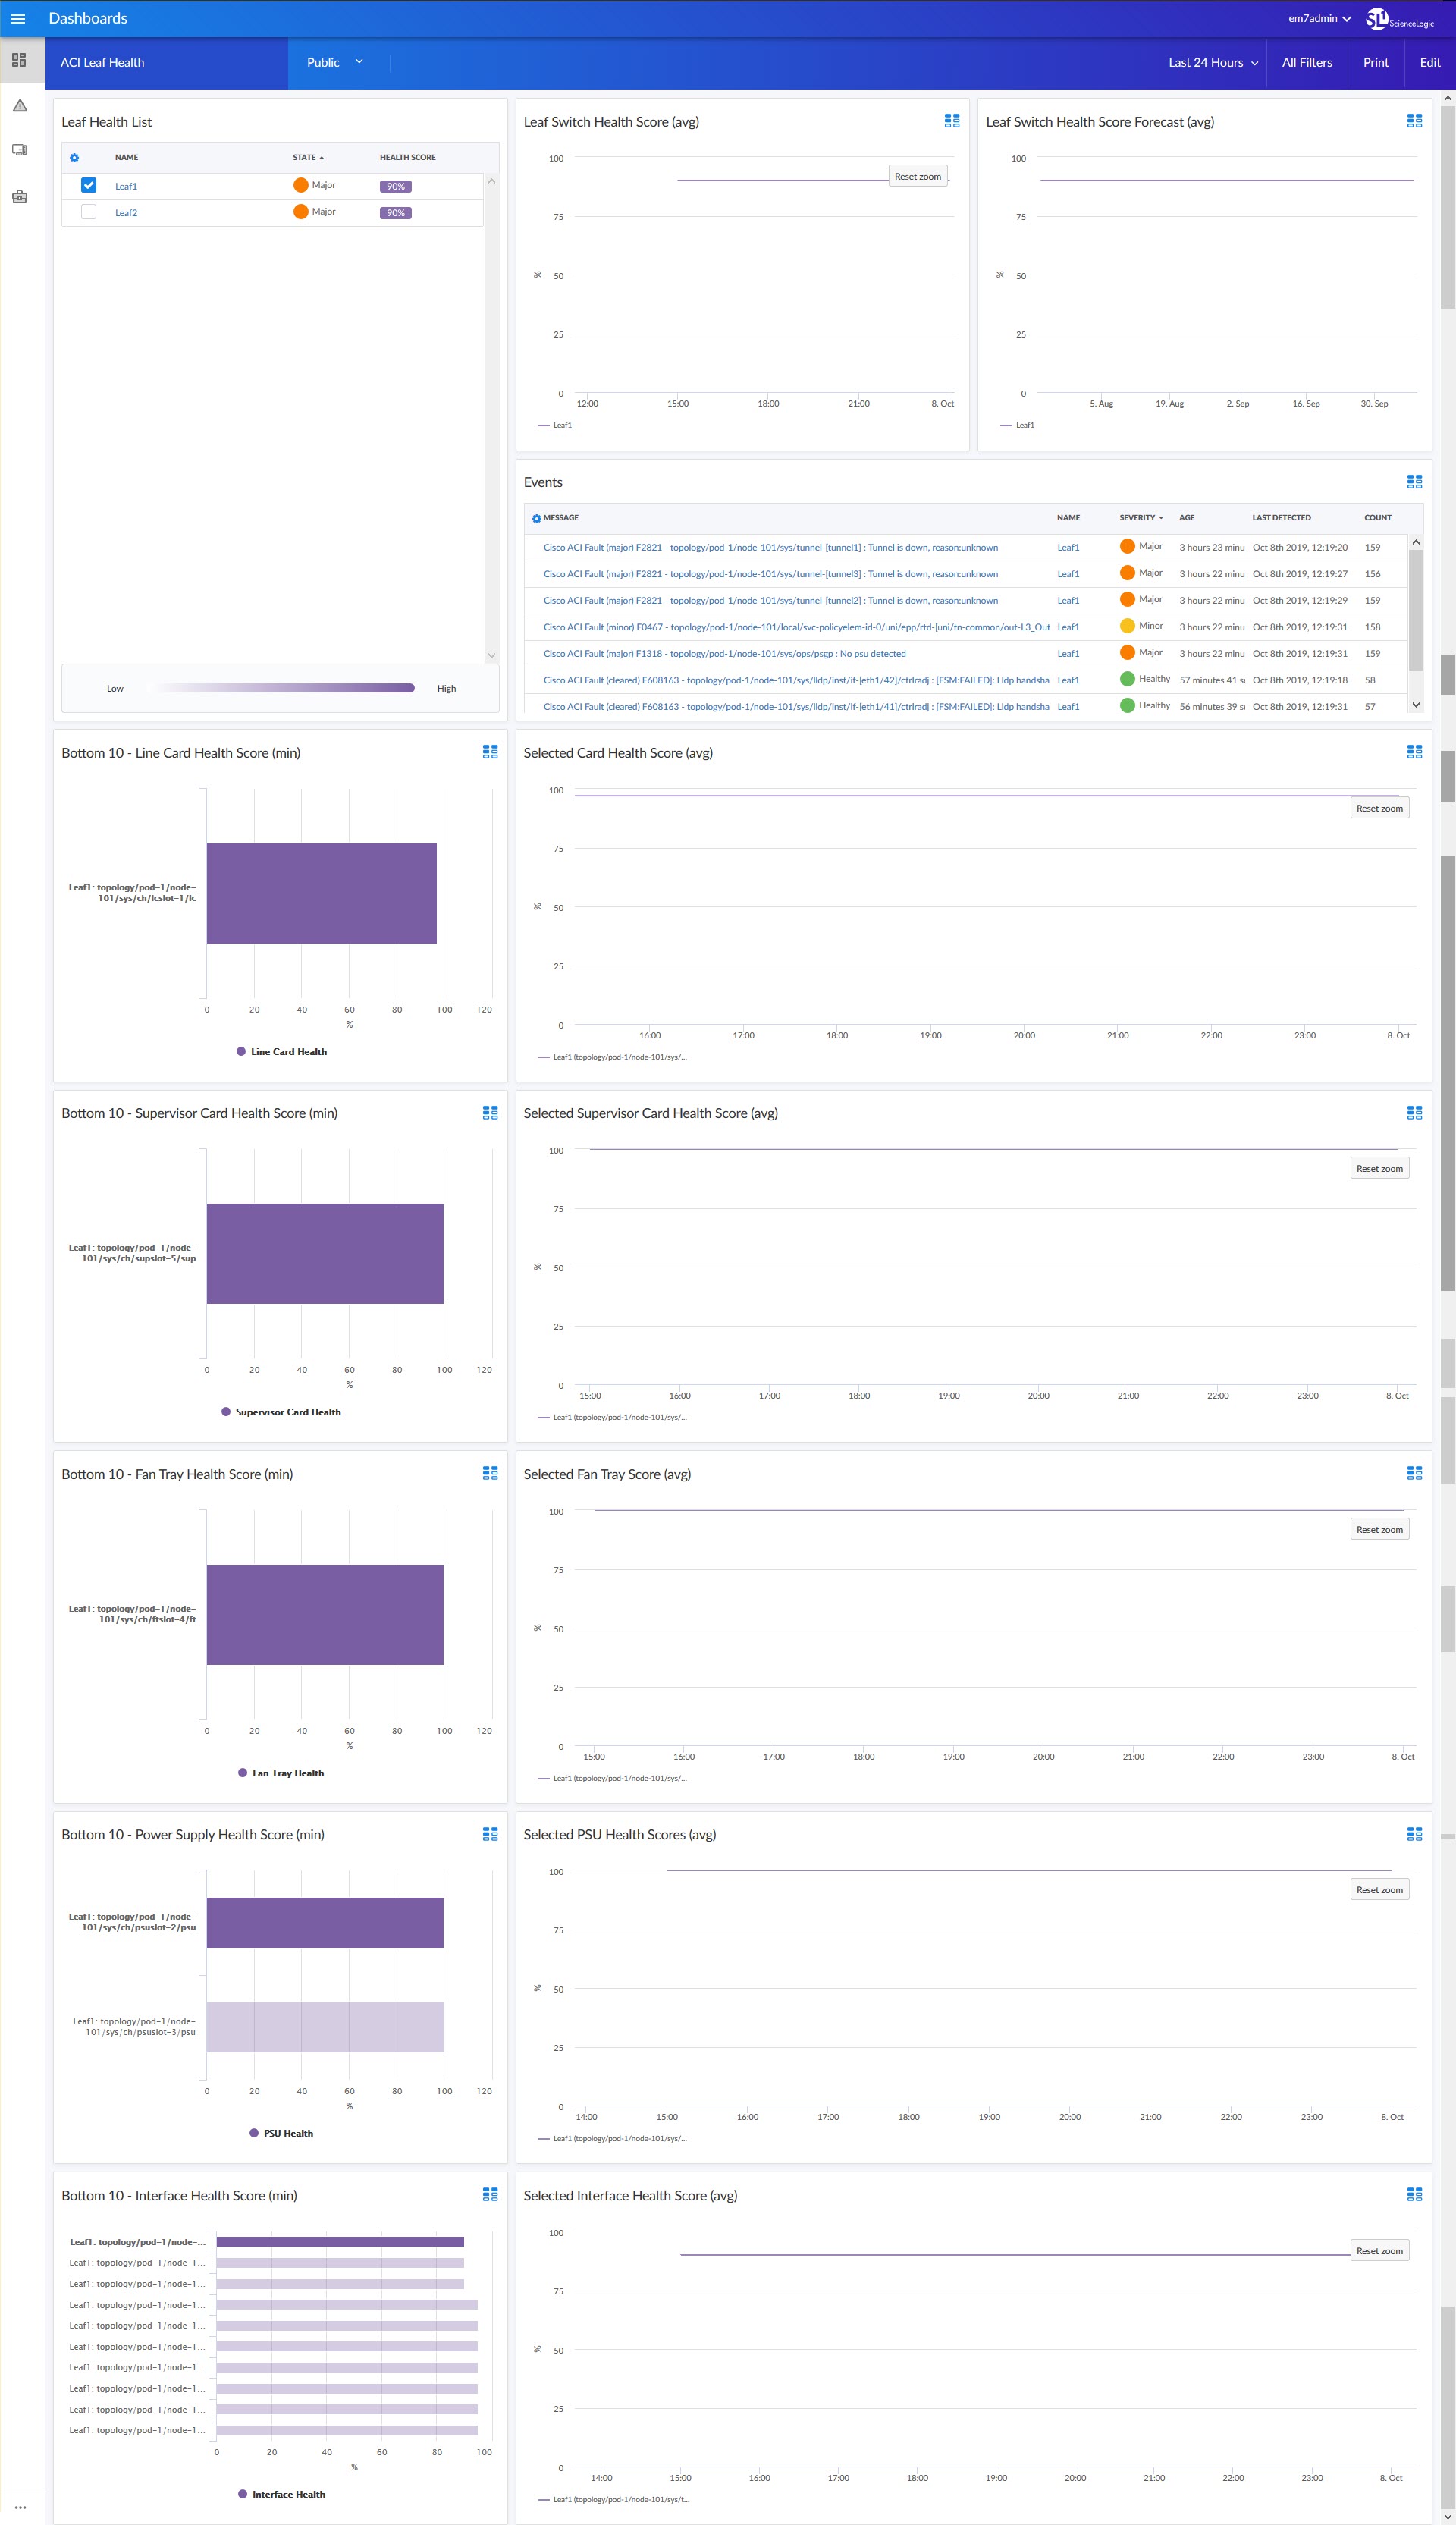
- An "ACI Leaf Health" dashboard, which includes the following widgets that display data about your ACI leafs:
- Leaf Health List
- Leaf Switch Health Score (avg)
- Leaf Switch Health Score Forecast (avg)
- Events
- Bottom 10 - Line Card Health Score (min)
- Selected Card Health Score (avg)
- Bottom 10 - Supervisor Card Health Score (min)
- Selected Supervisor Card Health Score (avg)
- Bottom 10 - Fan Tray Health Score (min)
- Selected Fan Tray Score (avg)
- Bottom 10 - Power Supply Health Score (min)
- Selected PSU Health Score (avg)
- Bottom 10 - Interface Health Score (min)
- Selected Interface Health Score (avg)
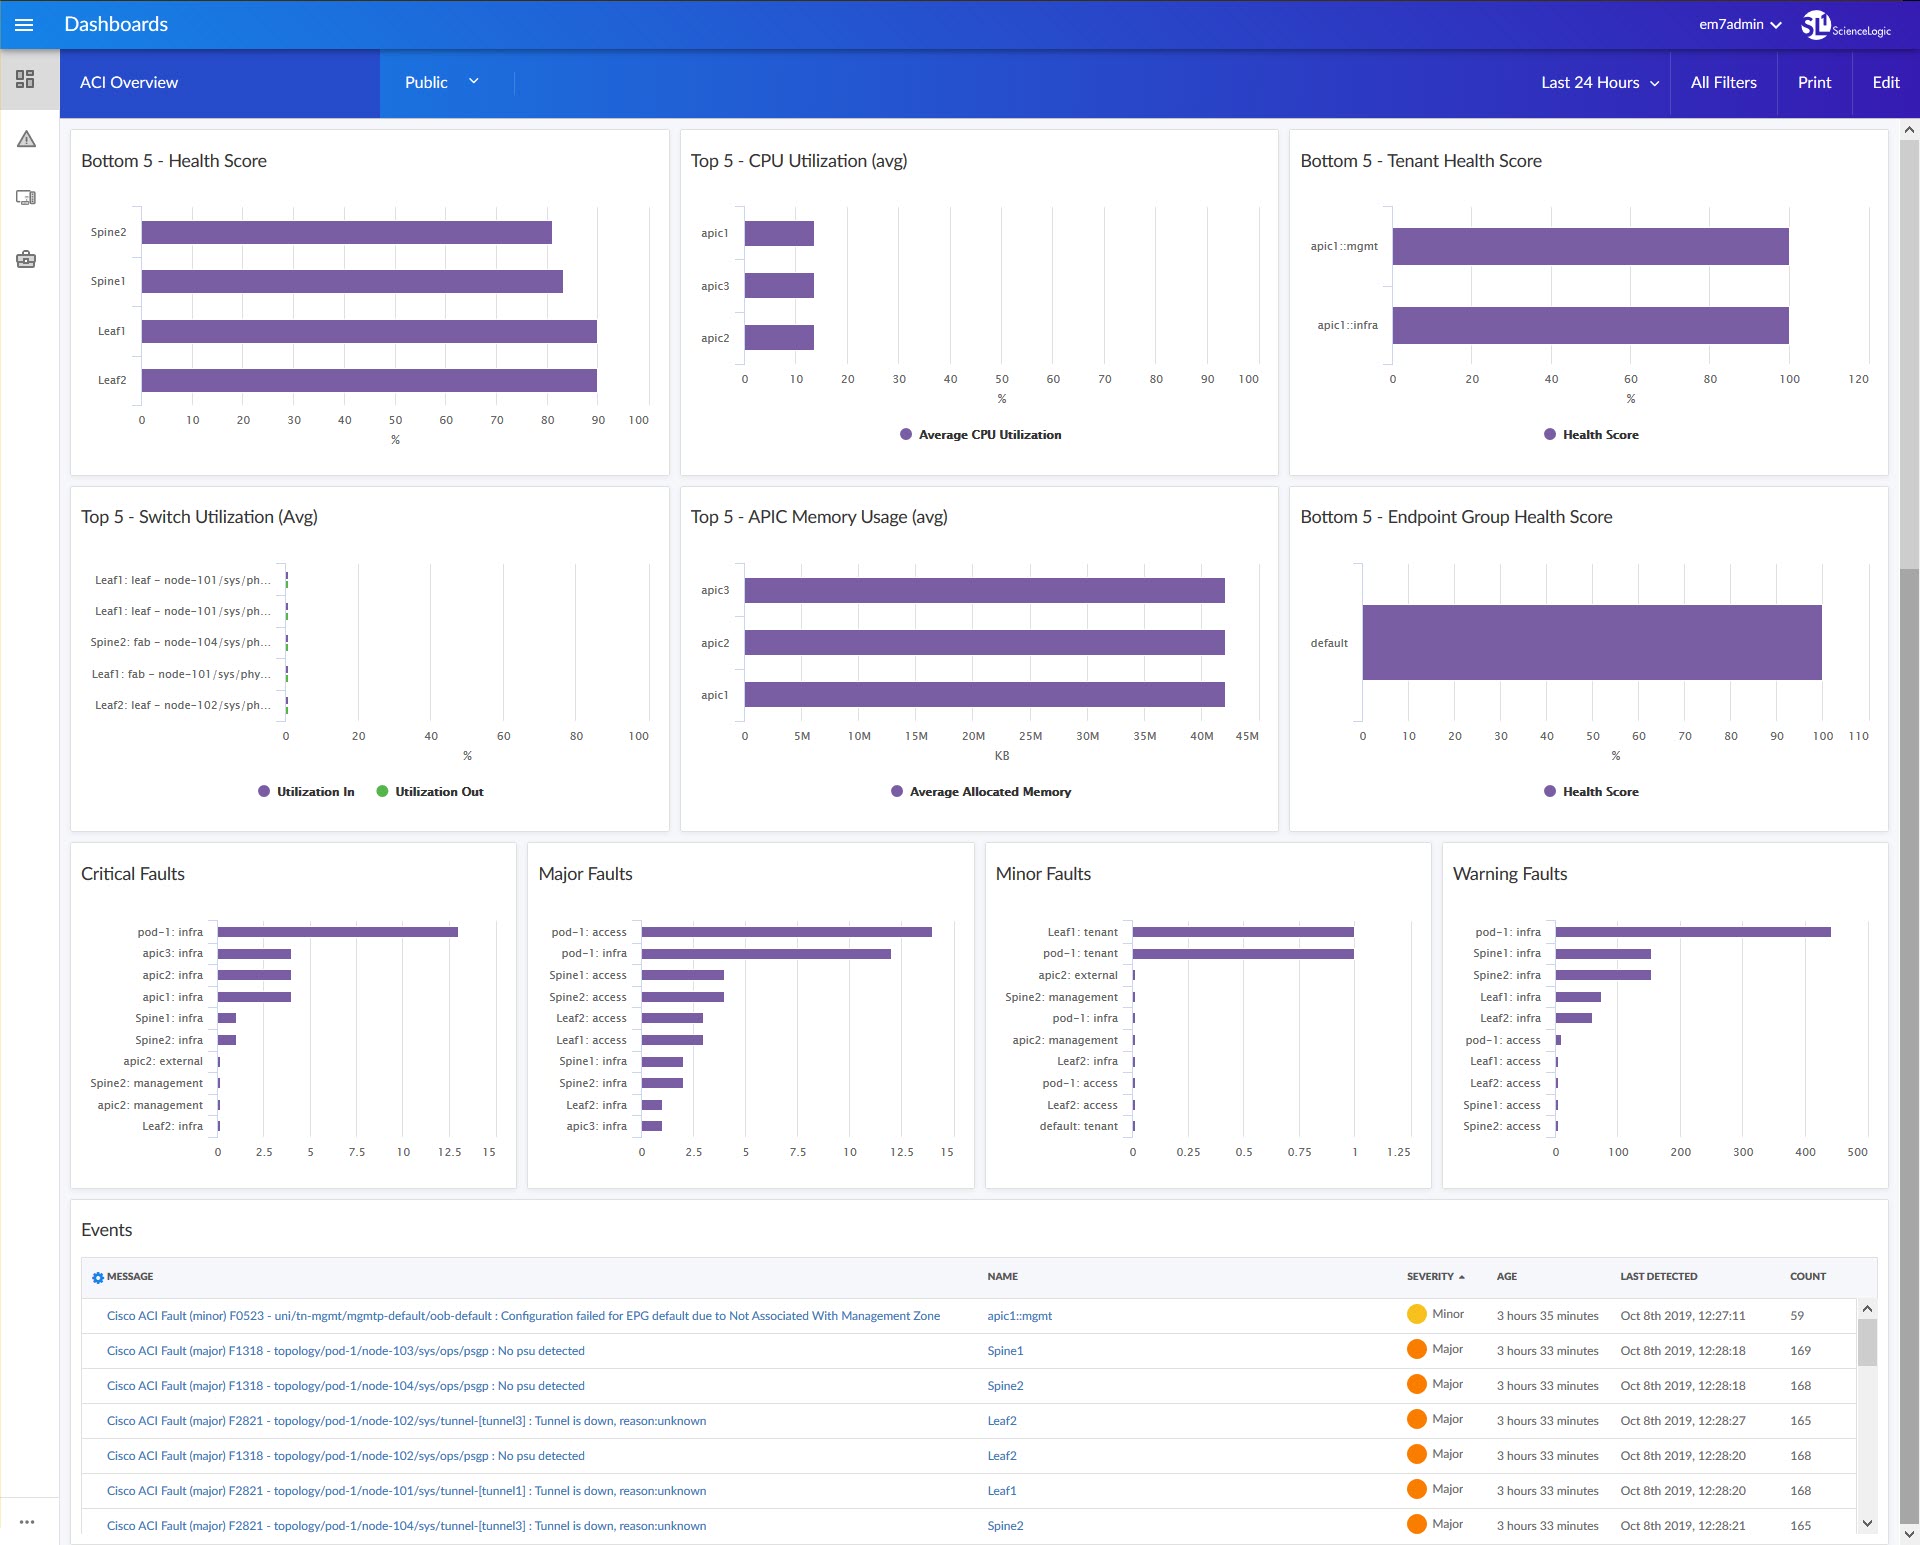
- An "ACI Overview" dashboard, which includes the following widgets that display data about your ACI devices:
- Bottom 5 - Health Score
- Top 5 - CPU Utilization (avg)
- Bottom 5 - Tenant Health Score
- Top 5 - Switch Utilization (avg)
- Top 5 - APIC Memory Usage (avg)
- Bottom 5 - Endpoint Group Health Score
- Critical Faults
- Major Faults
- Minor Faults
- Warning Faults
- Events
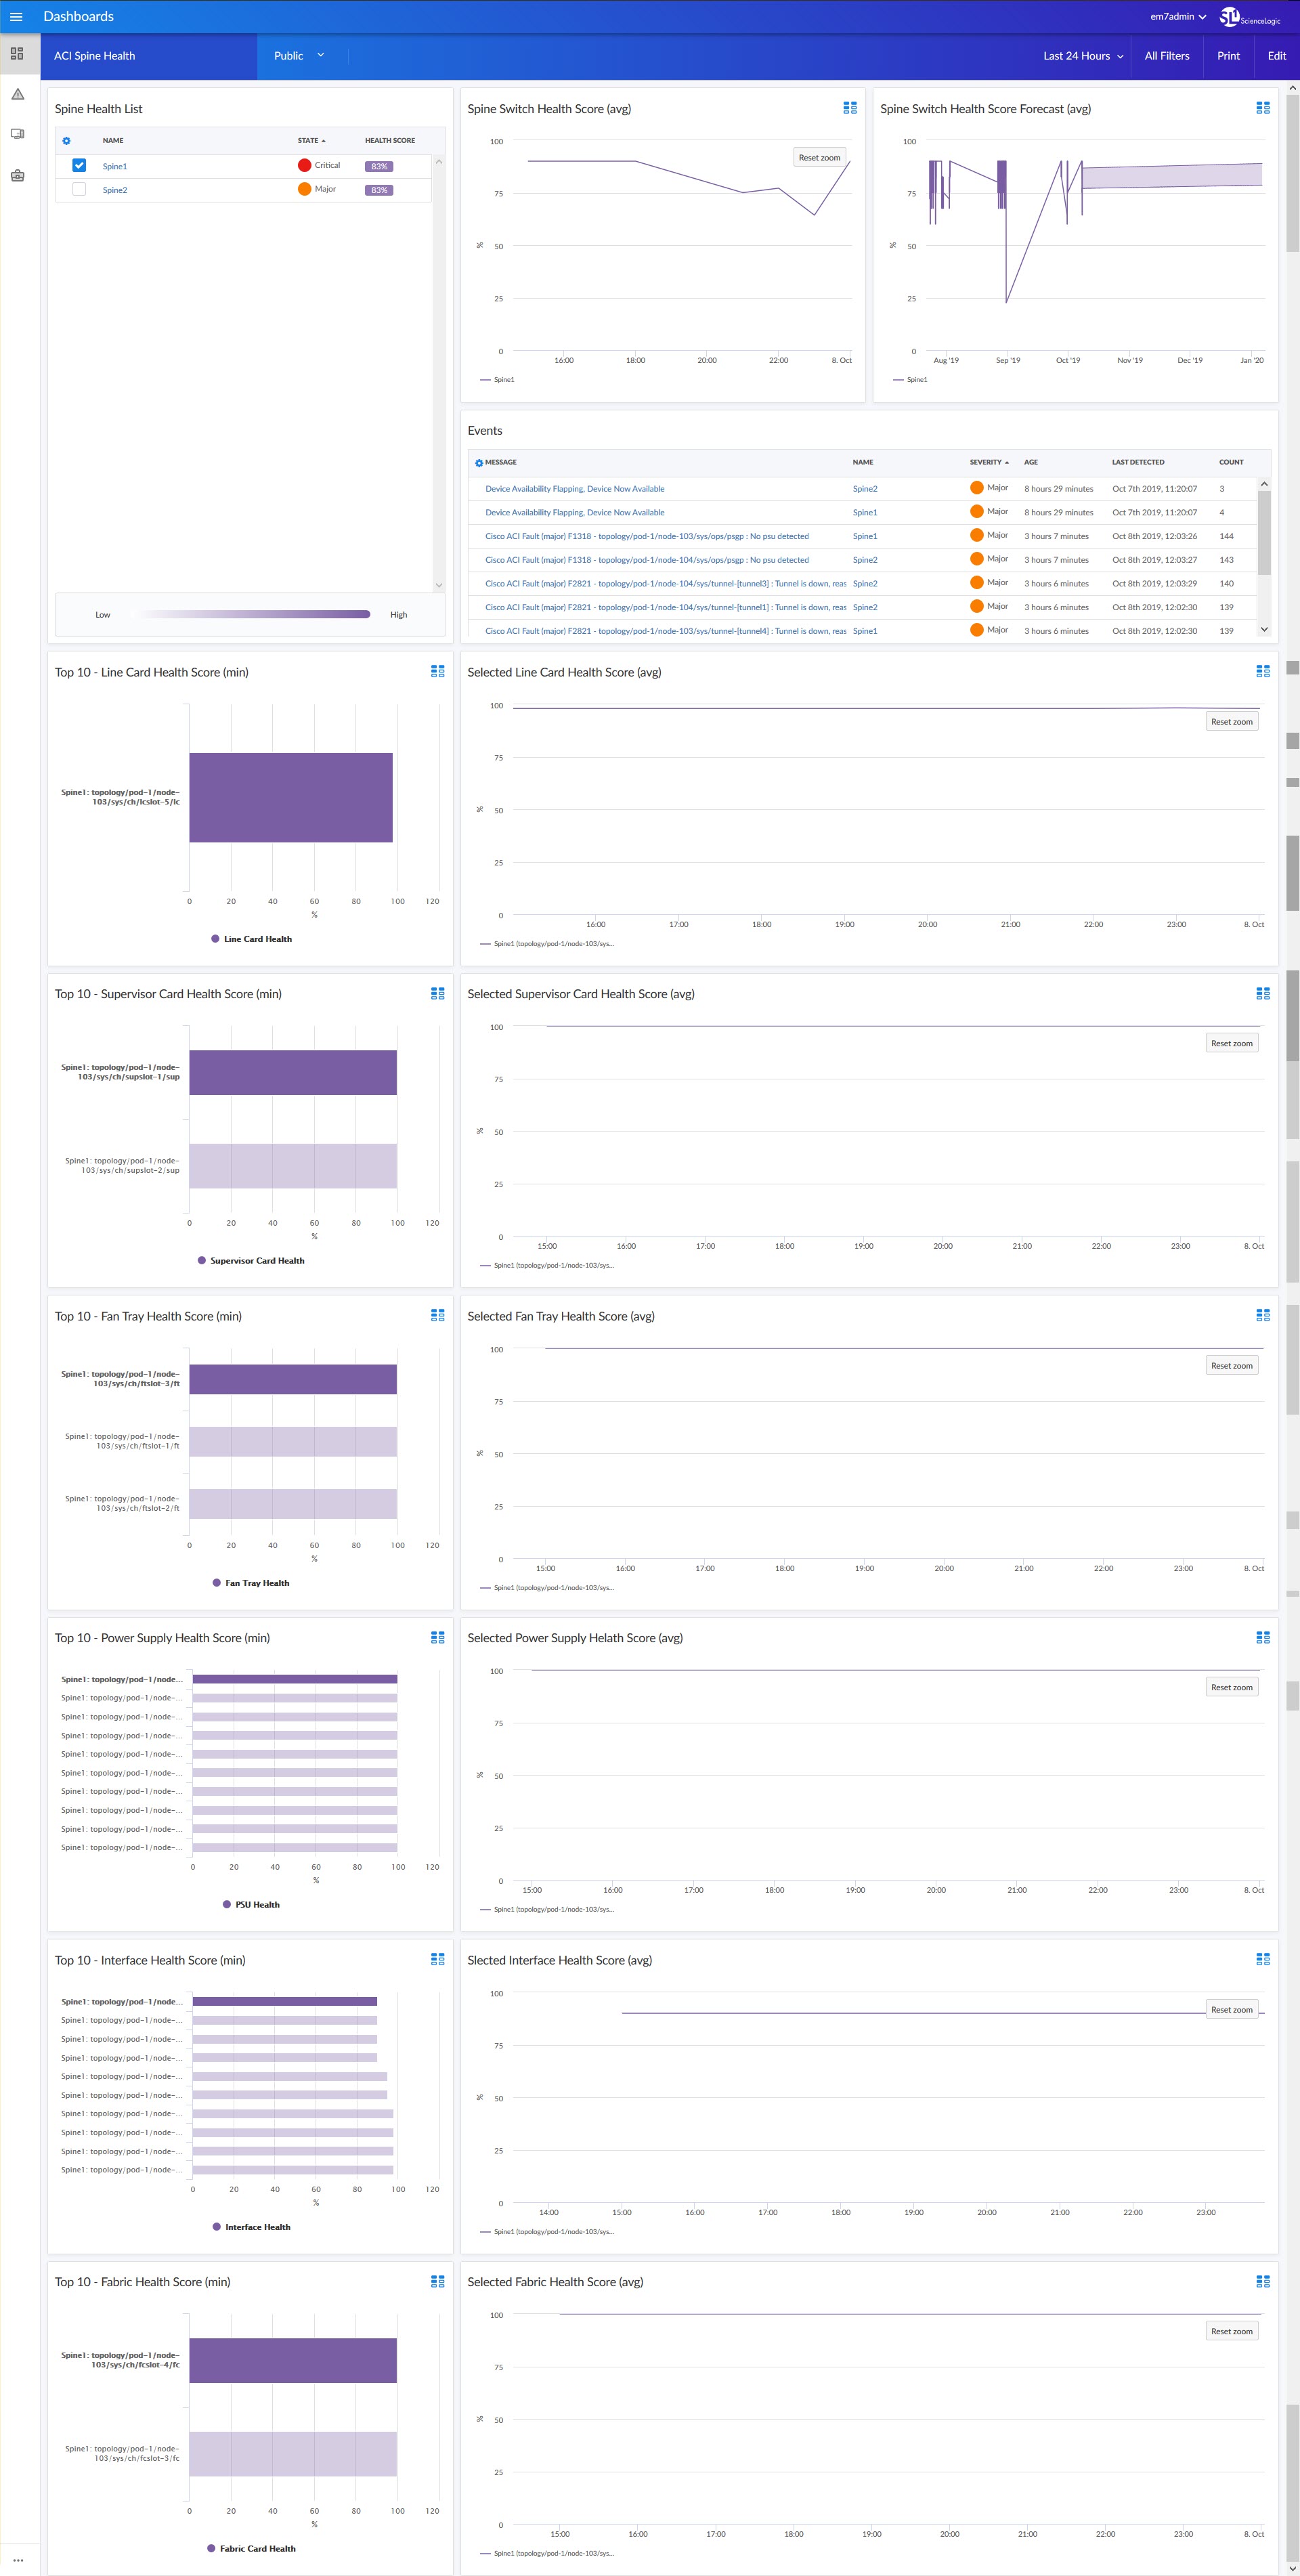
- An "ACI Spine Health" dashboard, which includes the following widgets that display data about your ACI spines:
- Spine Health List
- Spine Switch Health Score (avg)
- Spine Switch Health Score Forecast (avg)
- Events
- Top 10 - Line Card Health Score (min)
- Selected Line Card Health Score (avg)
- Top 10 - Supervisor Card Health Score (min)
- Selected Supervisor Card Health Score (avg)
- Top 10 - Fan Tray Health Score (min)
- Selected Fan Tray Health Score (avg)
- Top 10 - Power Supply Health Score (min)
- Selected Power Supply Health Score (avg)
- Top 10 - Interface Health Score (min)
- Selected Interface Health Score (avg)
- Top 10 - Fabric Health Score (min)
- Selected Fabric Health Score (avg)
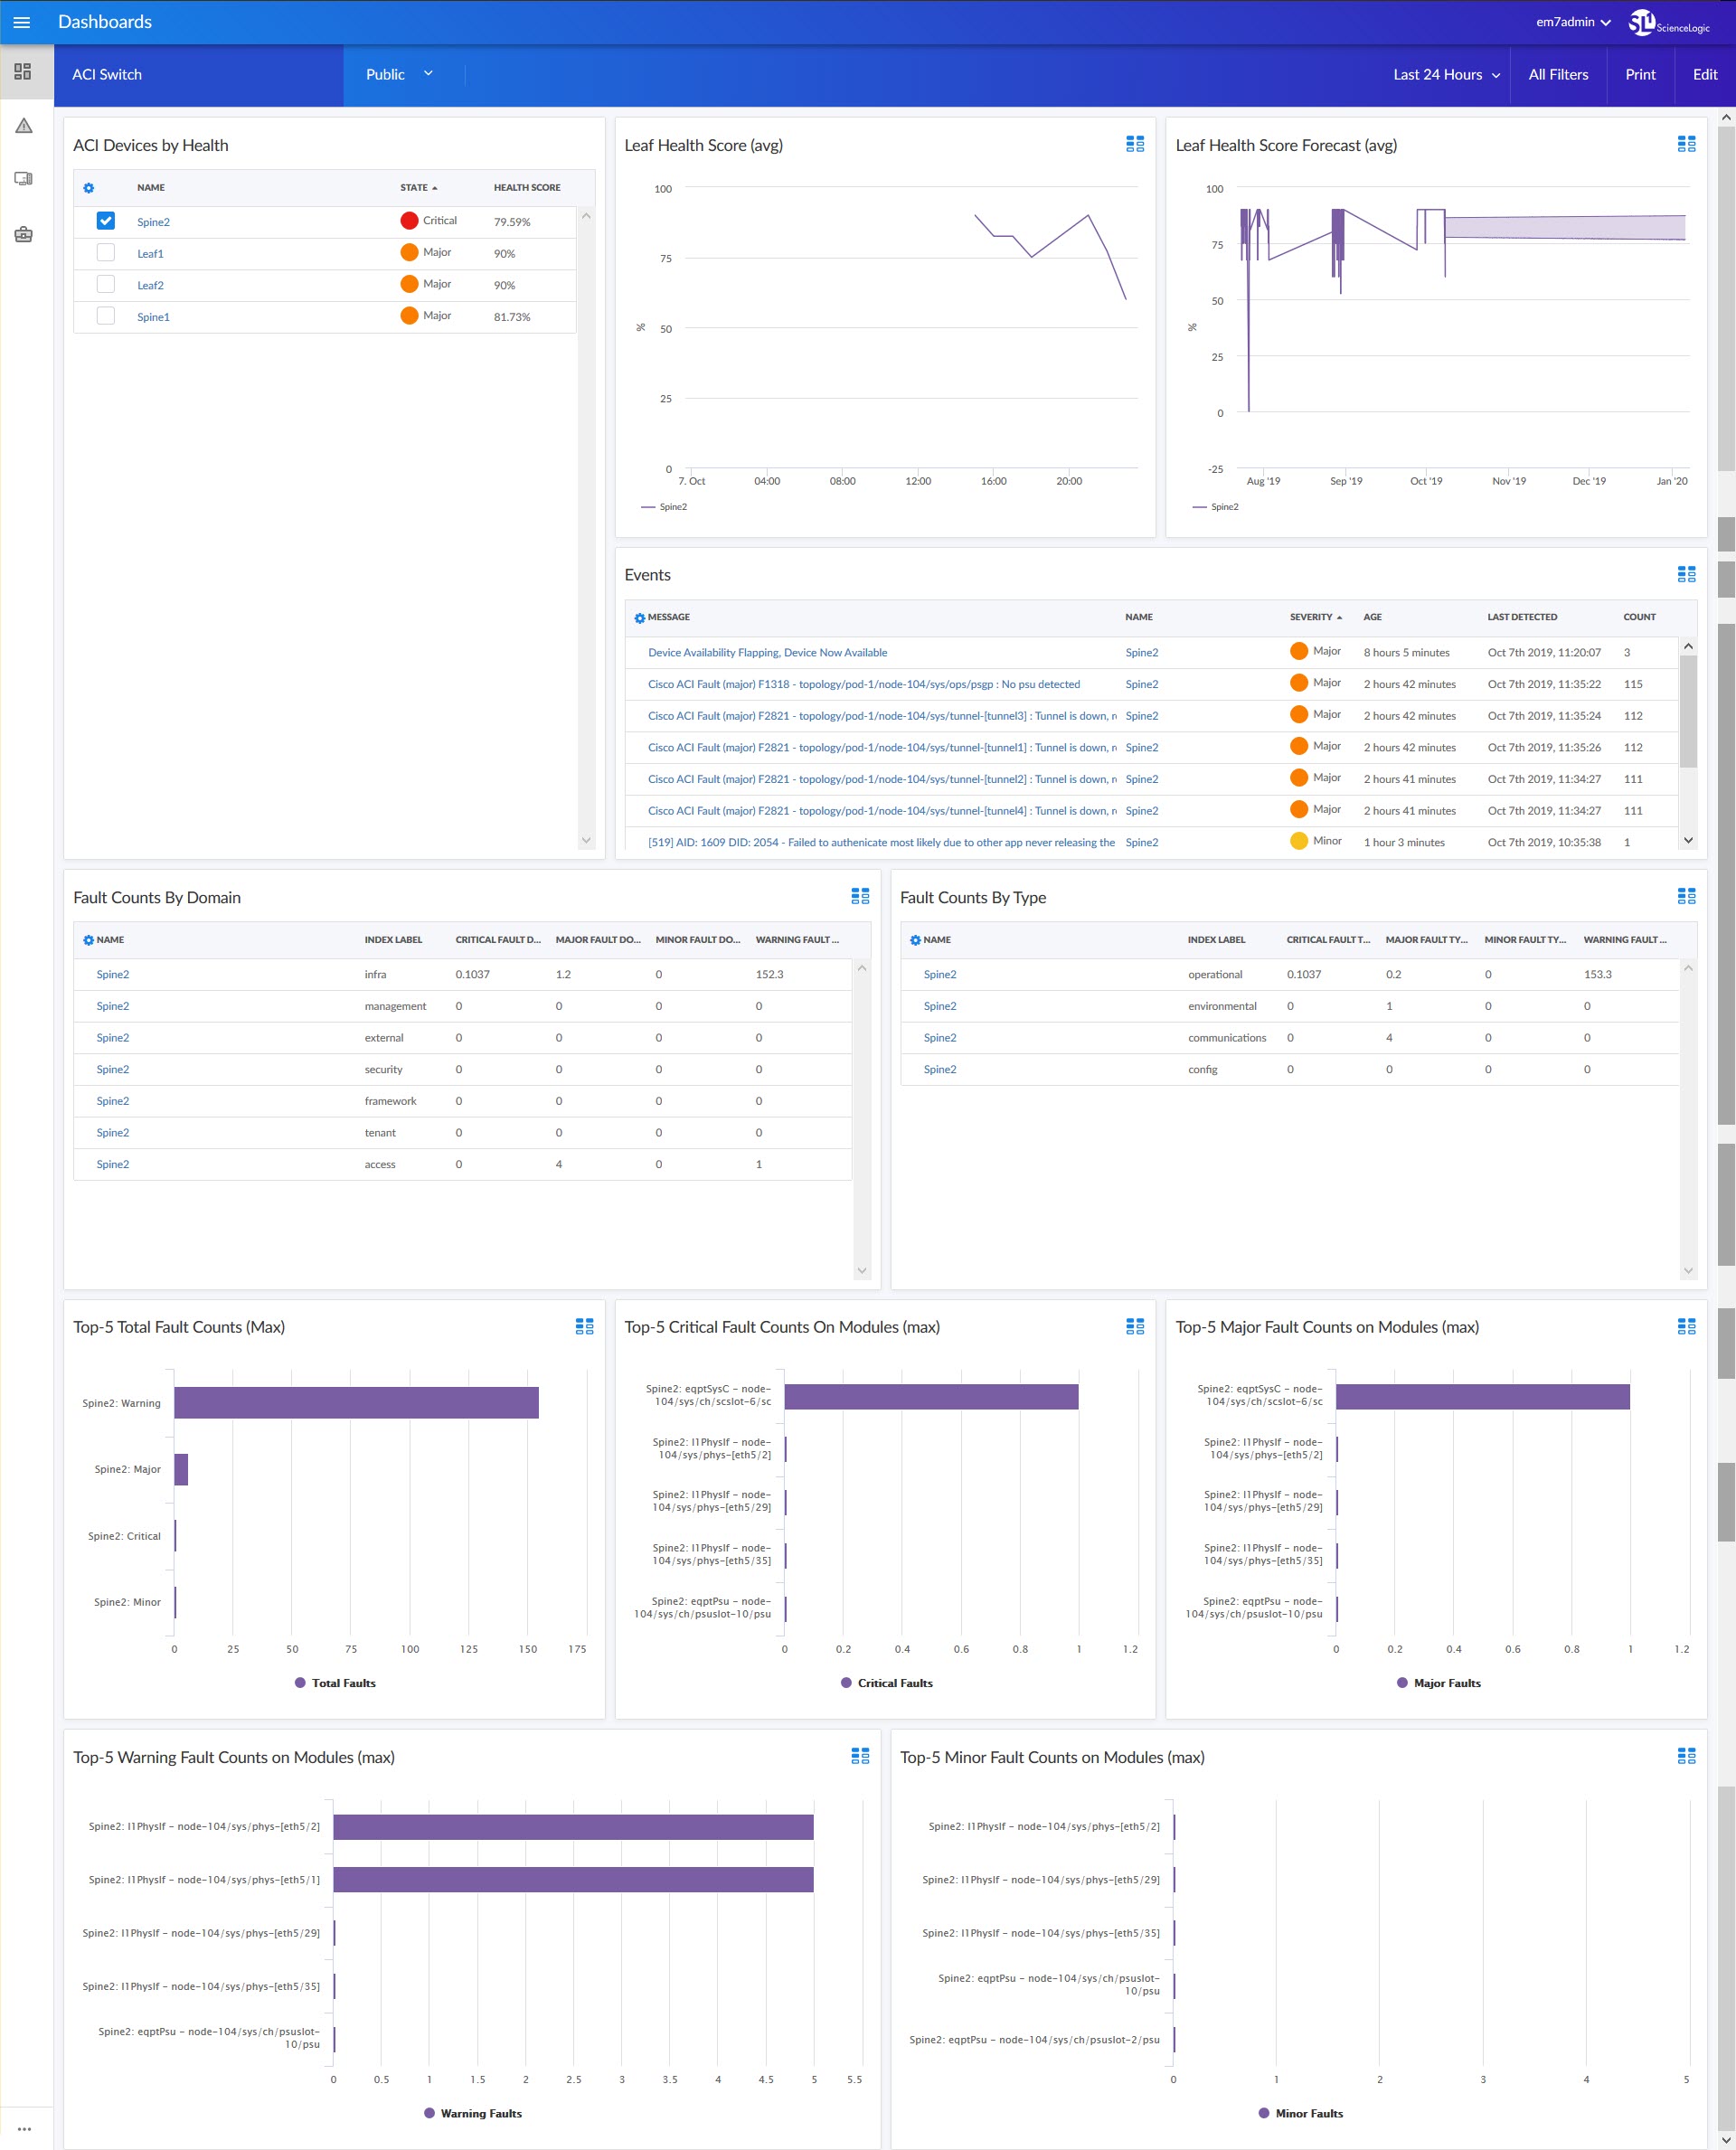
- An "ACI Switch" dashboard, which includes the following widgets that display data about your ACI switches:
- ACI Devices by Health
- Leaf Health Score (avg)
- Leaf Health Score Forecast (avg)
- Events
- Fault Counts by Domain
- Fault Counts by Type
- Top 5 - Total Fault Counts (max)
- Top 5 - Critical Fault Counts on Modules (max)
- Top 5 - Major Fault Counts on Modules (max)
- Top 5 - Warning Fault Counts on Modules (max)
- Top 5 - Minor Fault Counts on Modules (max)
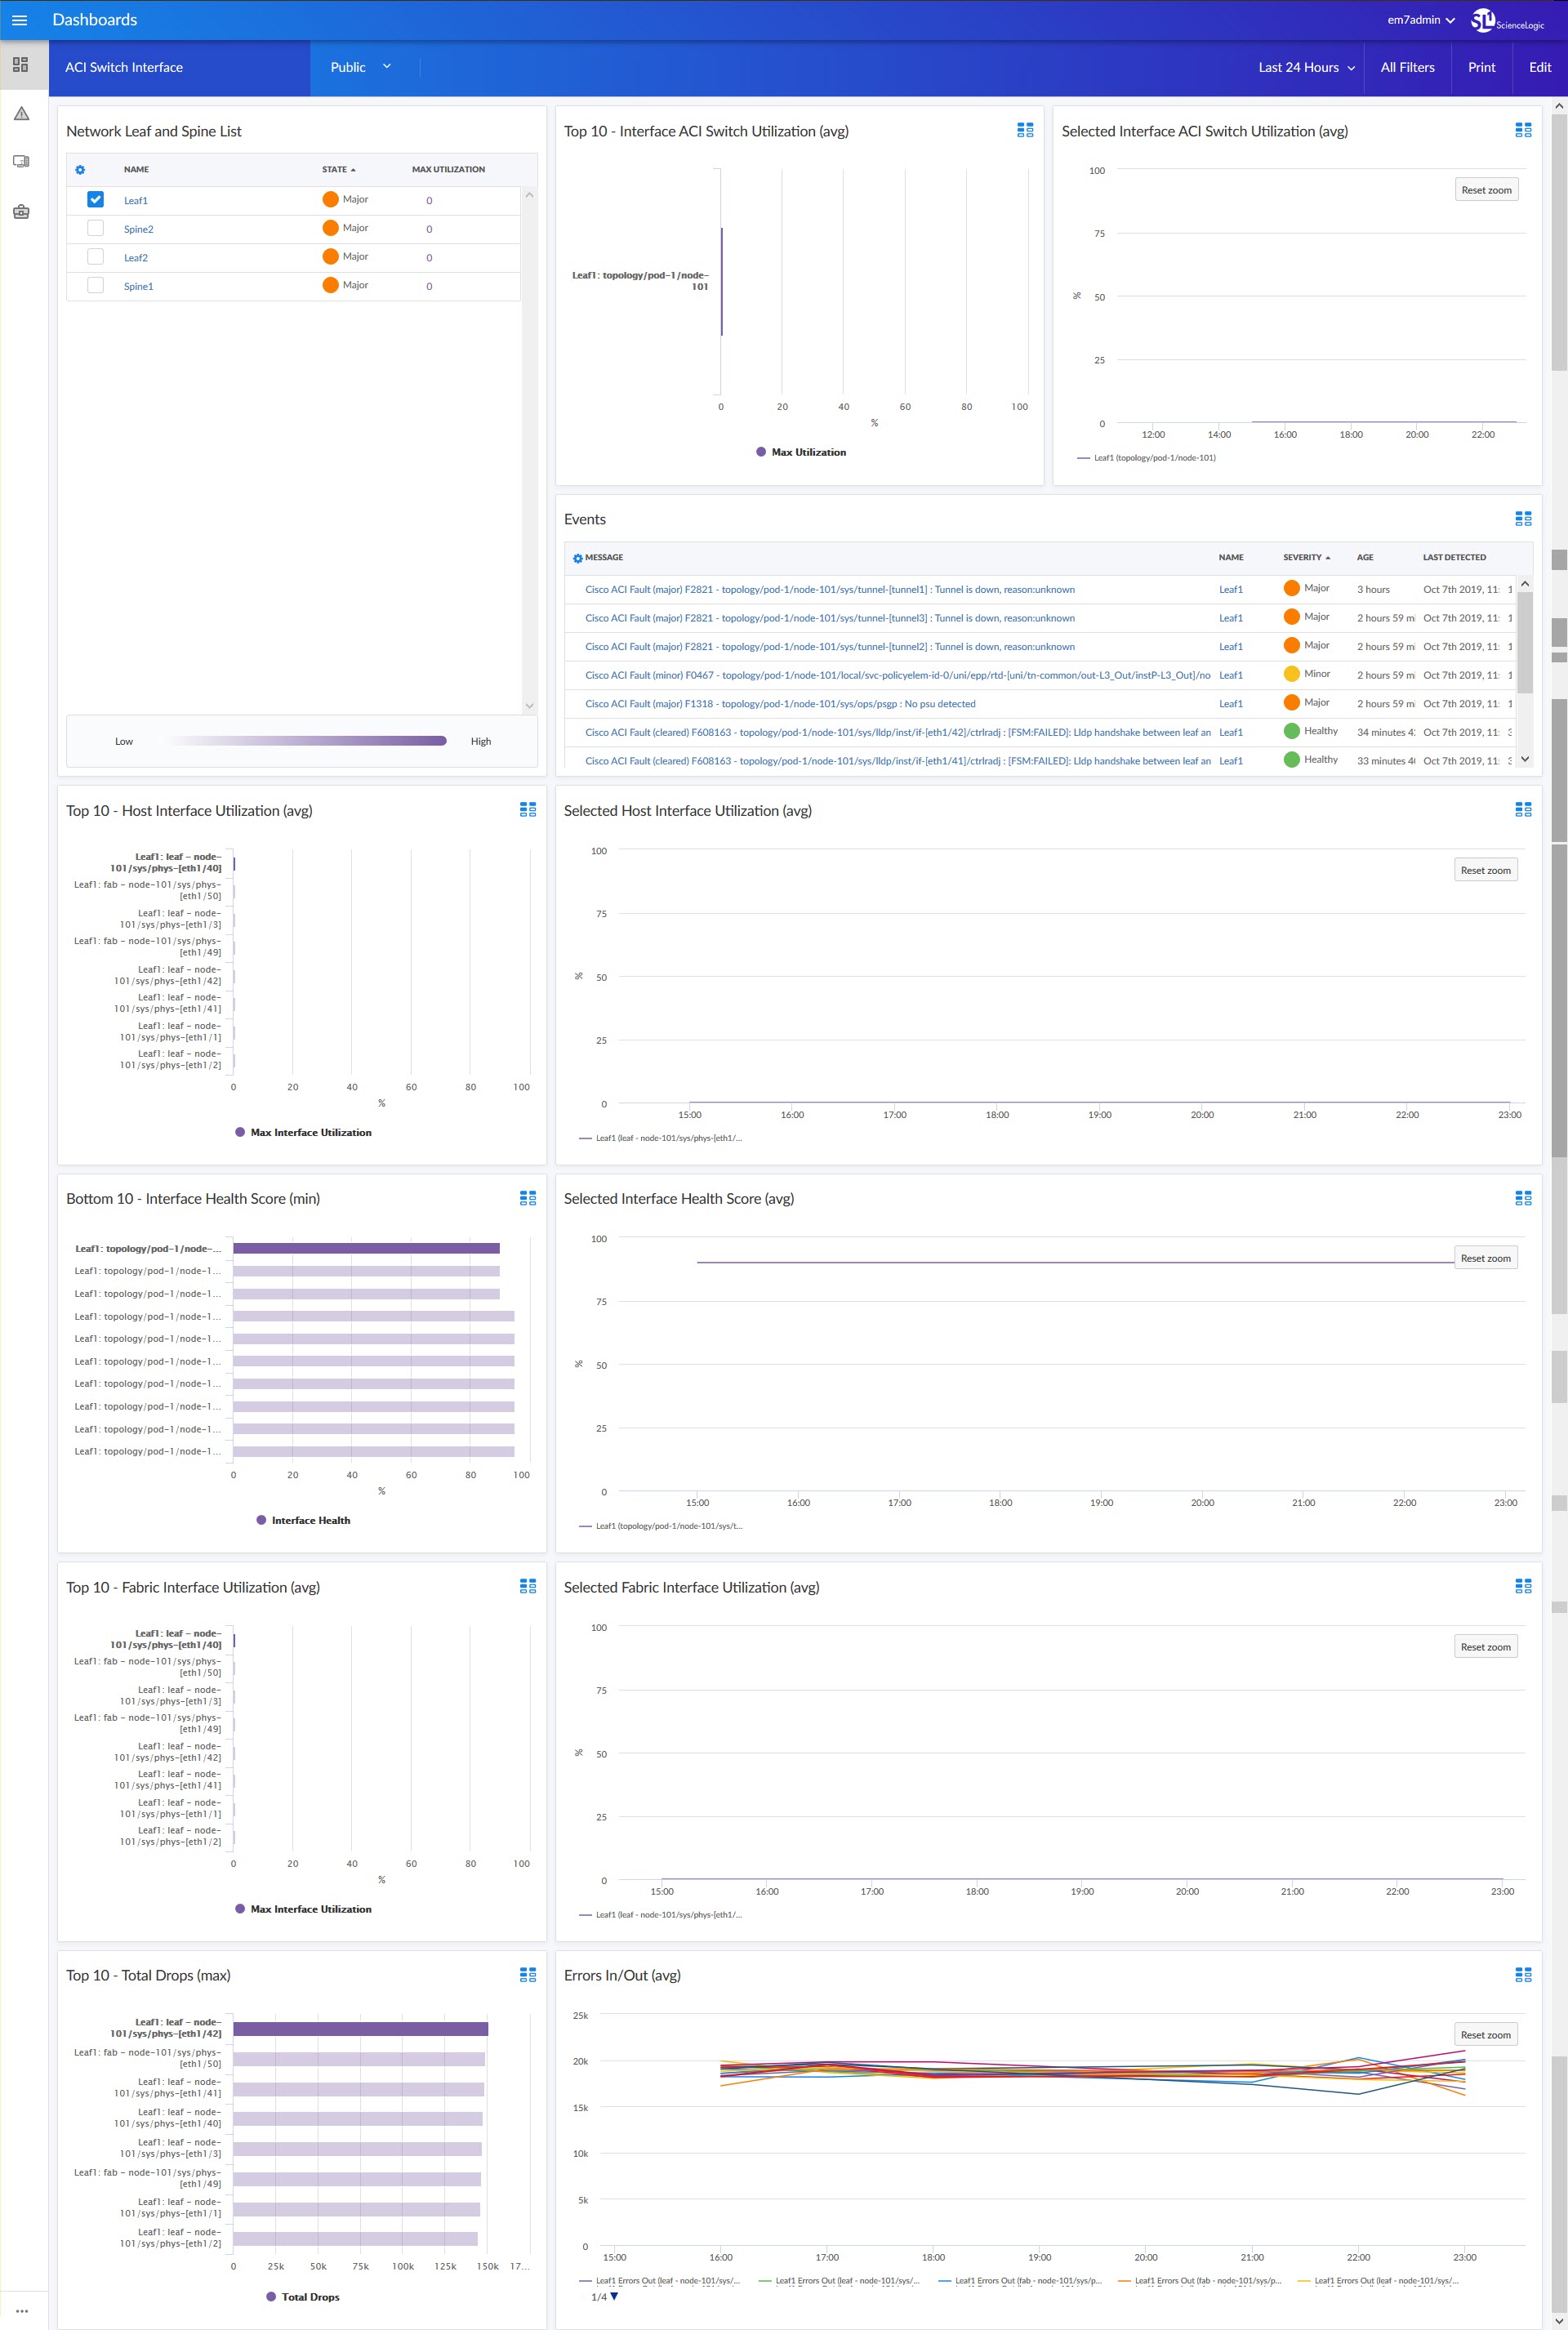
- An "ACI Switch Interface" dashboard, which includes the following widgets that display data about your ACI switch interfaces:
- Network Leaf and Spine List
- Top 10 - Interface ACI Switch Utilization (avg)
- Selected Interface ACI Switch Utilization (avg)
- Events
- Top 10 - Host Interface Utilization (avg)
- Selected Host Utilization (avg)
- Bottom 10 - Interface Health Score (min)
- Selected Interface Health Score (avg)
- Top 10 - Fabric Interface Utilization (avg)
- Selected Fabric Interface Utilization (avg)
- Top 10 - Total Drops (max)
- Errors In/Out (avg)
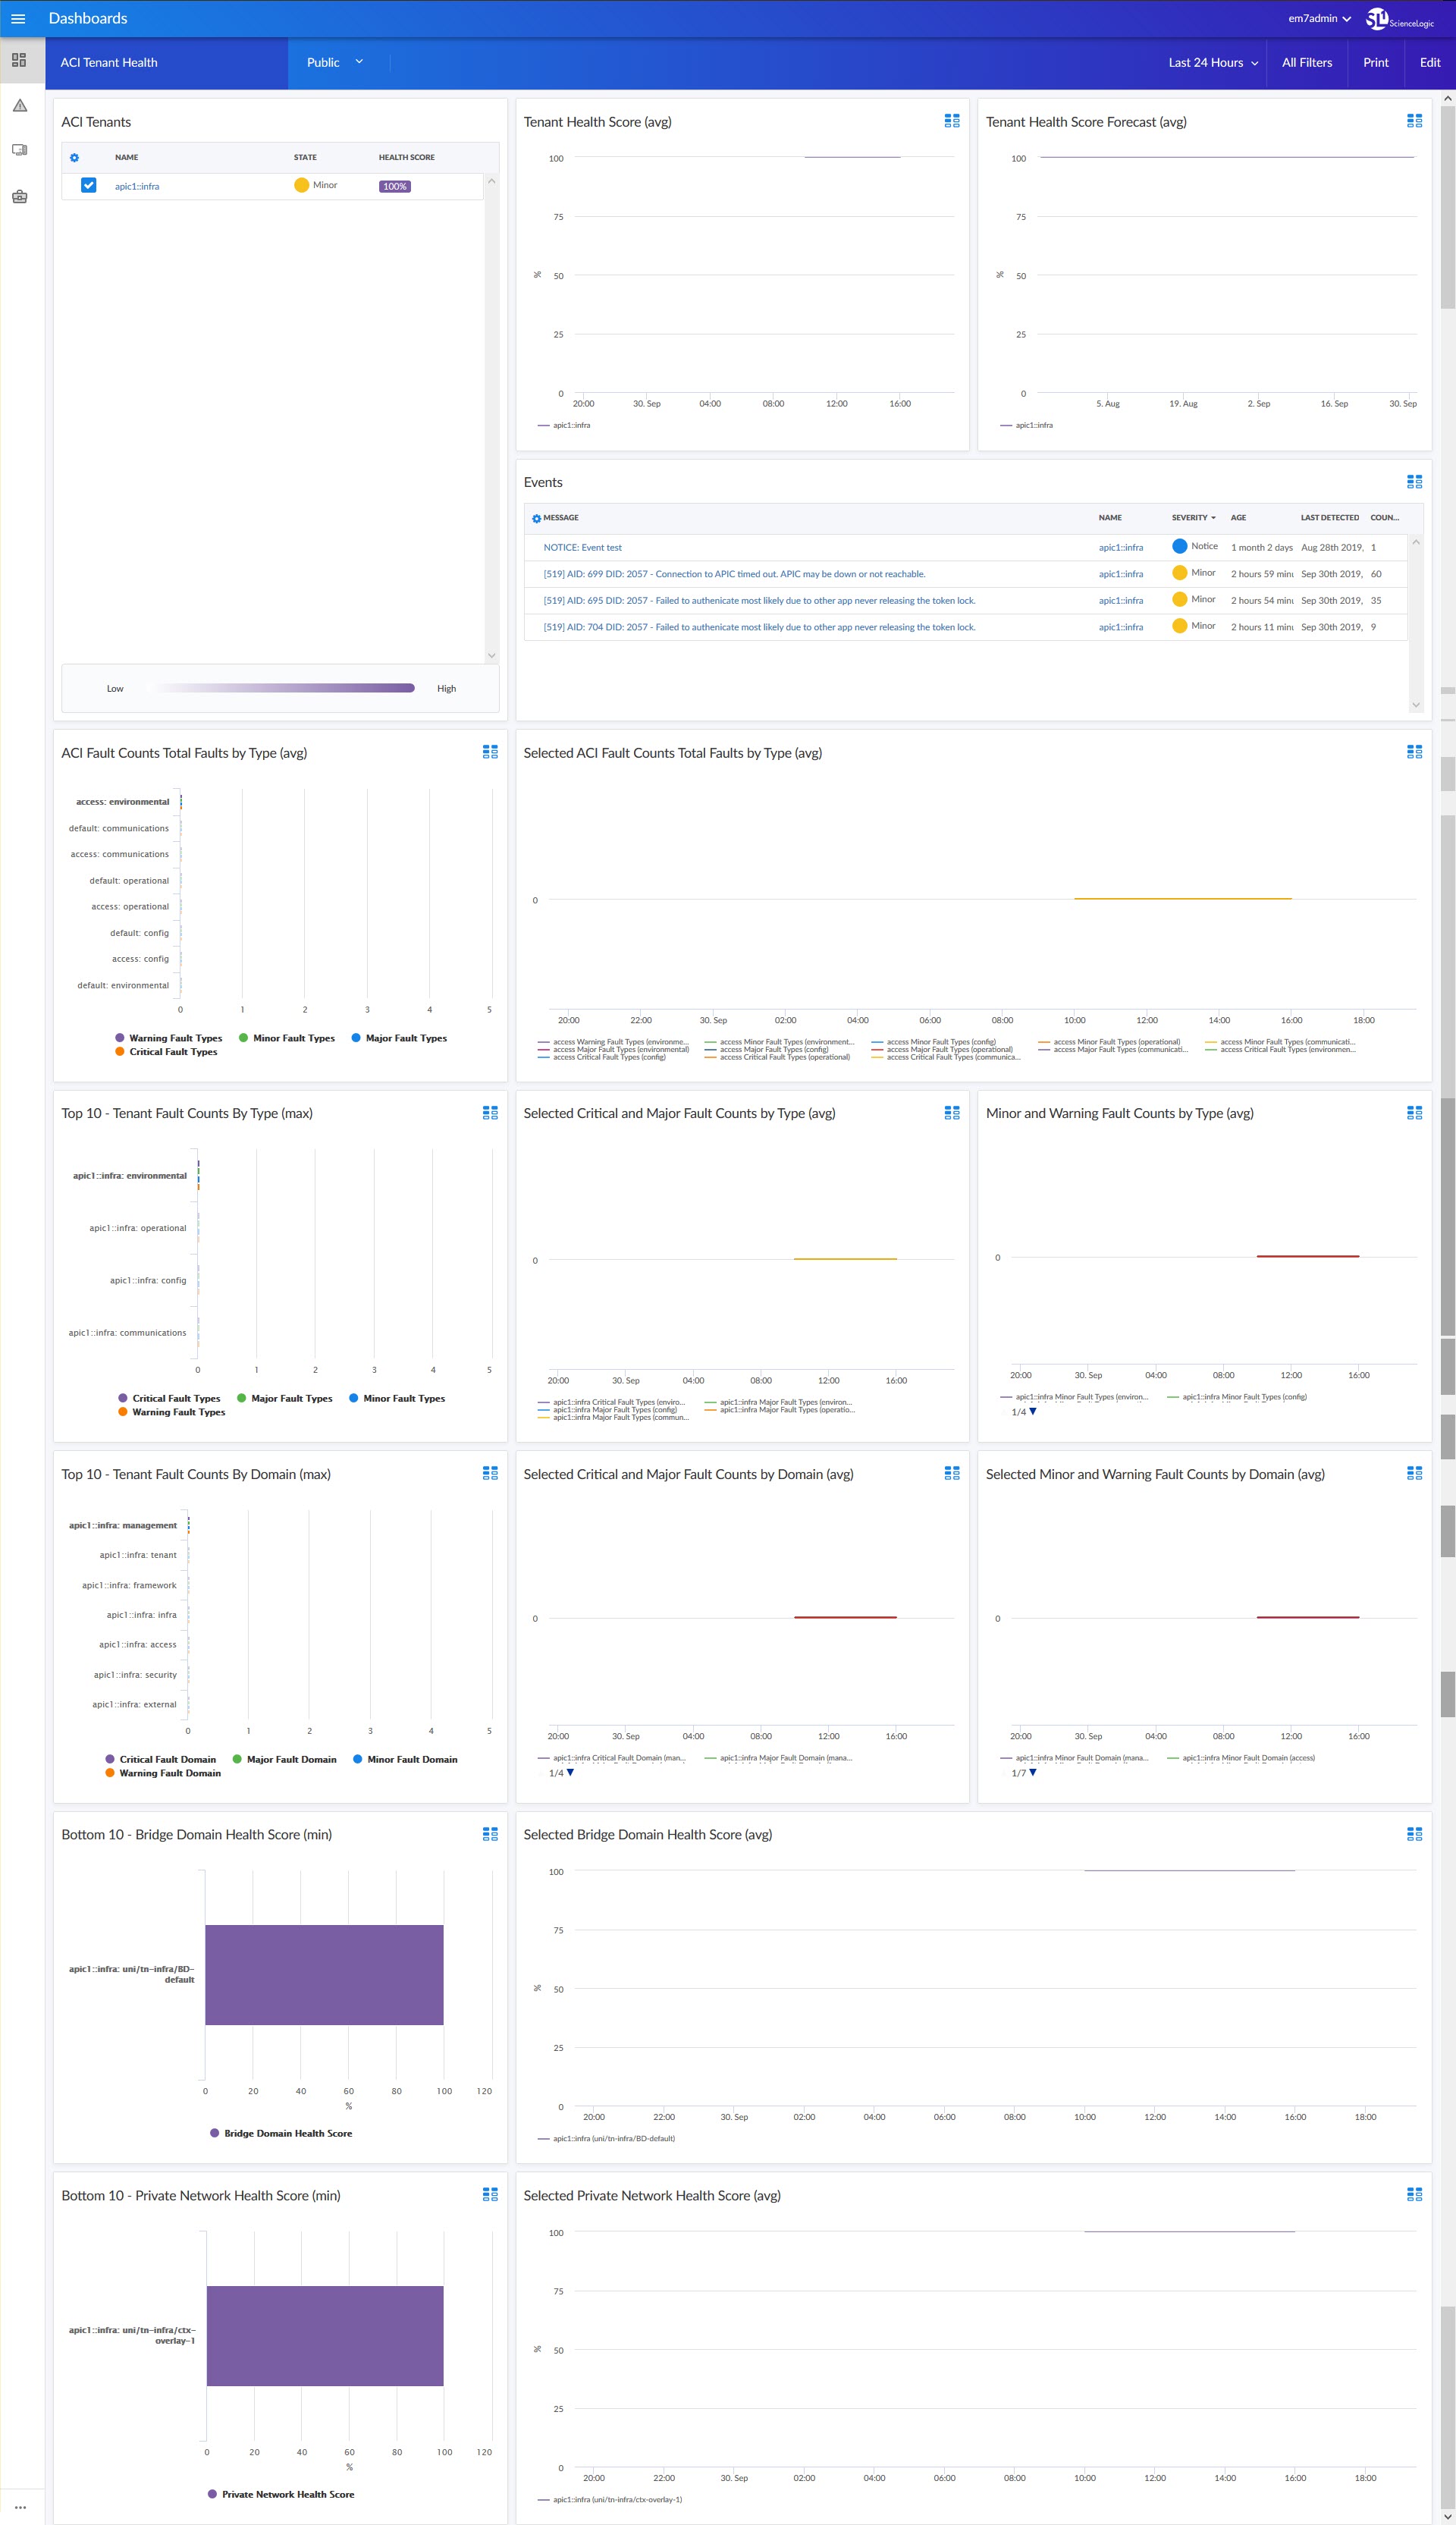
- An "ACI Tenant Health" dashboard, which includes the following widgets that display data about your ACI tenants:
- ACI Tenants
- Tenant Health Score (avg)
- Tenant Health Score Forecast (avg)
- Events
- ACI Total Fault Counts By Type (avg)
- Selected ACI Fault Counts Total Faults By Type (avg)
- Top 10 - Total Fault Counts By Type (max)
- Selected Critical and Major Fault Counts by Type (avg)
- Minor and Warning Fault Counts by Type (avg)
- Top 10 - Tenant Fault Counts By Domain (max)
- Selected Critical and Major Fault Counts By Domain (avg)
- Selected Minor and Warning Fault Counts By Domain (avg)
- Bottom 10 - Bridge Domain Health Score (min)
- Selected Bridge Domain Health Score (avg)
- Bottom 10 - Private Network Health Score (min)
- Selected Private Network Health Score (avg)
Enhancements and Issues Addressed
The following enhancements and addressed issues are included in version 102 of the Cisco ACI: SL1 Dashboards PowerPack:
- Autoselect for context-driving widgets has been enabled in all dashboards in the PowerPack.
- The ACI Health Score Forecast widget was added to the "ACI Application" dashboard.
- The ACI Health Score Forecast and Events widgets were added to the "ACI Health" dashboard.
- The Leaf Switch Health Score Forecast widget was added to the "ACI Leaf Health" dashboard.
- The Spine Switch Health Score Forecast widget was added to the "ACI Spine Health" dashboard.
- The Leaf Health Score Forecast widget was added to the "ACI Switch" dashboard.
- The Events widget was added to the "ACI Switch Interface" dashboard.
- The Tenant Health Score Forecast widget was added to the "ACI Tenant Health" dashboard.
Known Issues
Version 102 of the Cisco ACI: SL1 Dashboards PowerPack has no known issues.