![]()
Version 102 of the Cisco: Viptela SL1 Dashboards PowerPack includes Dashboards that present graphical representations of the configuration data and performance metrics that are collected for Cisco Viptela devices by the Cisco: Viptela PowerPack.
NOTE: These dashboards are intended for use only in the new SL1 user interface and will not load in the classic ScienceLogic platform user interface.
- Minimum Required SL1 Version: 8.12.1
- Minimum Required AP2 Version: 5.155.0-hotfix.8
- Minimum Required Widget Components Version: 2.185.0-hotfix.3
- Minimum Required Cisco: ViptelaPowerPack Version: 101
Before You Install
Before installing Cisco: Viptela SL1 Dashboards PowerPack version 102, you must first ensure that you are running version 8.12.1 or later of SL1.
NOTE: For details on upgrading SL1, see the appropriate Release Notes.
You must also import and install the Cisco: ViptelaPowerPack version 101 or later before installing the PowerPack.
Installation Process
To install this PowerPack:
- Familiarize yourself with the Known Issues for this release.
- See the Before You Install or Upgrade section. If you have not done so already, upgrade your system to the 8.12.1 or later release.
- Download the "Cisco: Viptela SL1 Dashboards" version 102PowerPack from the Support Site to a local computer.
- Go to the PowerPack Manager page (System > Manage > PowerPacks). Click the menu and choose Import PowerPack. When prompted, import "Cisco: Viptela SL1 Dashboards" version 102.
- Click the button. For details on installing PowerPacks, see the chapter on Installing a PowerPack in the PowerPacks manual.
Features
The following dashboards are included in version 102 of the Cisco: Viptela SL1 Dashboards PowerPack:
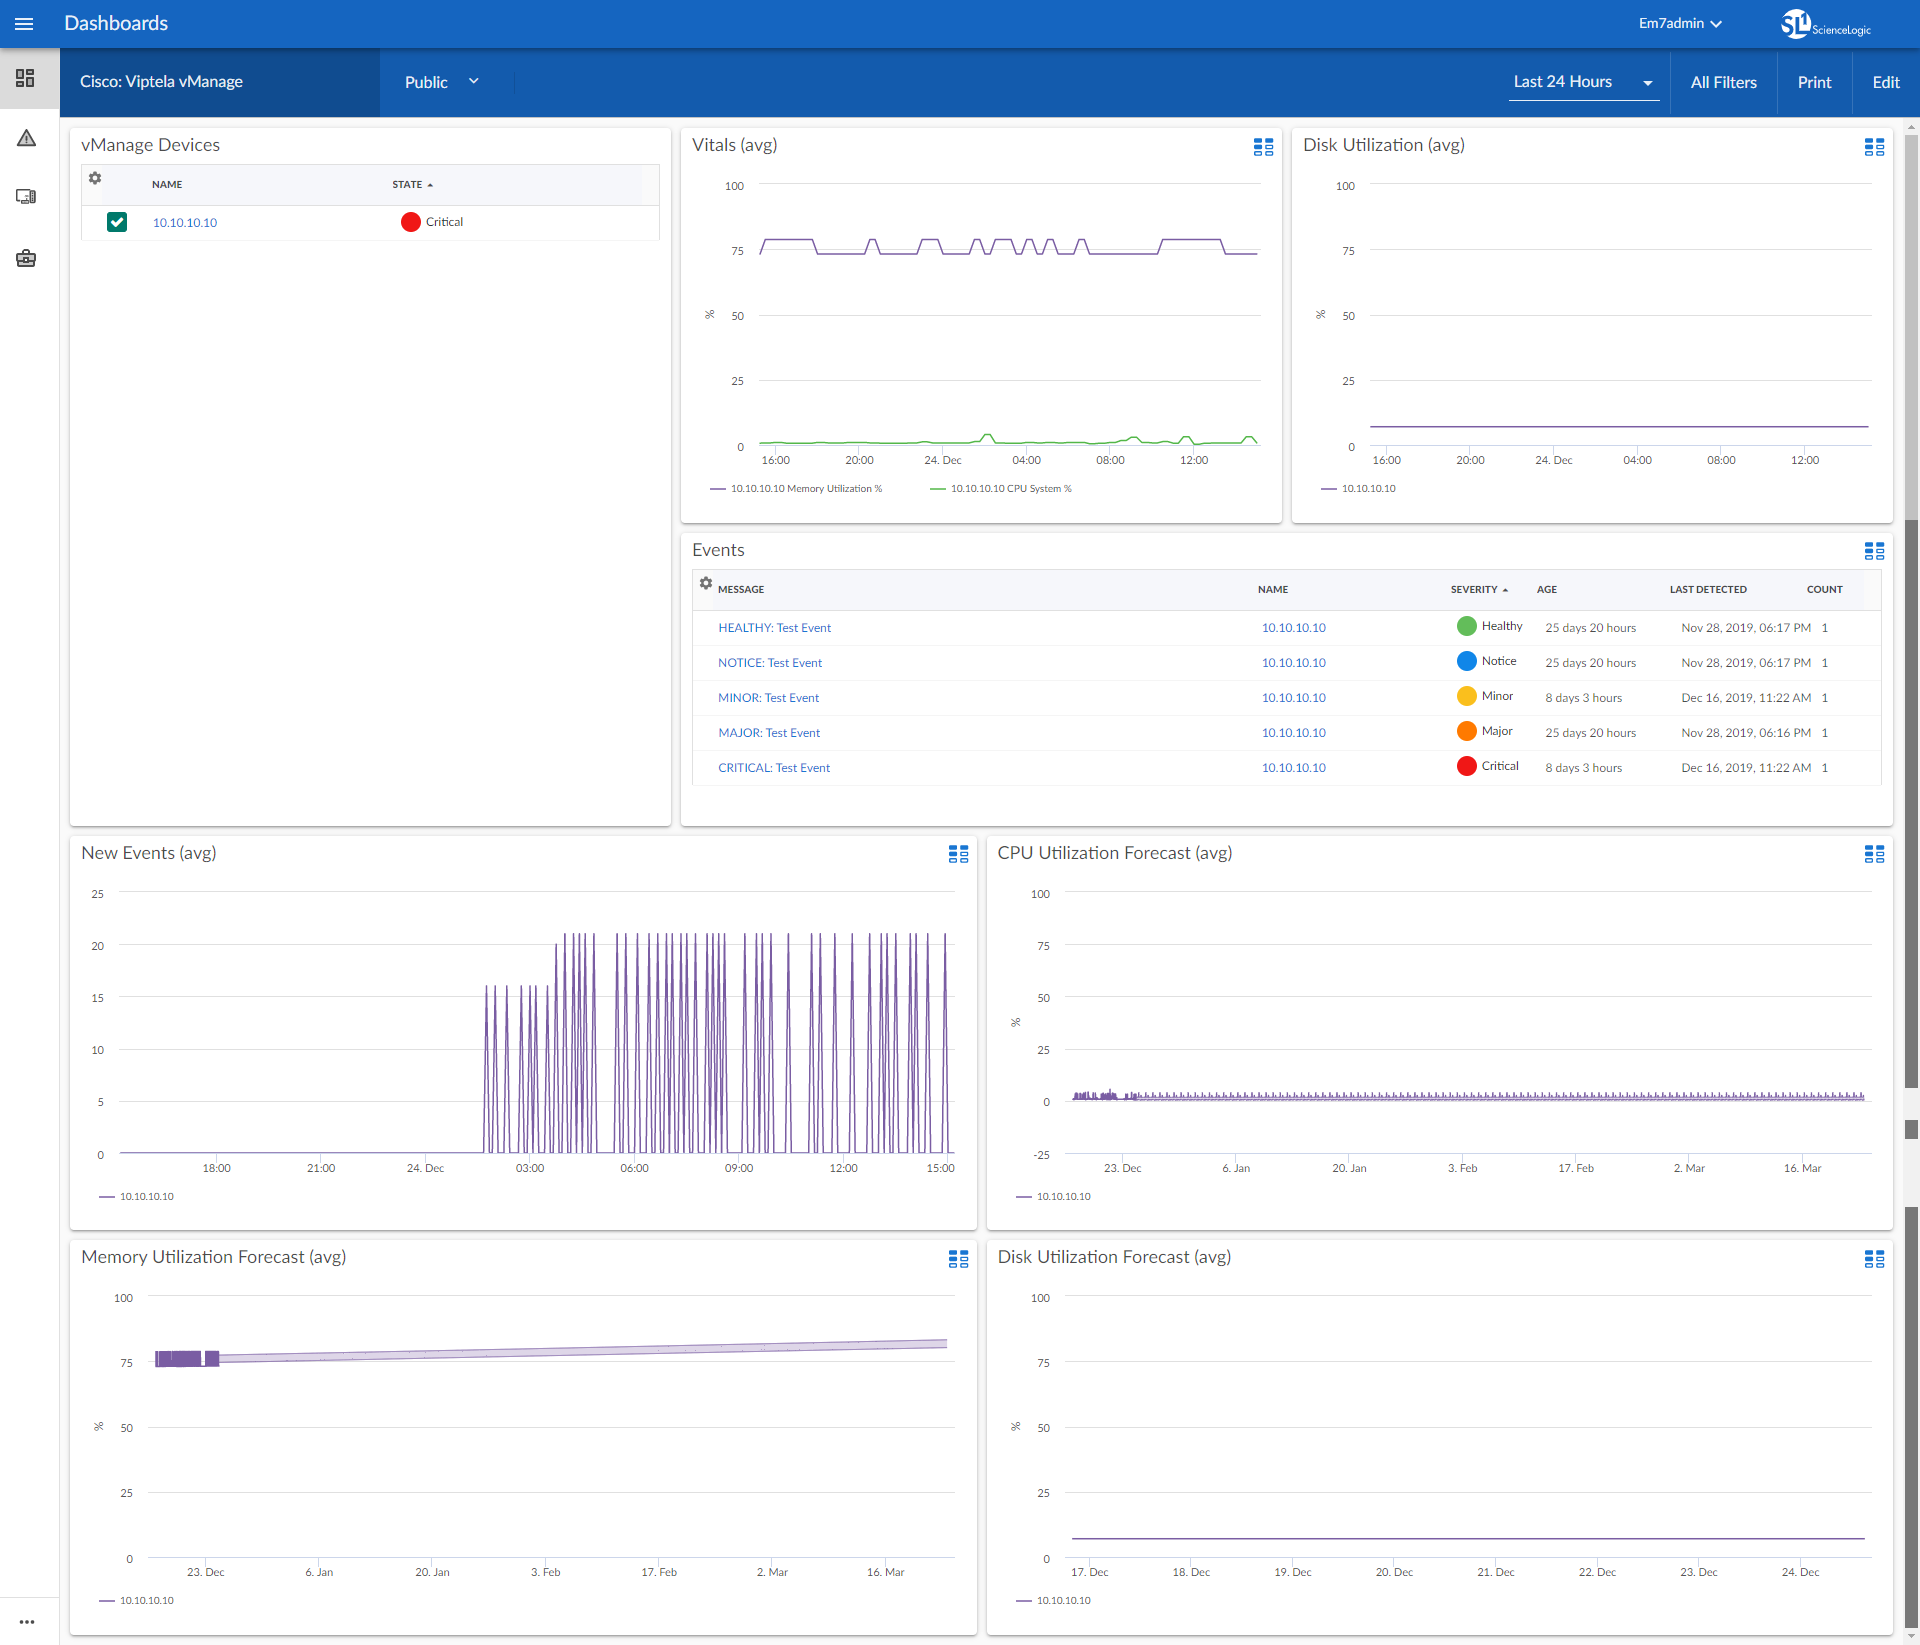
- A "Cisco: Viptela vManage" dashboard, which includes the following widgets that display data about your vManage devices:
- vManage Devices
- Vitals (avg)
- New Events (avg)
- Events
- CPU Utilization Forecast (avg)
- Memory Utilization Forecast (avg)
- Disk Utilization (avg)
- Disk Utilization Forecast (avg)
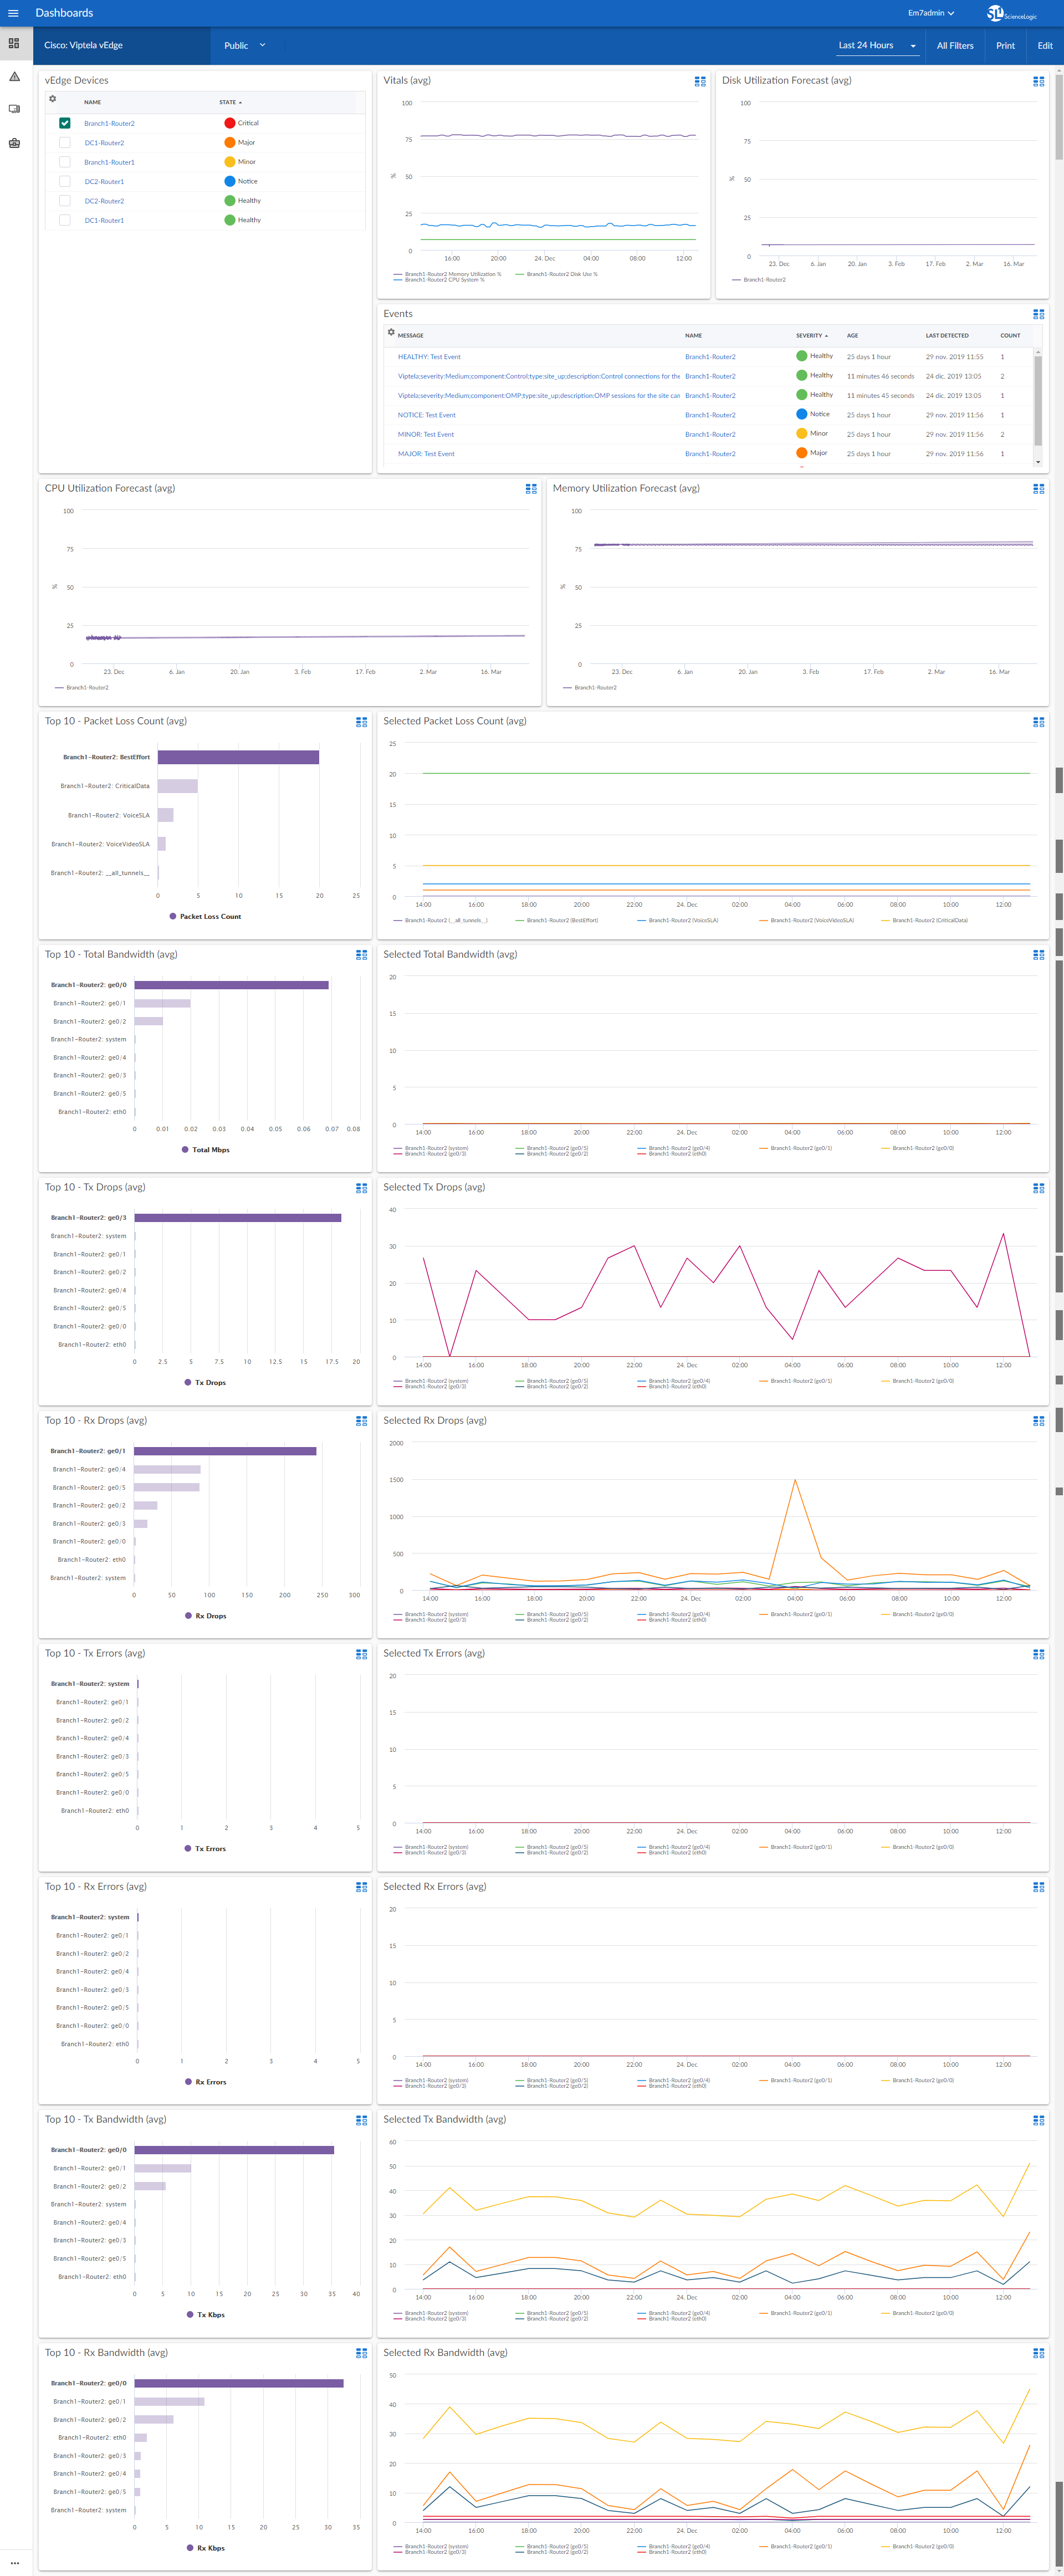
- A "Cisco: Viptela vEdge" dashboard, which includes the following widgets that display data about your vEdge devices:
- vEdge Devices
- Vitals (avg)
- Disk Utilization Forecast (avg)
- Events
- CPU Utilization Forecast (avg)
- Memory Utilization Forecast (avg)
- Top 10 - Packet Loss Count (avg)
- Selected Packet Loss Count (avg)
- Top 10 - Total Bandwidth (avg)
- Selected Total Bandwidth (avg)
- Top 10 - Tx Drops (avg)
- Selected Tx Drops (avg)
- Top 10 - Rx Drops (avg)
- Selected Rx Drops (avg)
- Top 10 - Tx Errors (avg)
- Selected Tx Errors (avg)
- Top 10 - Rx Errors (avg)
- Selected Rx Errors (avg)
- Top 10 - Tx Bandwidth (avg)
- Selected Tx Bandwidth (avg)
- Top 10 - Rx Bandwidth (avg)
- Selected Rx Bandwidth (avg)
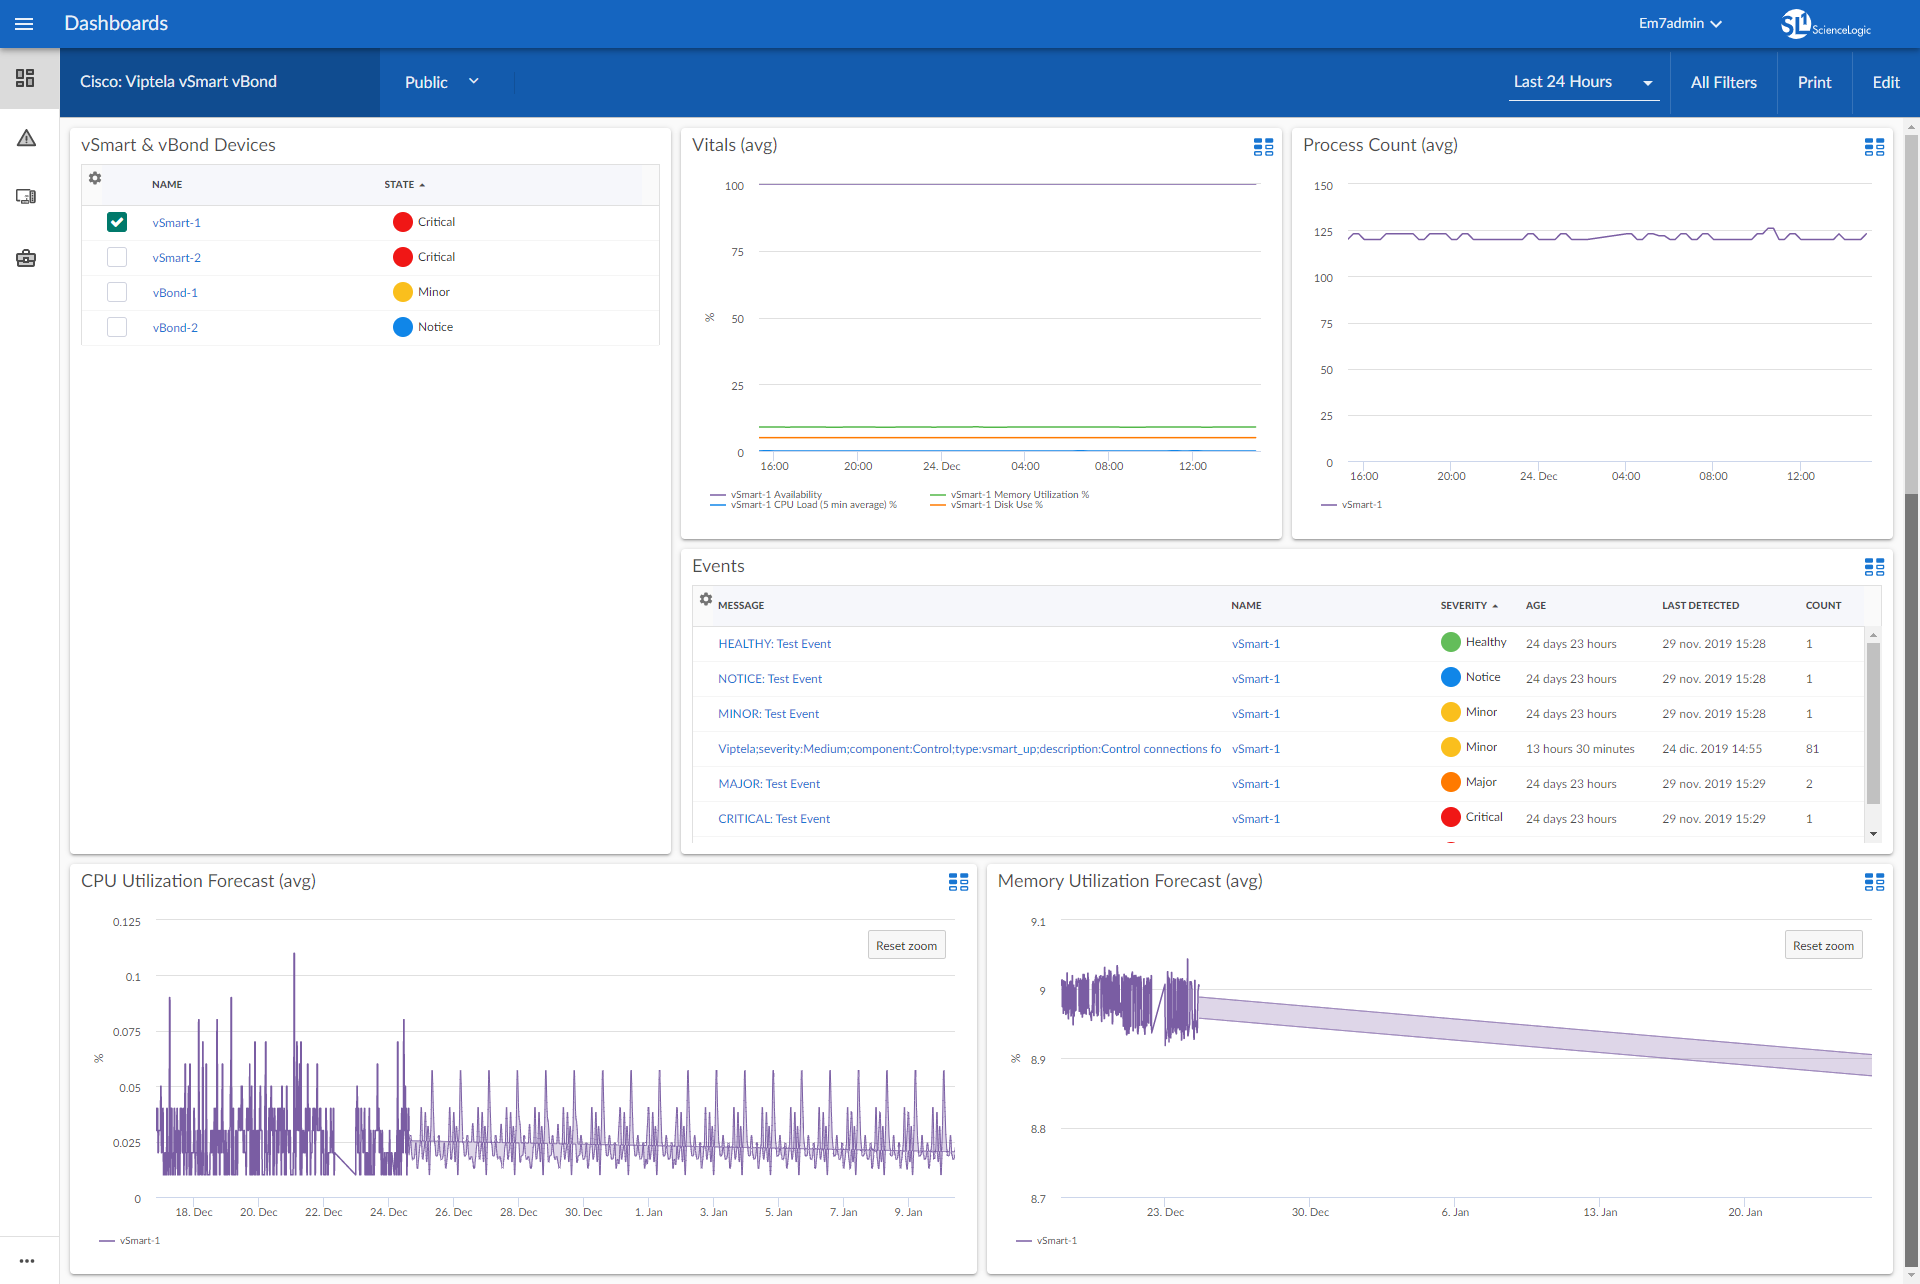
- A "Cisco: Viptela vSmart vBond" dashboard, which includes the following widgets that display data about your vSmart and vBond devices:
- vSmart and vBond Devices
- Vitals (avg)
- Process Count (avg)
- Events
- CPU Utilization Forecast (avg)
- Memory Utilization Forecast (avg)
Known Issues
Version 102 of the Cisco: Viptela SL1 Dashboards PowerPack has no known issues.