![]()
Version 105 of the F5 BIG-IP: SL1 Dashboards PowerPack includes Device Investigators that present graphical representations of the configuration data and performance metrics that are collected for a selected F5: BIG-IP device by the F5: BIG-IPPowerPack.
NOTE: These dashboards are intended for use only in the new SL1 user interface and will not load in the classic ScienceLogic platform user interface.
- Minimum Required SL1 Version: 10.2
- Minimum Required AP2 Version: 6.12.63
- Minimum Required Widget Components Version: 2.220.9
- Minimum Required F5 BIG-IP PowerPack Version: 103
Before You Install or Upgrade
Before installing F5 BIG-IP: SL1 Dashboards PowerPack version 105, you must first ensure that you are running version 10.2 or later of SL1.
NOTE: For details on upgrading SL1, see the appropriate Release Notes.
You must also import and install theF5 BIG-IP PowerPack version 103 or later before installing the PowerPack.
Installation or Upgrade Process
To install this PowerPack:
- Familiarize yourself with the Known Issues for this release.
- See the Before You Install or Upgrade section. If you have not done so already, upgrade your system to the 10.2 or later release.
- Download the "F5 BIG-IP: SL1 Dashboards" version 105PowerPack from the Support Site to a local computer.
- Go to the PowerPack Manager page (System > Manage > PowerPacks). Click the menu and choose Import PowerPack. When prompted, import "F5 BIG-IP: SL1 Dashboards" version 105.
- Click the button. For details on installing PowerPacks, see the chapter on Installing a PowerPack in the PowerPacks manual.
Features
The following dashboards are included in version 105 of the F5 BIG-IP: SL1 Dashboards PowerPack:
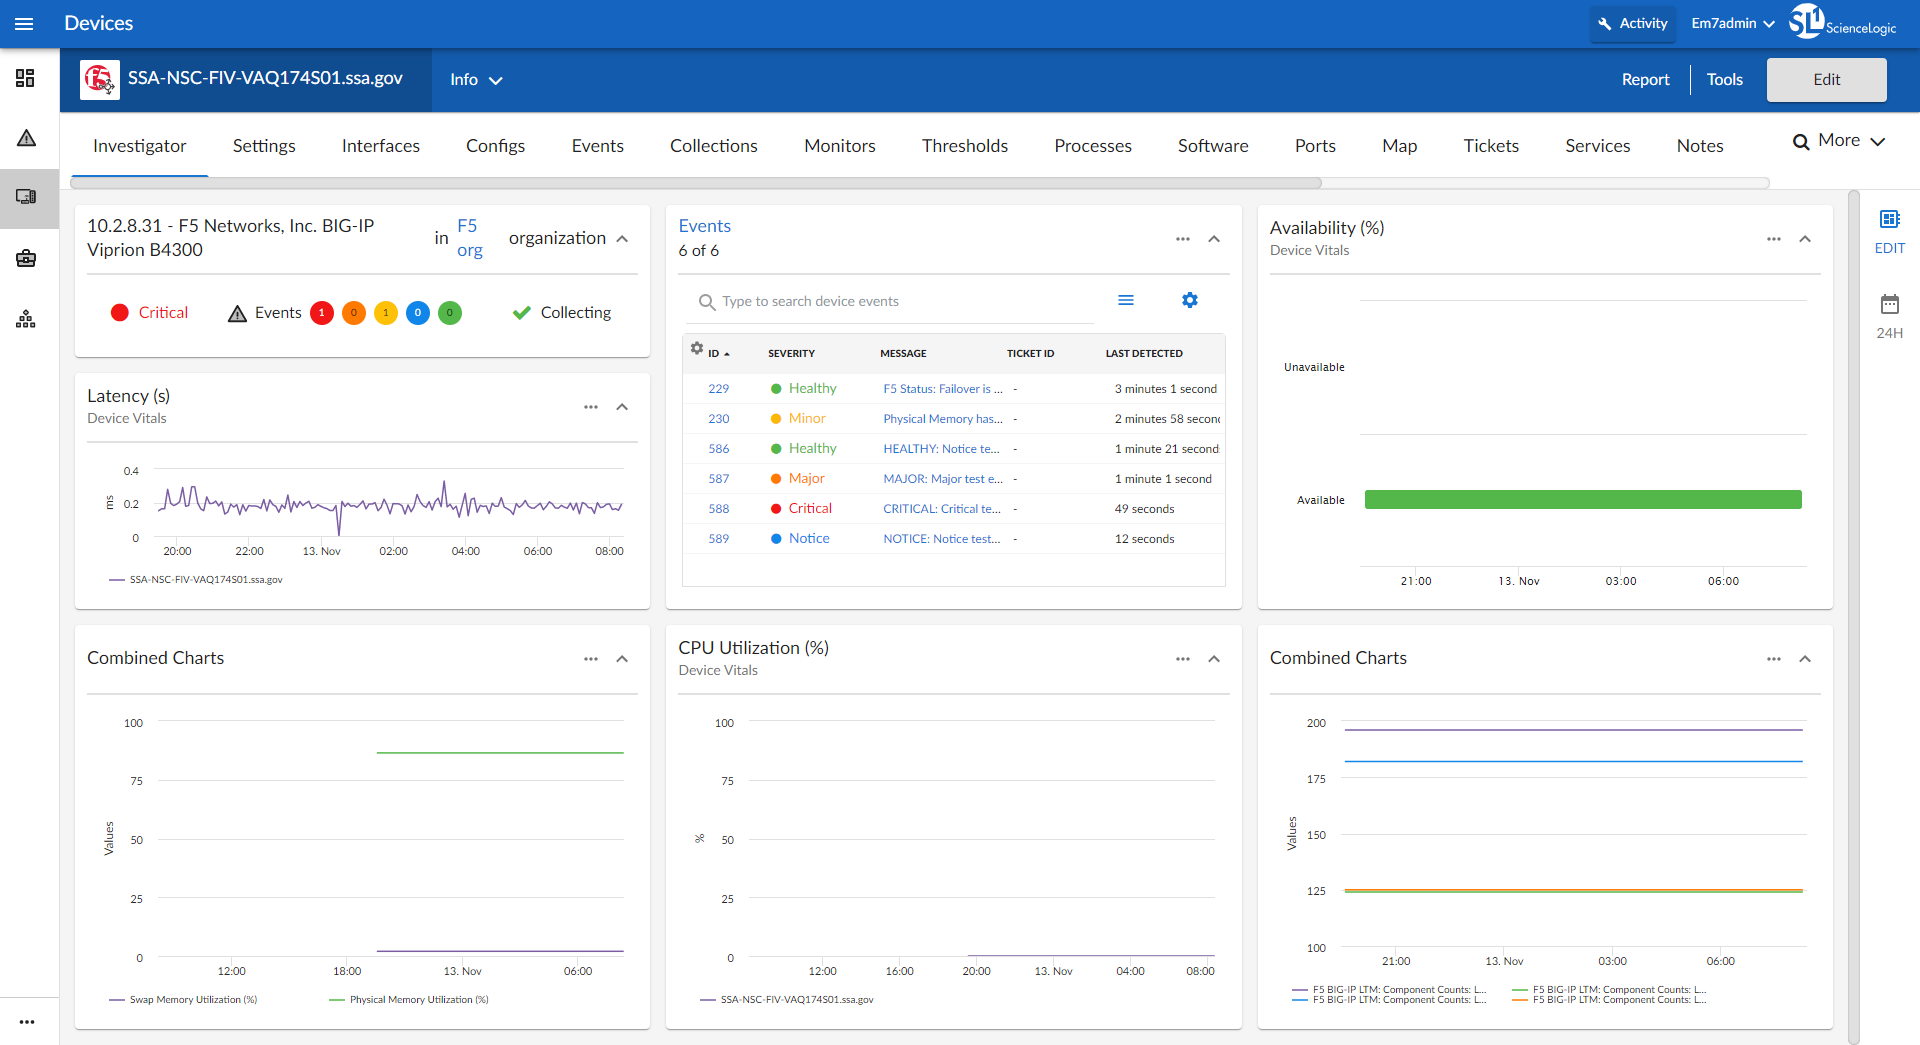
- An "F5: BIG-IP LTM Root Investigator" device investigator, which includes the following panels that display overview data about your selected F5 Big-IP LTM root:
- Overview
- Latency (s)
- Events
- Availability (%)
- Combined Charts
- Physical Memory Utilization
- Swap Memory Utilization
- CPU Utilization (%)
- Combined Charts
- F5 BIG-IP LTM: Component Counts: LTM Node Count
- F5 BIG-IP LTM: Component Counts: LTM Pool Count
- F5 BIG-IP LTM: Component Counts: LTM Virtual Server Count
- F5 BIG-IP LTM: Component Counts: LTM Pool Member Count
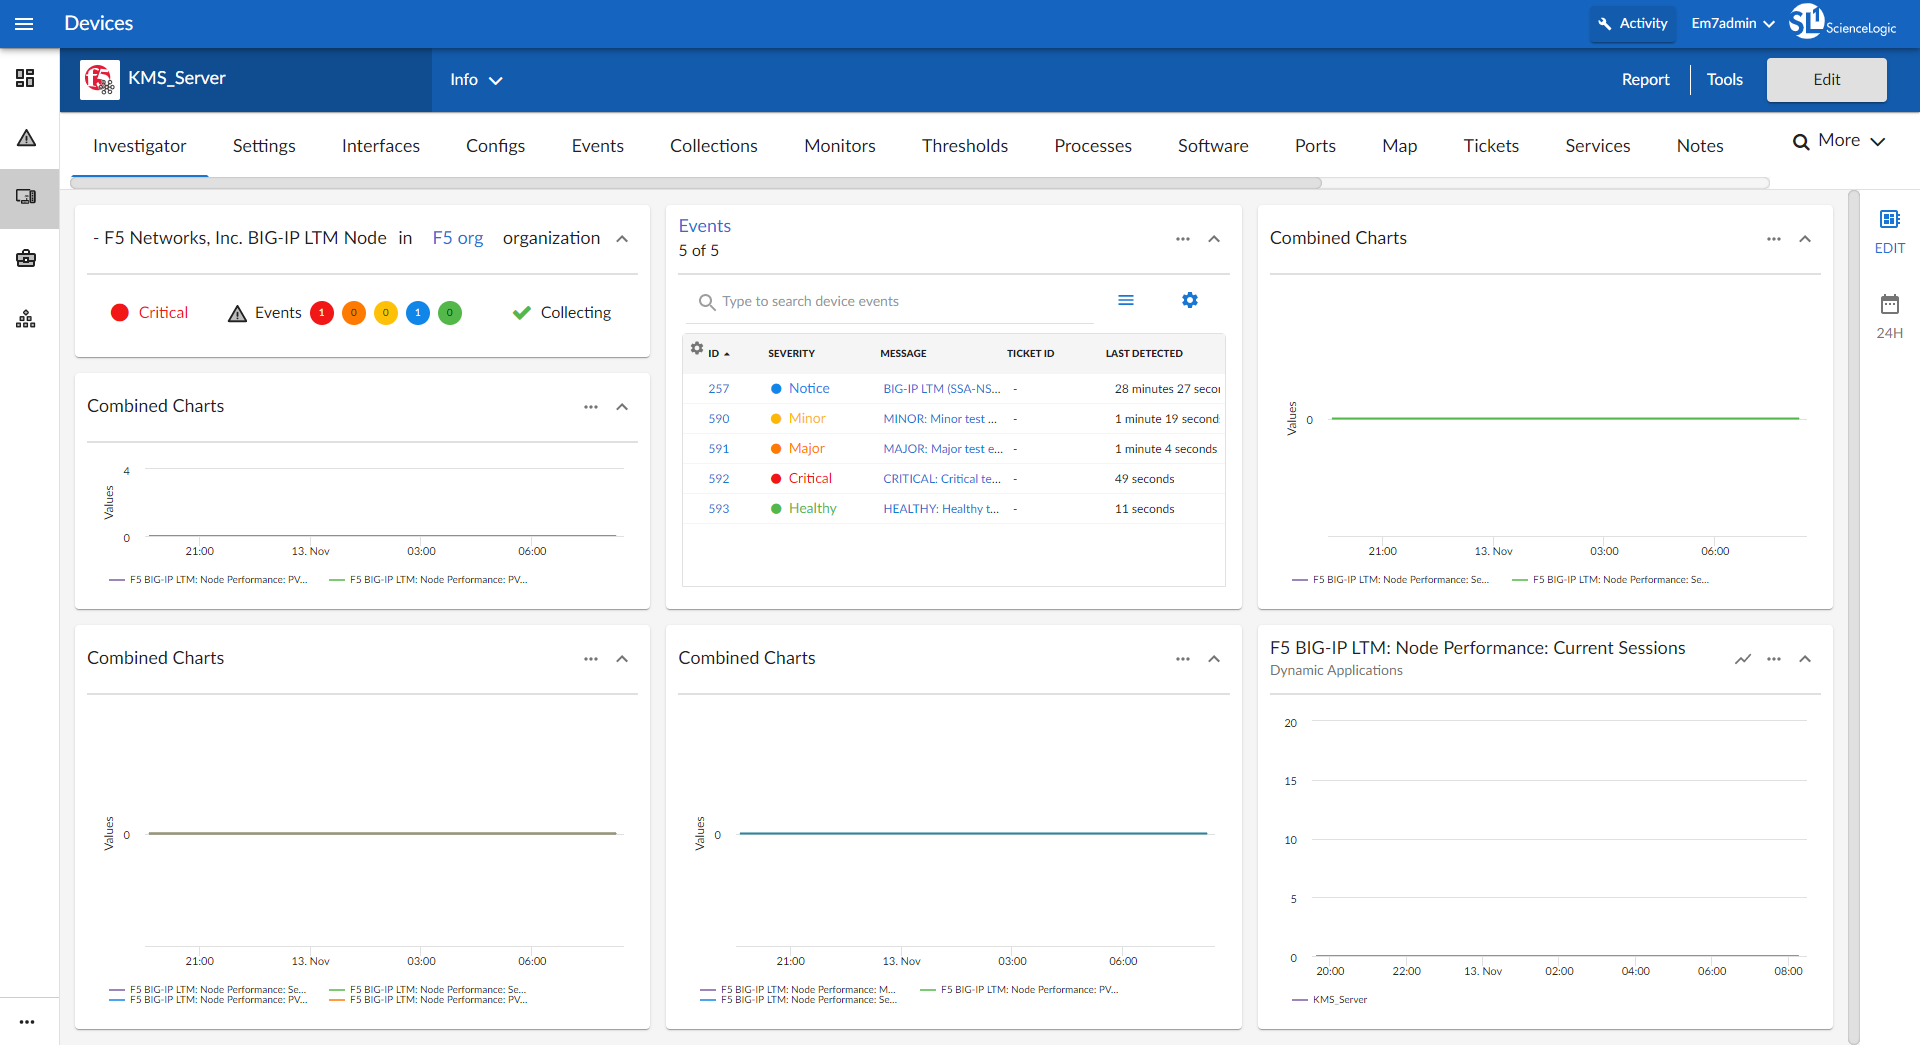
- An "F5: BIG-IP LTM Node Investigator" device investigator, which includes the following panels that display data about your selected F5 Big-IP node:
- Overview
- Combined Charts
- F5 BIG-IP LTM: Node Performance: Server Side Bytes Received
- F5 BIG-IP LTM: Node Performance: Server Side Bytes Sent
- Events
- Combined Charts
- F5 BIG-IP LTM: Node Performance: PVA Bytes Received
- F5 BIG-IP LTM: Node Performance: PVA Bytes Sent
- Combined Charts
- F5 BIG-IP LTM: Node Performance: Server Side Packets Received
- F5 BIG-IP LTM: Node Performance: Server Side Packets Sent
- F5 BIG-IP LTM: Node Performance: PVA Packets Received
- F5 BIG-IP LTM: Node Performance: PVA Packets Sent
- Combined Charts
- F5 BIG-IP LTM: Node Performance: Max Connections from Server Side
- F5 BIG-IP LTM: Node Performance: Server Side Current Connections
- F5 BIG-IP LTM: Node Performance: PVA Current Connections
- F5 BIG-IP LTM: Node Performance: Current Sessions
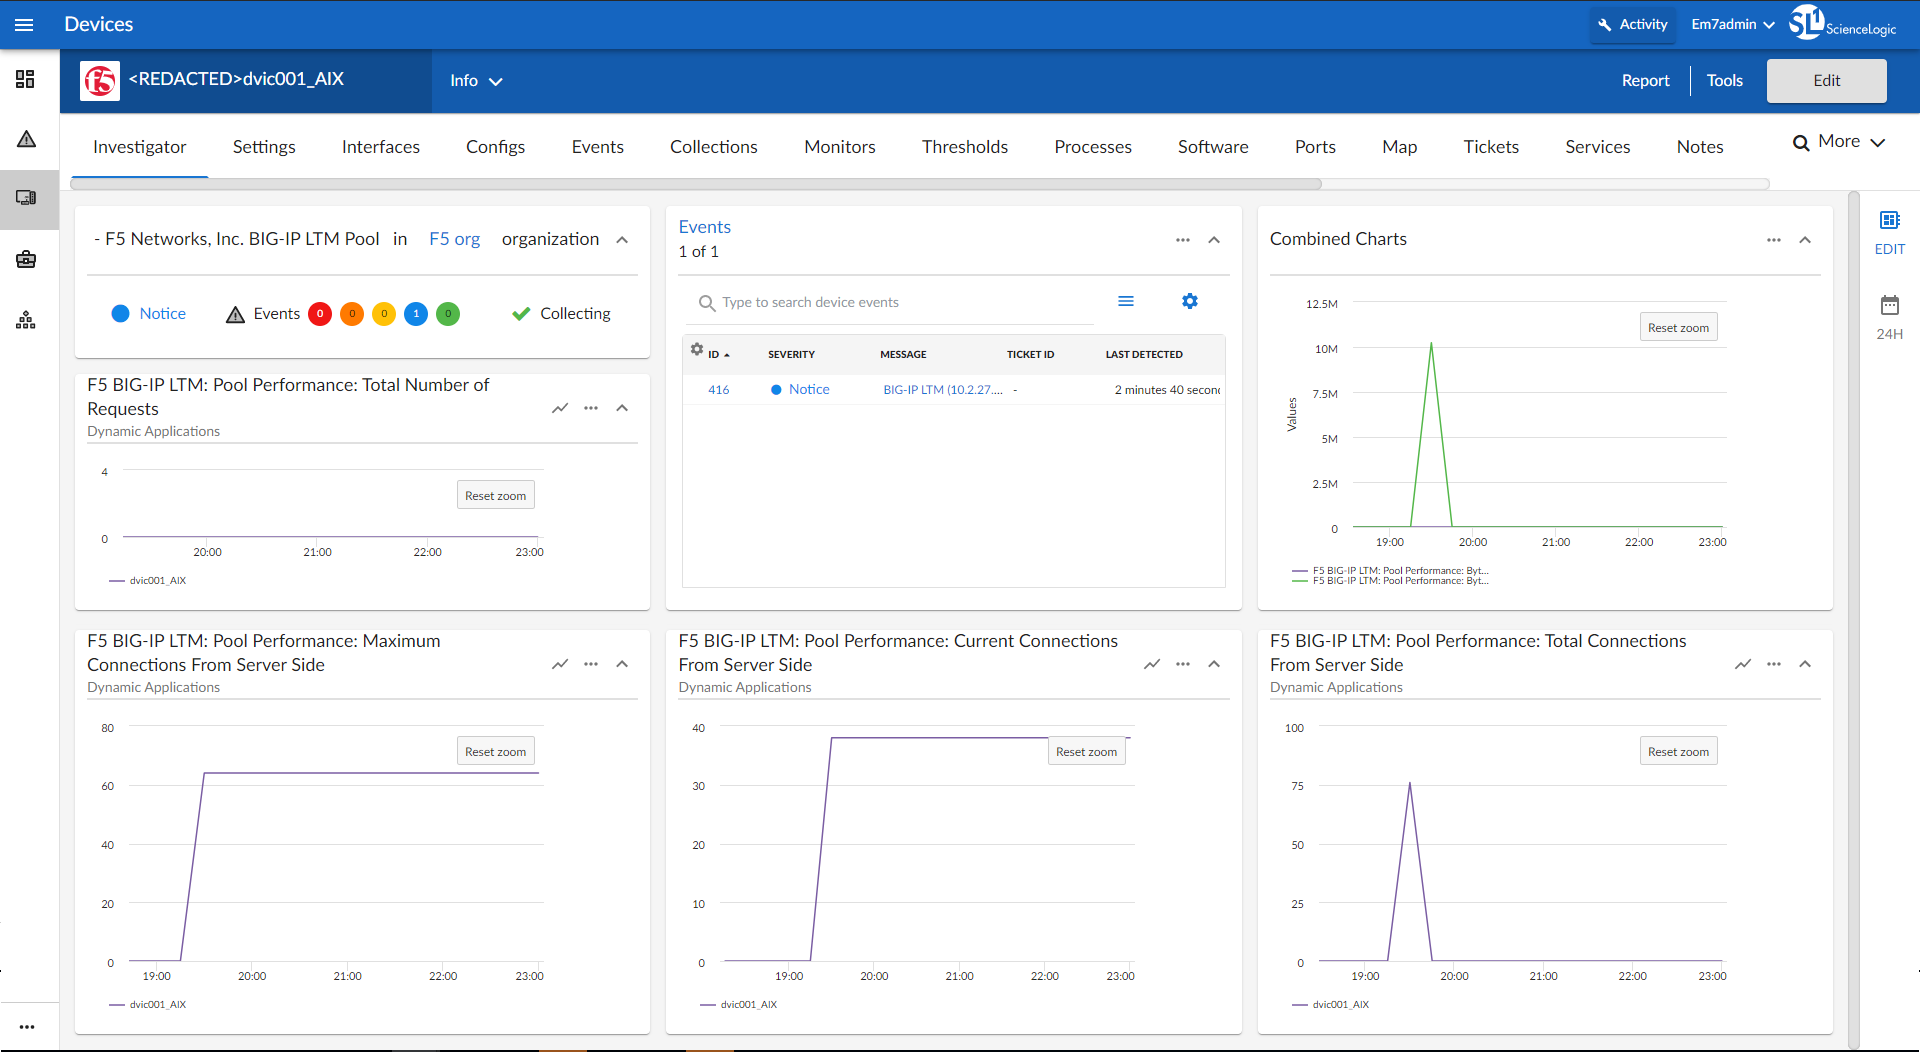
- An "F5: BIG-IP LTM Pool Investigator" device investigator, which includes the following panels that display data about your selected F5 Big-IP pool:
- Overview
- F5 BIG-IP LTM: Pool Performance: Total Number of Requests
- Events
- Combined Charts
- F5 BIG-IP LTM: Pool Performance: Bytes Received from Server Side
- F5 BIG-IP LTM: Pool Performance: Bytes Sent to Server Side
- F5 BIG-IP LTM: Pool Performance: Maximum Connections from Server Side
- F5 BIG-IP LTM: Pool Performance: Current Connections from Server Side
- F5 BIG-IP LTM: Pool Performance: Total Connections from Server Side
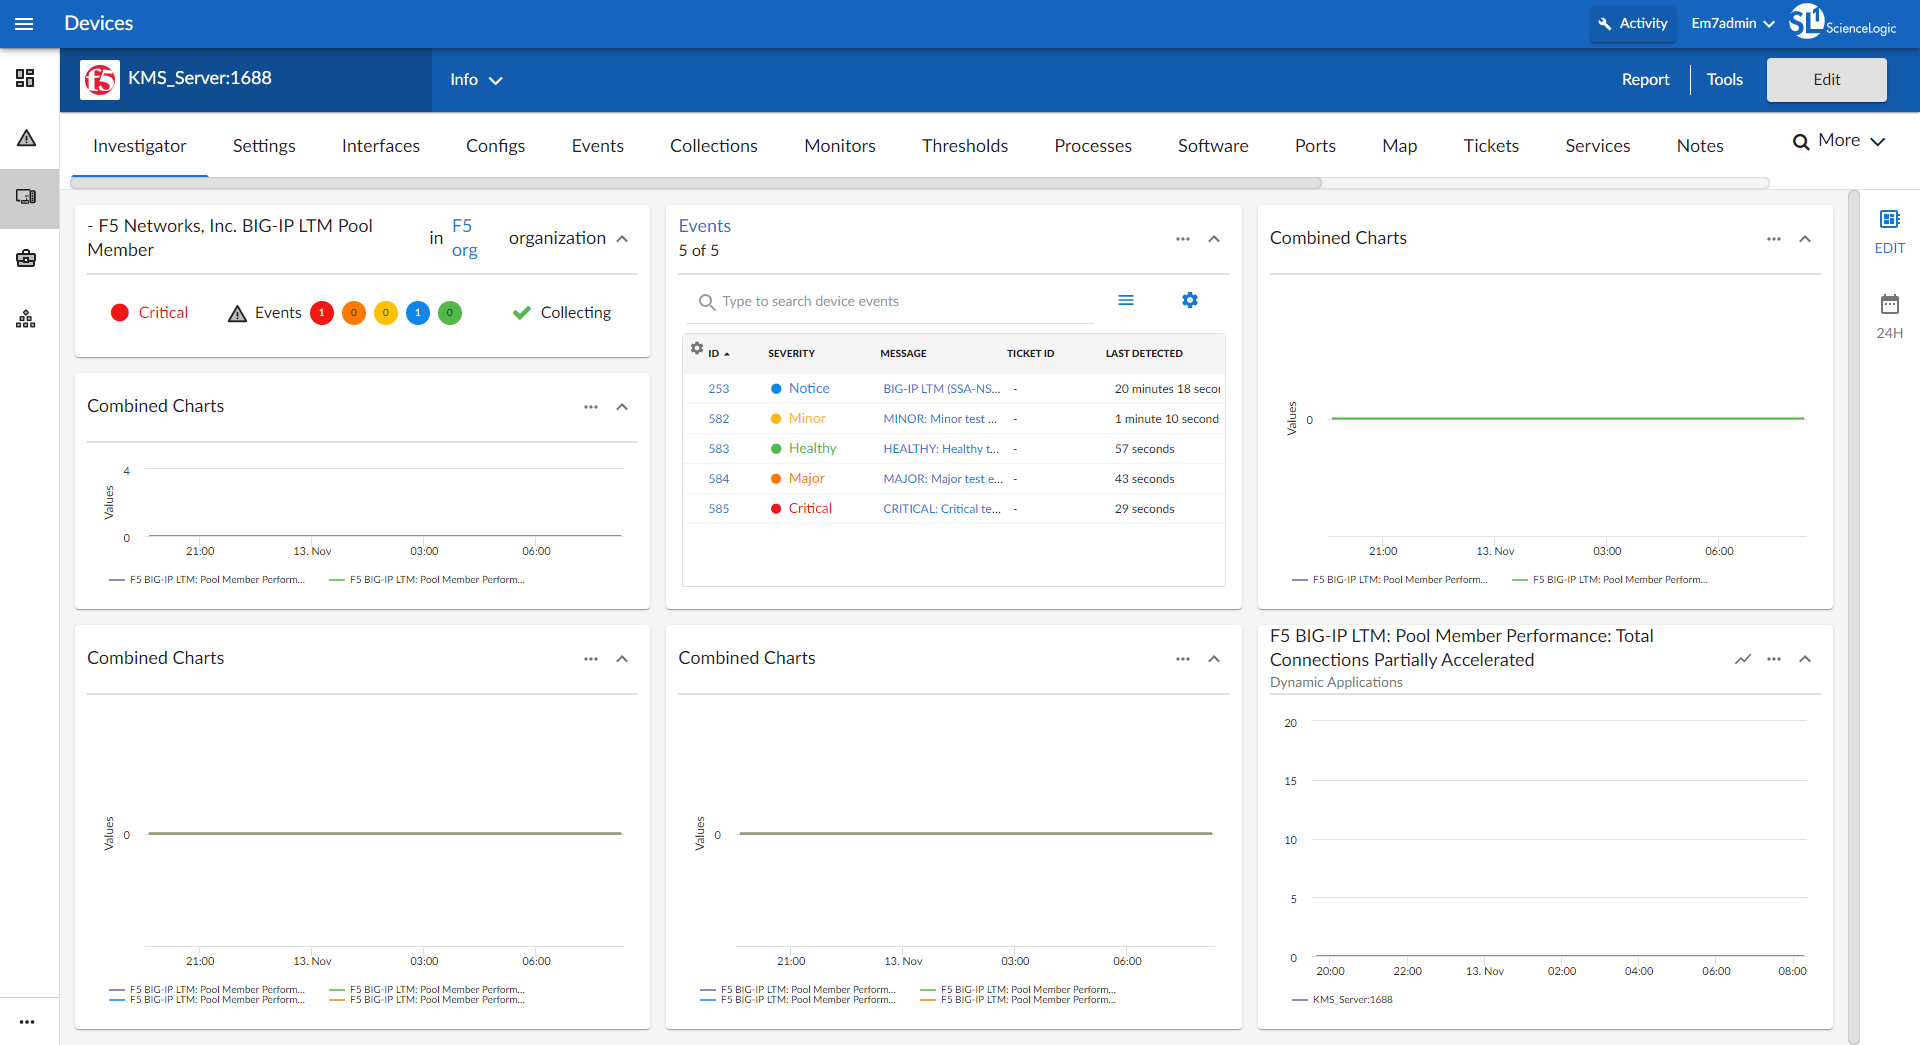
- An "F5: BIG-IP LTM Pool Member Investigator" device investigator, which includes the following panels that display data about your selected F5 Big-IP pool member:
- Overview
- Combined Charts:
- F5 BIG-IP LTM: Pool Member Performance: Server Side Bytes Received
- F5 BIG-IP LTM: Pool Member Performance: Server Side Bytes Sent
- Events
- Combined Charts
- F5 BIG-IP LTM: Pool Member Performance: PVA Bytes Sent
- F5 BIG-IP LTM: Pool Member Performance: PVA Bytes Received
- Combined Charts
- F5 BIG-IP LTM: Pool Member Performance: Server Side Packets Sent
- F5 BIG-IP LTM: Pool Member Performance: Server Side Packets Received
- F5 BIG-IP LTM: Pool Member Performance: PVA Packets Sent
- F5 BIG-IP LTM: Pool Member Performance: PVA Packets Received
- Combined Charts
- F5 BIG-IP LTM: Pool Member Performance: PVA Total Connections
- F5 BIG-IP LTM: Pool Member Performance: PVA Current Connections
- F5 BIG-IP LTM: Pool Member Performance: Server Side Total Connections
- F5 BIG-IP LTM: Pool Member Performance: Server Side Current Connections
- F5 BIG-IP LTM: Pool Member Performance: Total Connections Partially Accelerated
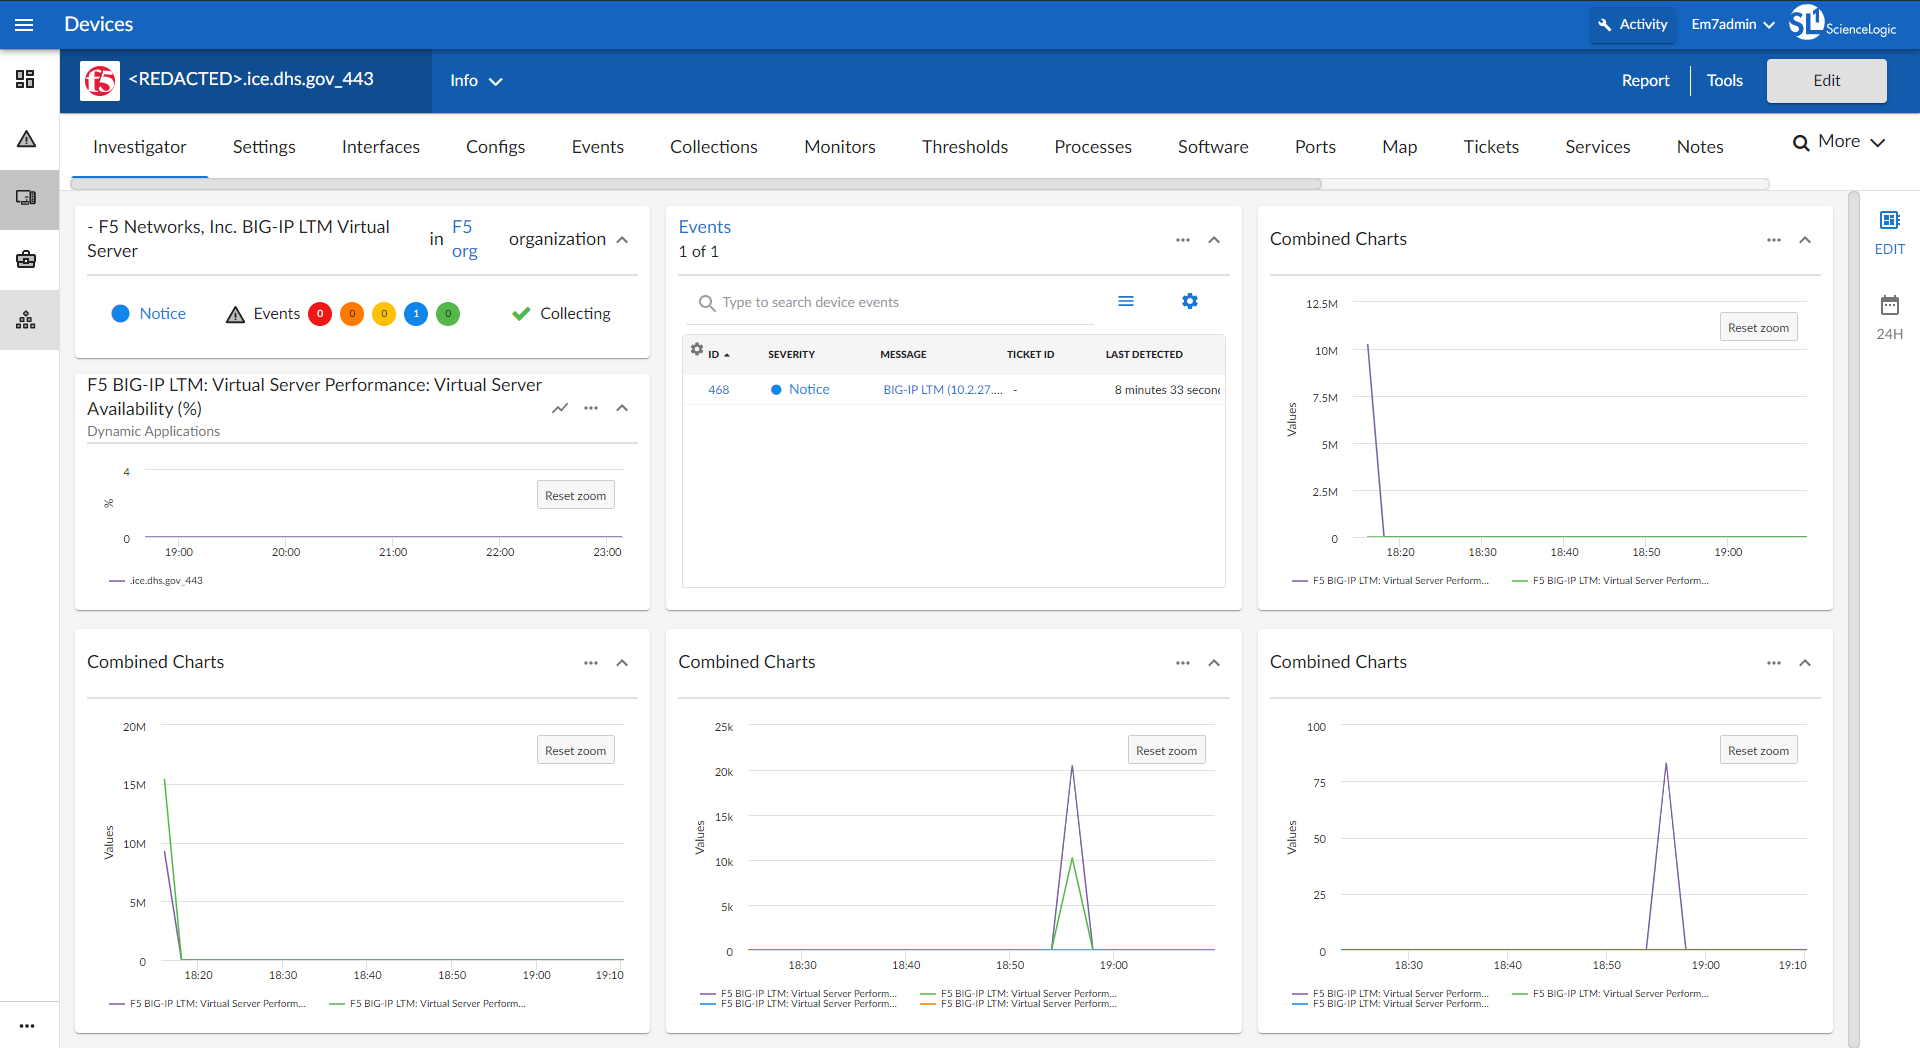
- An "F5: BIG-IP LTM Virtual Server Investigator" device investigator, which includes the following panels that display data about your selected F5 Big-IP server:
- Overview
- F5 BIG-IP LTM: Virtual Server Performance: Virtual Server Availability (%)
- Events
- Combined Charts:
- F5 BIG-IP LTM: Virtual Server Performance: Bytes Received from Client Side
- F5 BIG-IP LTM: Virtual Server Performance: Bytes Sent to Client
- Combined Charts:
- F5 BIG-IP LTM: Virtual Server Performance: Total Bytes Sent
- F5 BIG-IP LTM: Virtual Server Performance: Total Bytes Received
- Combined Charts:
- F5 BIG-IP LTM: Virtual Server Performance: Packets Sent to Client
- F5 BIG-IP LTM: Virtual Server Performance: Packets Received from Client Side
- F5 BIG-IP LTM: Virtual Server Performance: Ephemeral Packets Received by Virtual Server
- F5 BIG-IP LTM: Virtual Server Performance: Ephemeral Packets Transmitted for Virtual Server
- Combined Charts:
- F5 BIG-IP LTM: Virtual Server Performance: Current Connections from Client Side
- F5 BIG-IP LTM: Virtual Server Performance: Connections from Client Side
- F5 BIG-IP LTM: Virtual Server Performance: Ephemeral Bytes Received for Virtual Server
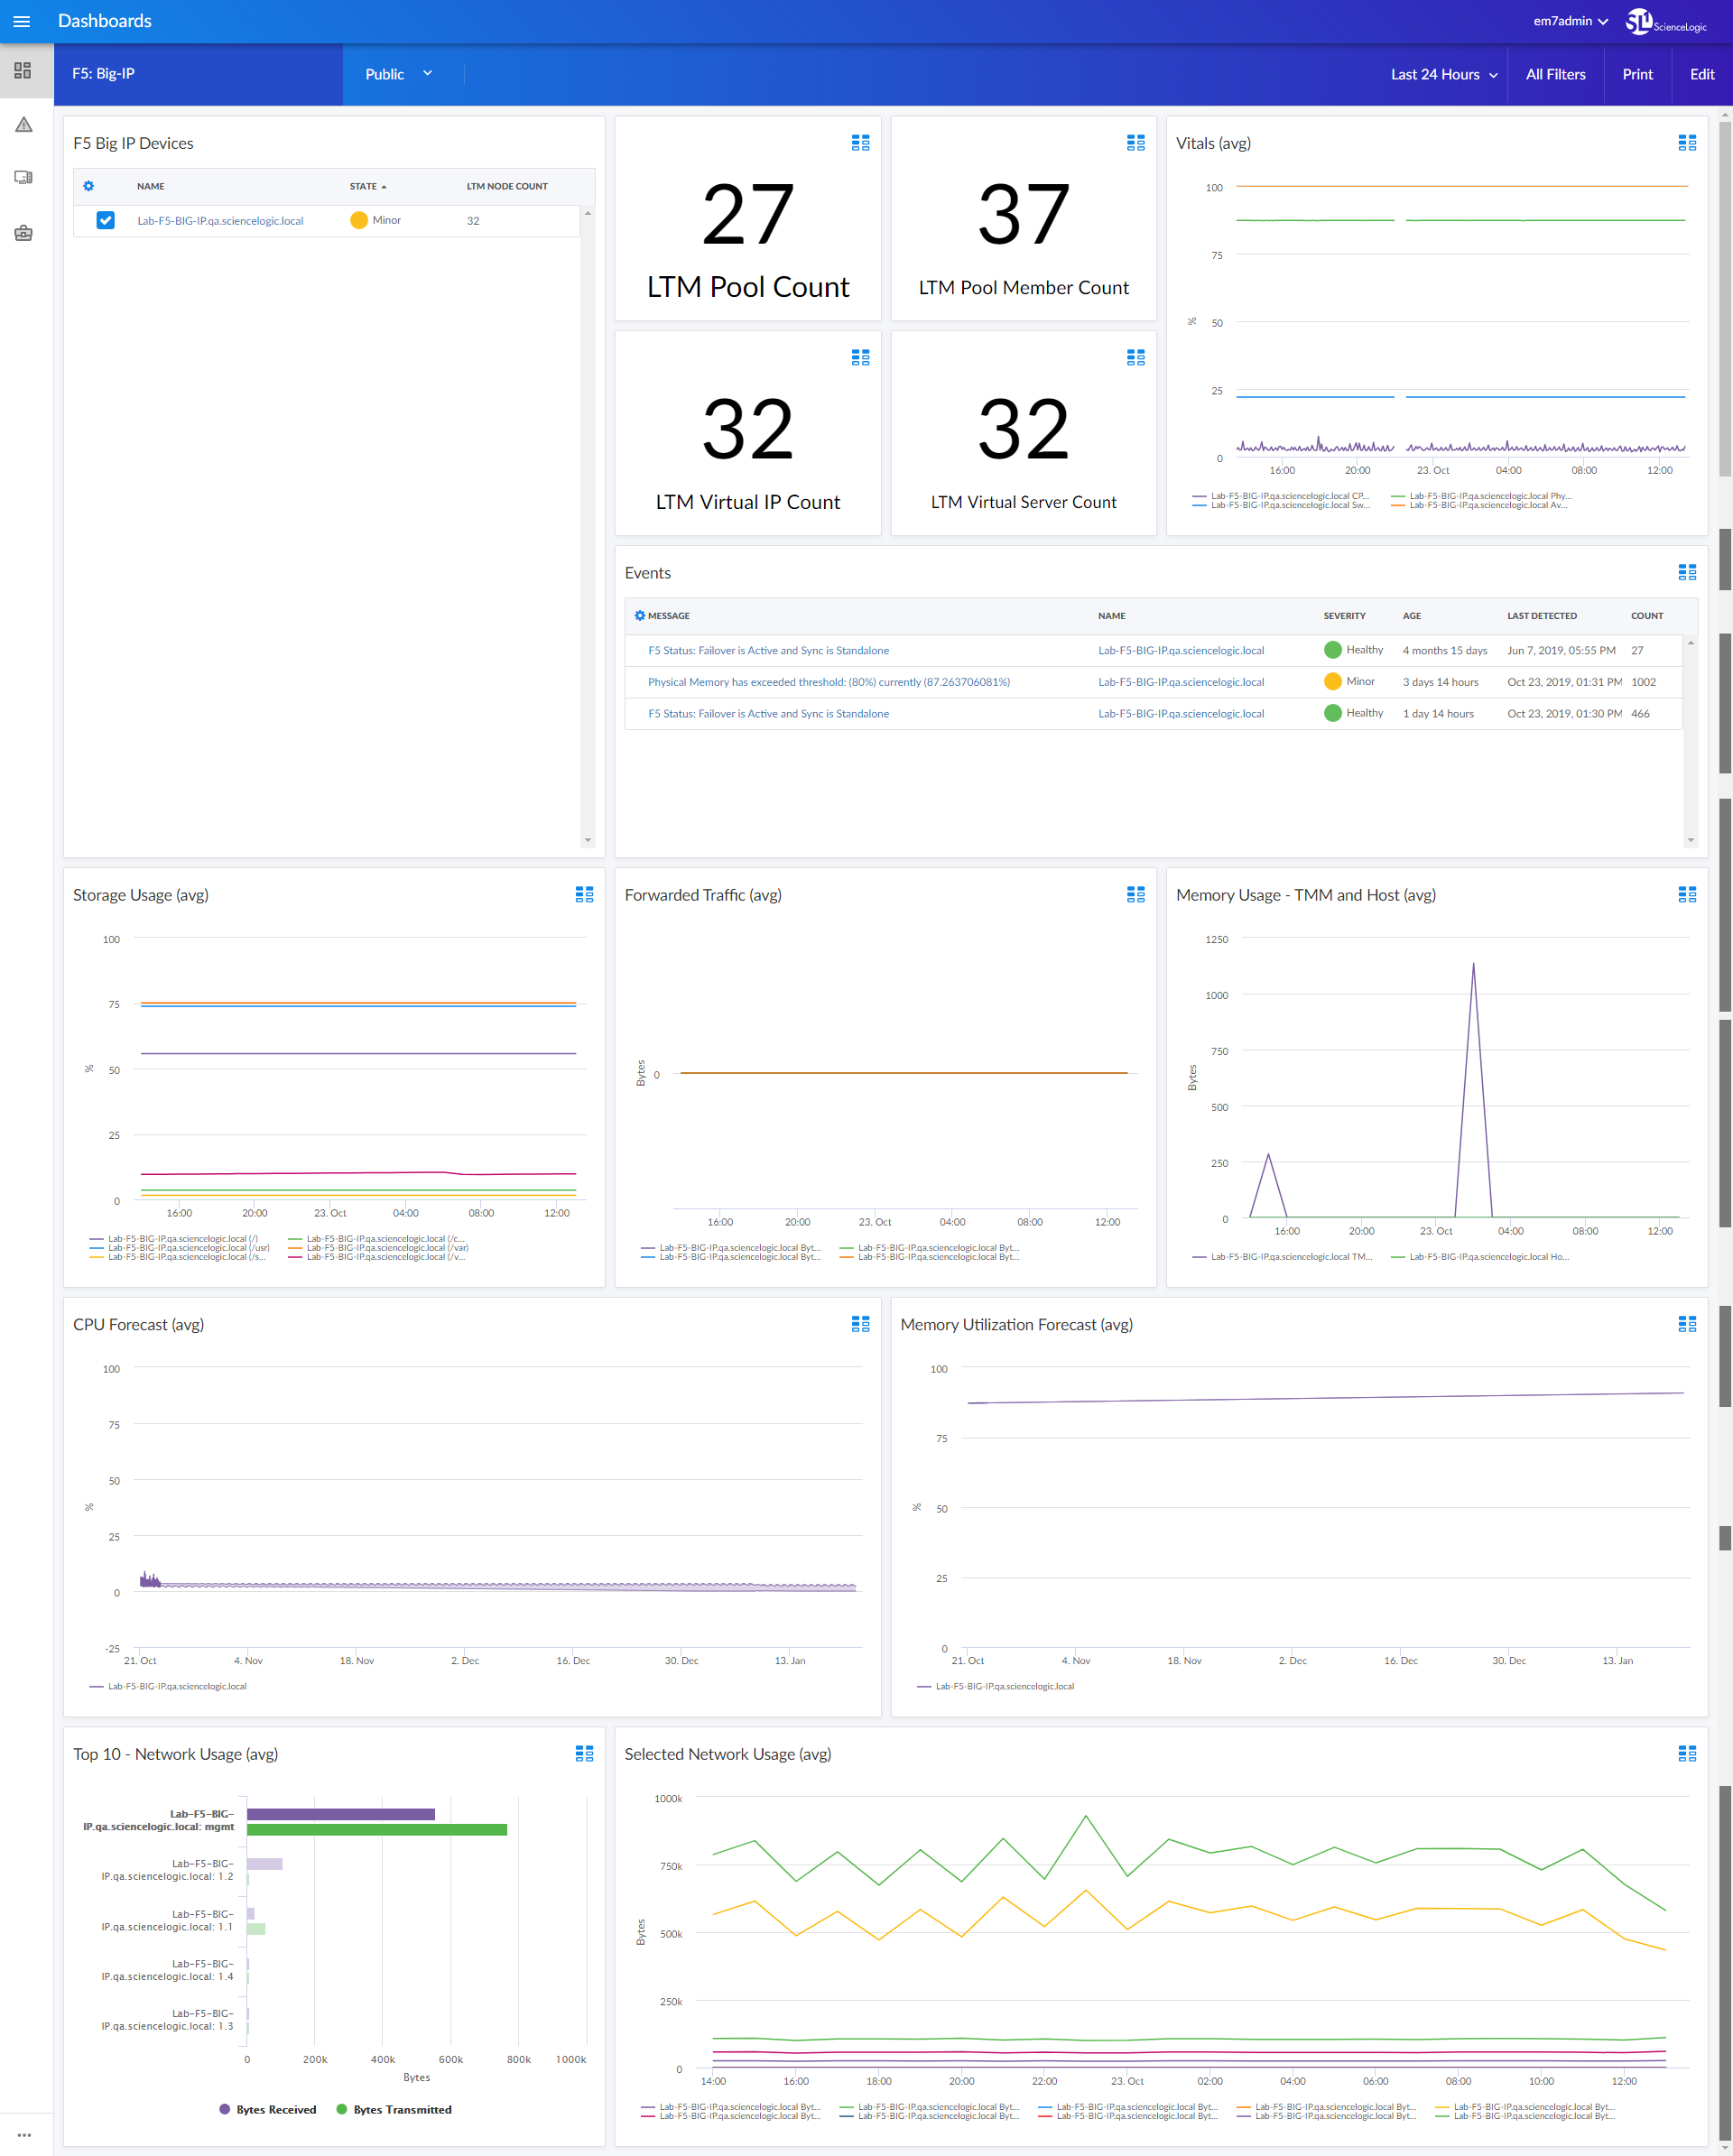
- An "F5 Big-IP" dashboard, which includes the following widgets that display overview data about your F5 Big-IP devices:
- F5 Big IP Devices
- LTM Pool Count
- LTM Pool Member Count
- LTM Virtual IP Count
- LTM Virtual Server Count
- Vitals (avg)
- Events
- Storage Usage (avg)
- Forwarded Traffic (avg)
- Memory Usage - TMM and Host (avg)
- CPU Forecast (avg)
- Memory Utilization Forecast (avg)
- Top 10 - Network Usage (avg)
- Selected Network Usage (avg)
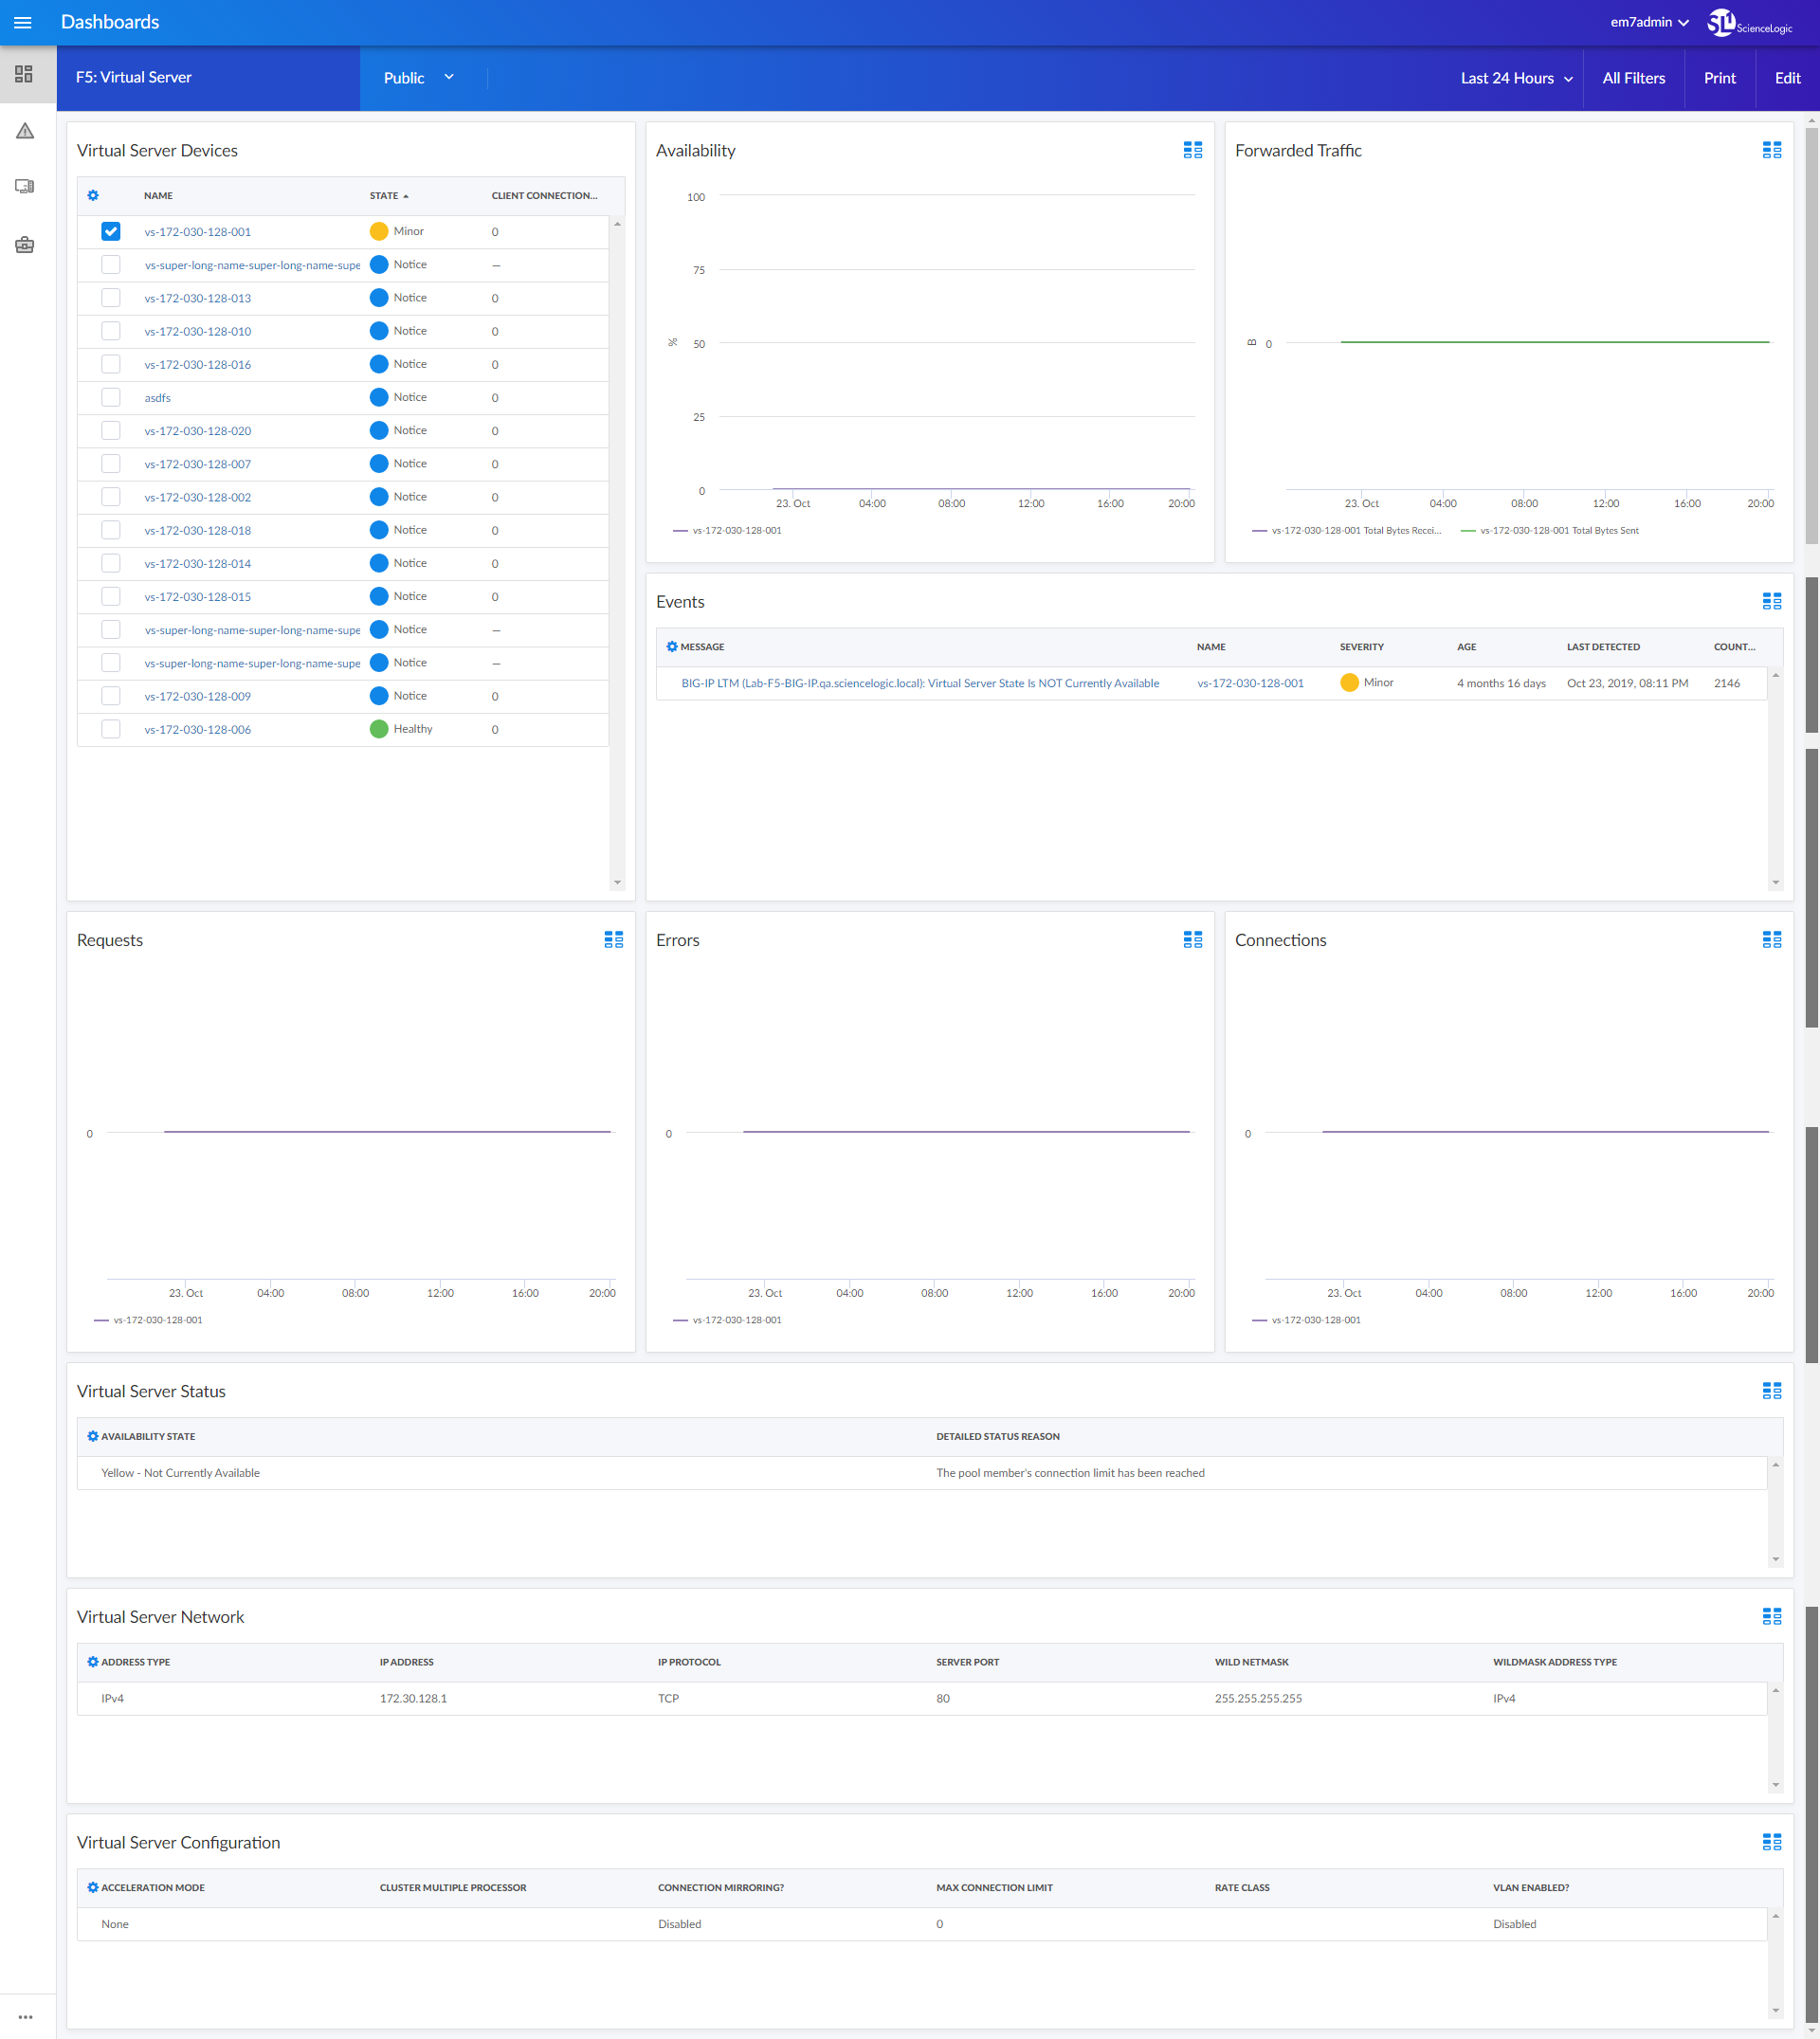
- An "F5: Virtual Server" dashboard, which includes the following widgets that display data about your F5 Big-IP virtual servers:
- Virtual Server Devices
- Availability
- Forwarded Traffic
- Events
- Requests
- Errors
- Connections
- Virtual Server Status
- Virtual Server Network
- Virtual Server Configuration
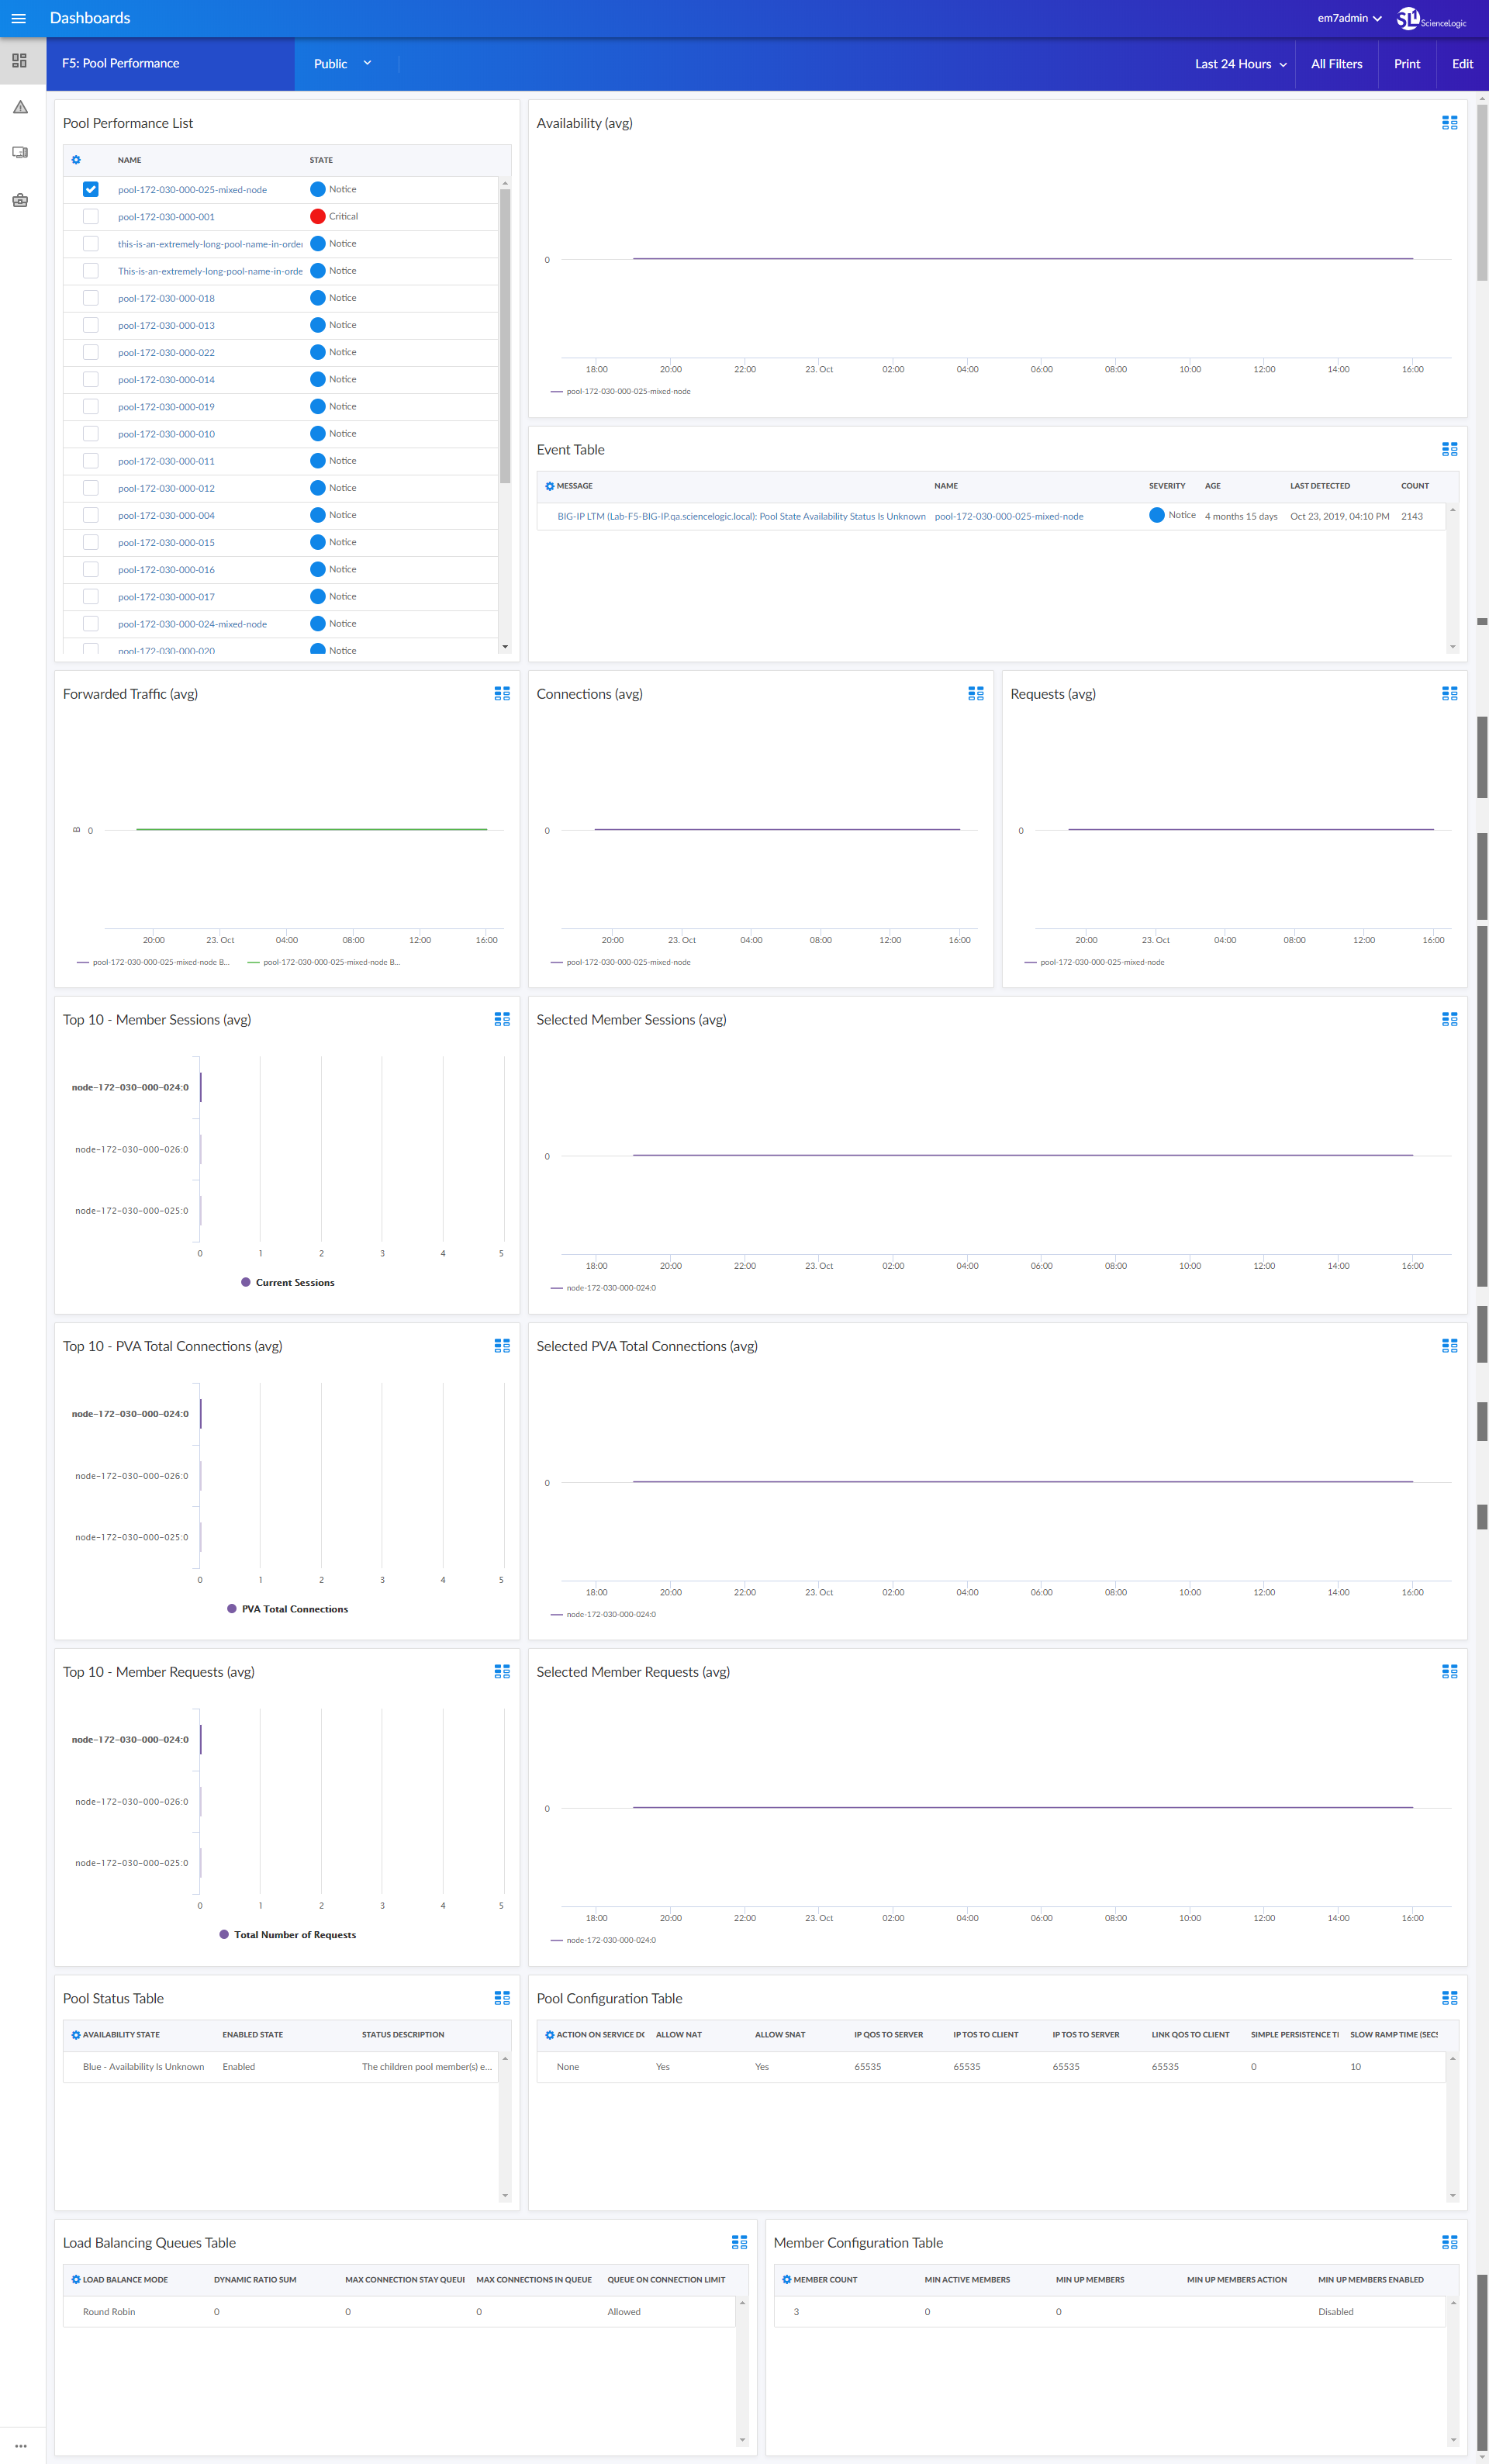
- An "F5: Pool Performance" dashboard, which includes the following widgets that display data about your F5 Big-IP pools:
- Pool Performance List
- Availability (avg)
- Event Table
- Forwarded Traffic (avg)
- Connections (avg)
- Requests (avg)
- Top 10 - Member Sessions (avg)
- Selected Member Sessions (avg)
- Top 10 - PVA Total Connections (avg)
- Selected PVA Total Connections (avg)
- Top 10 - Member Requests (avg)
- Selected Member Requests (avg)
- Pool Status Table
- Pool Configuration Table
- Load Balancing Queues Table
- Member Configuration Table
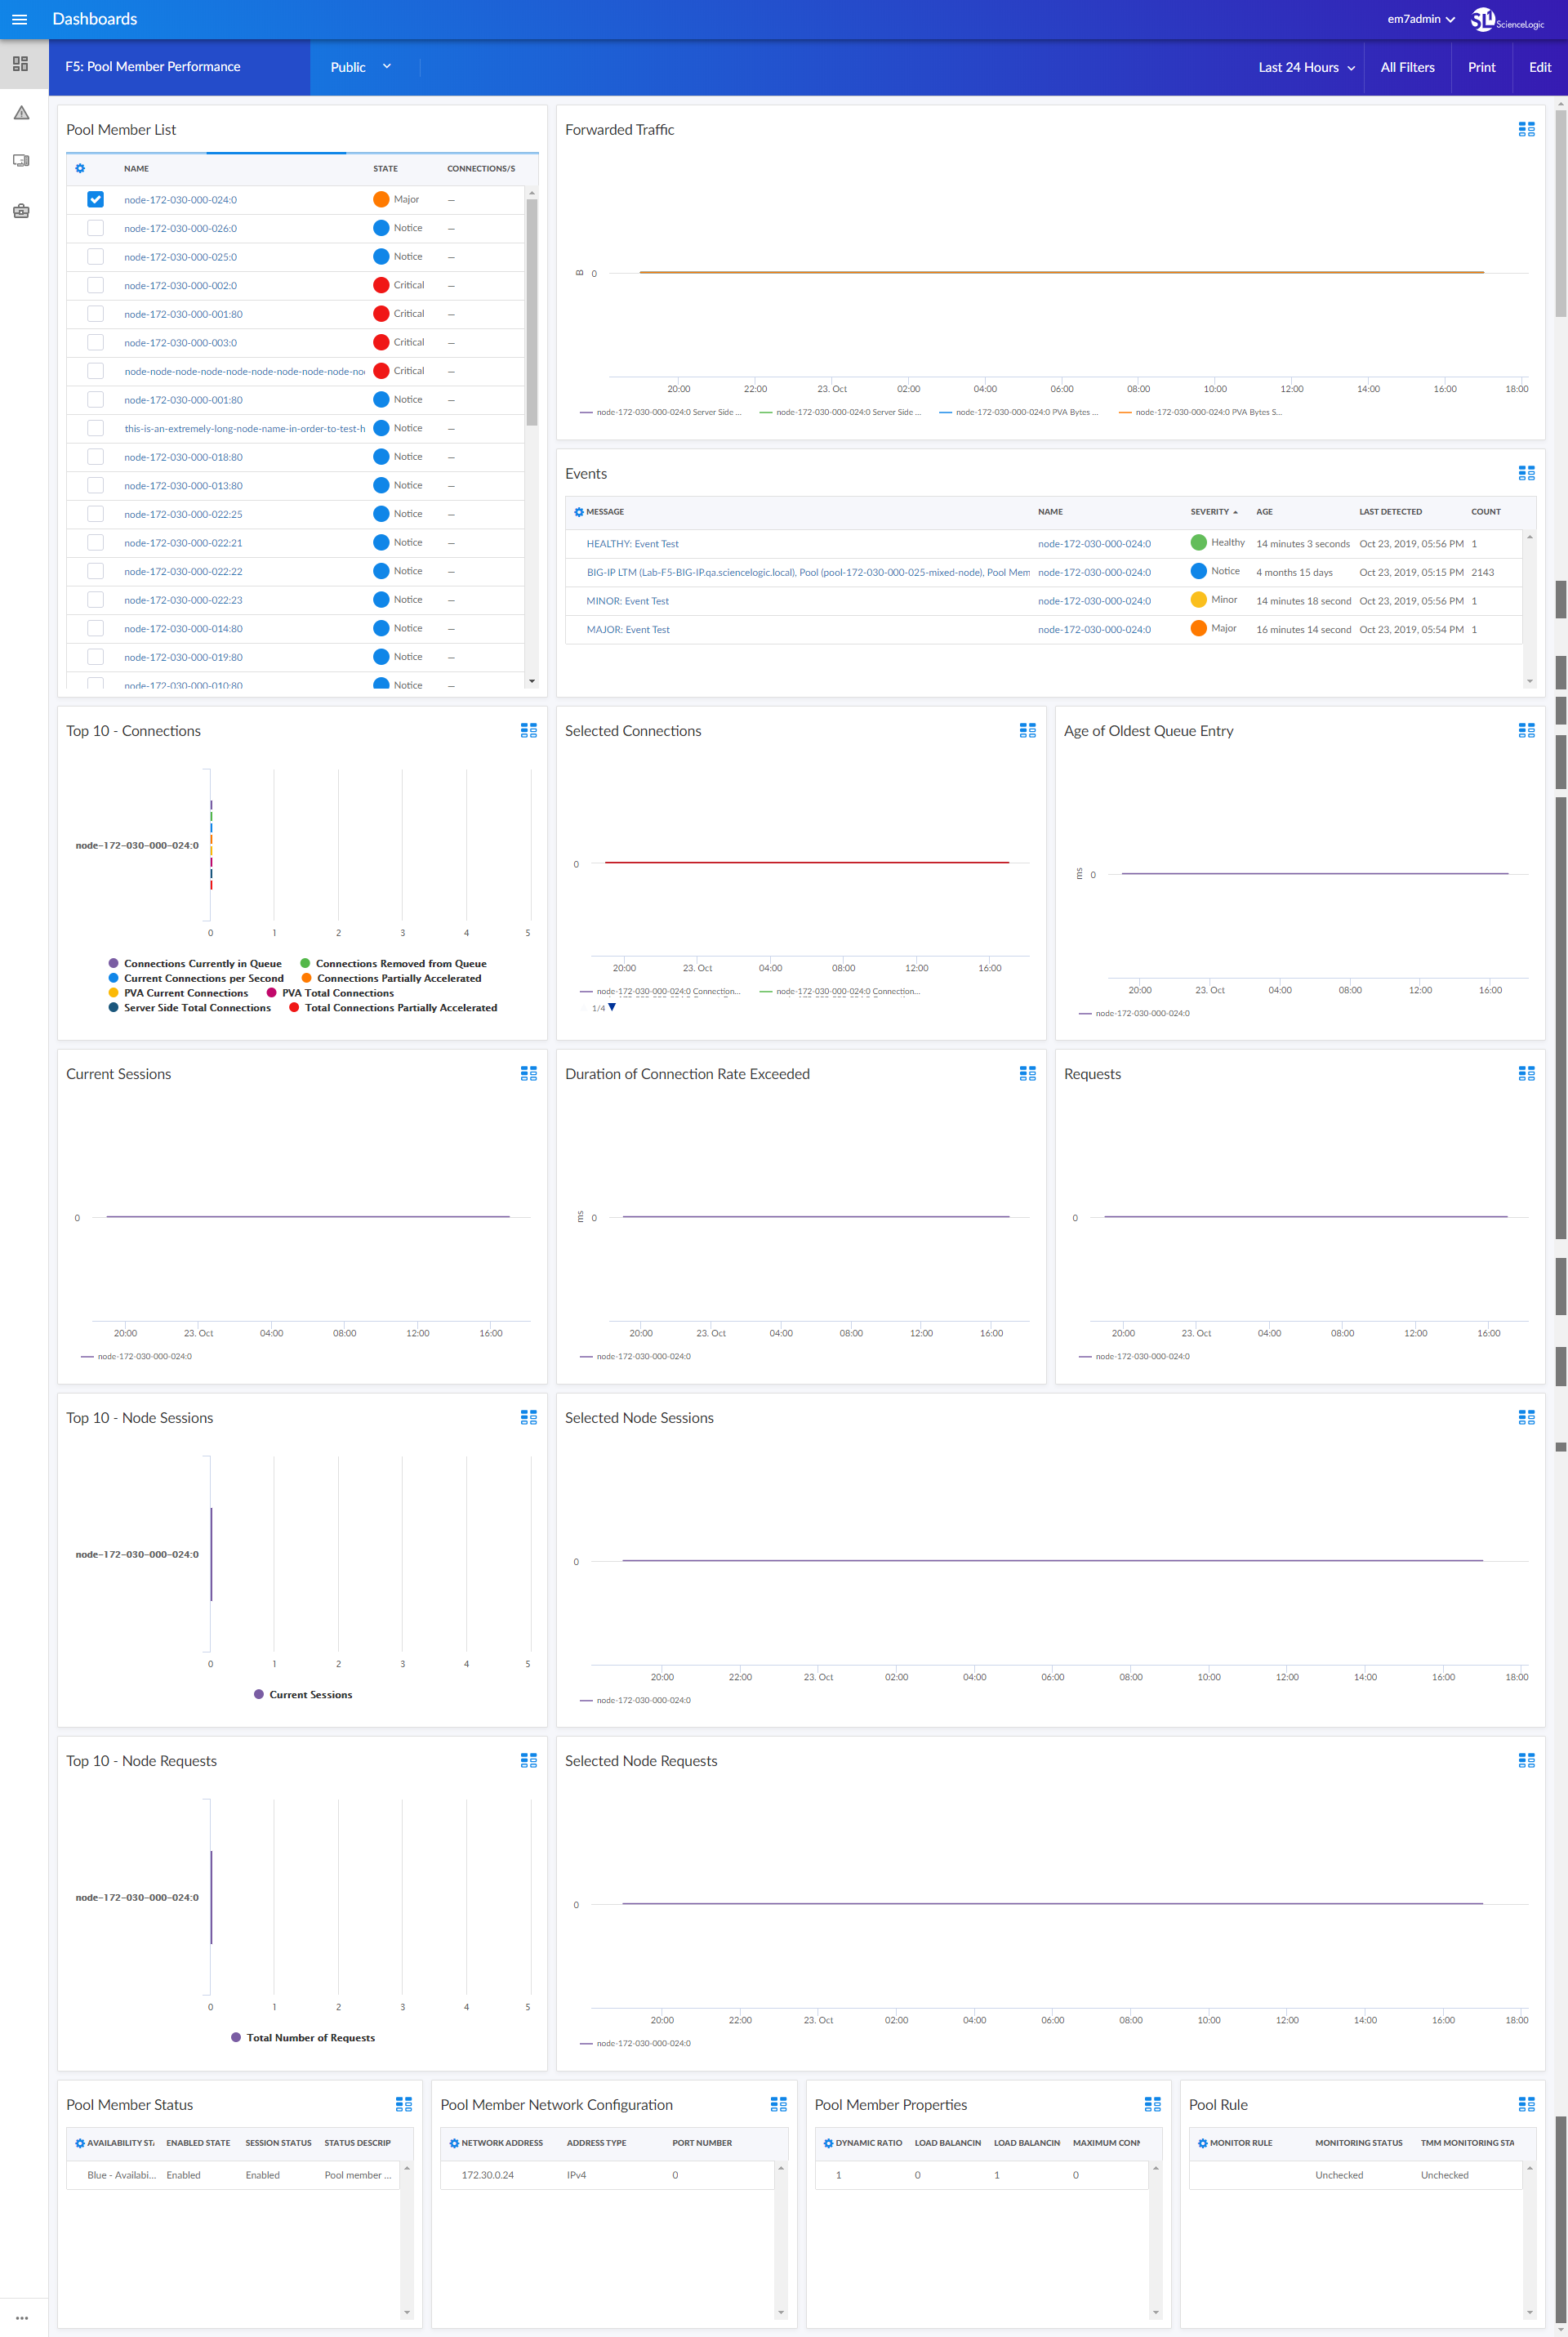
- An "F5: Pool Member Performance" dashboard, which includes the following widgets that display data about your F5 Big-IP pool members:
- Pool Member List
- Forwarded Traffic
- Events
- Top 10 - Connections
- Selected Connections
- Age of Oldest Queue Entry
- Current Sessions
- Duration of Connection Rate Exceeded
- Requests
- Top 10 - Node Sessions
- Selected Node Sessions
- Top 10 - Node Requests
- Selected Node Requests
- Pool Member Status
- Pool Member Network Configuration
- Pool Member Properties
- Pool Rule
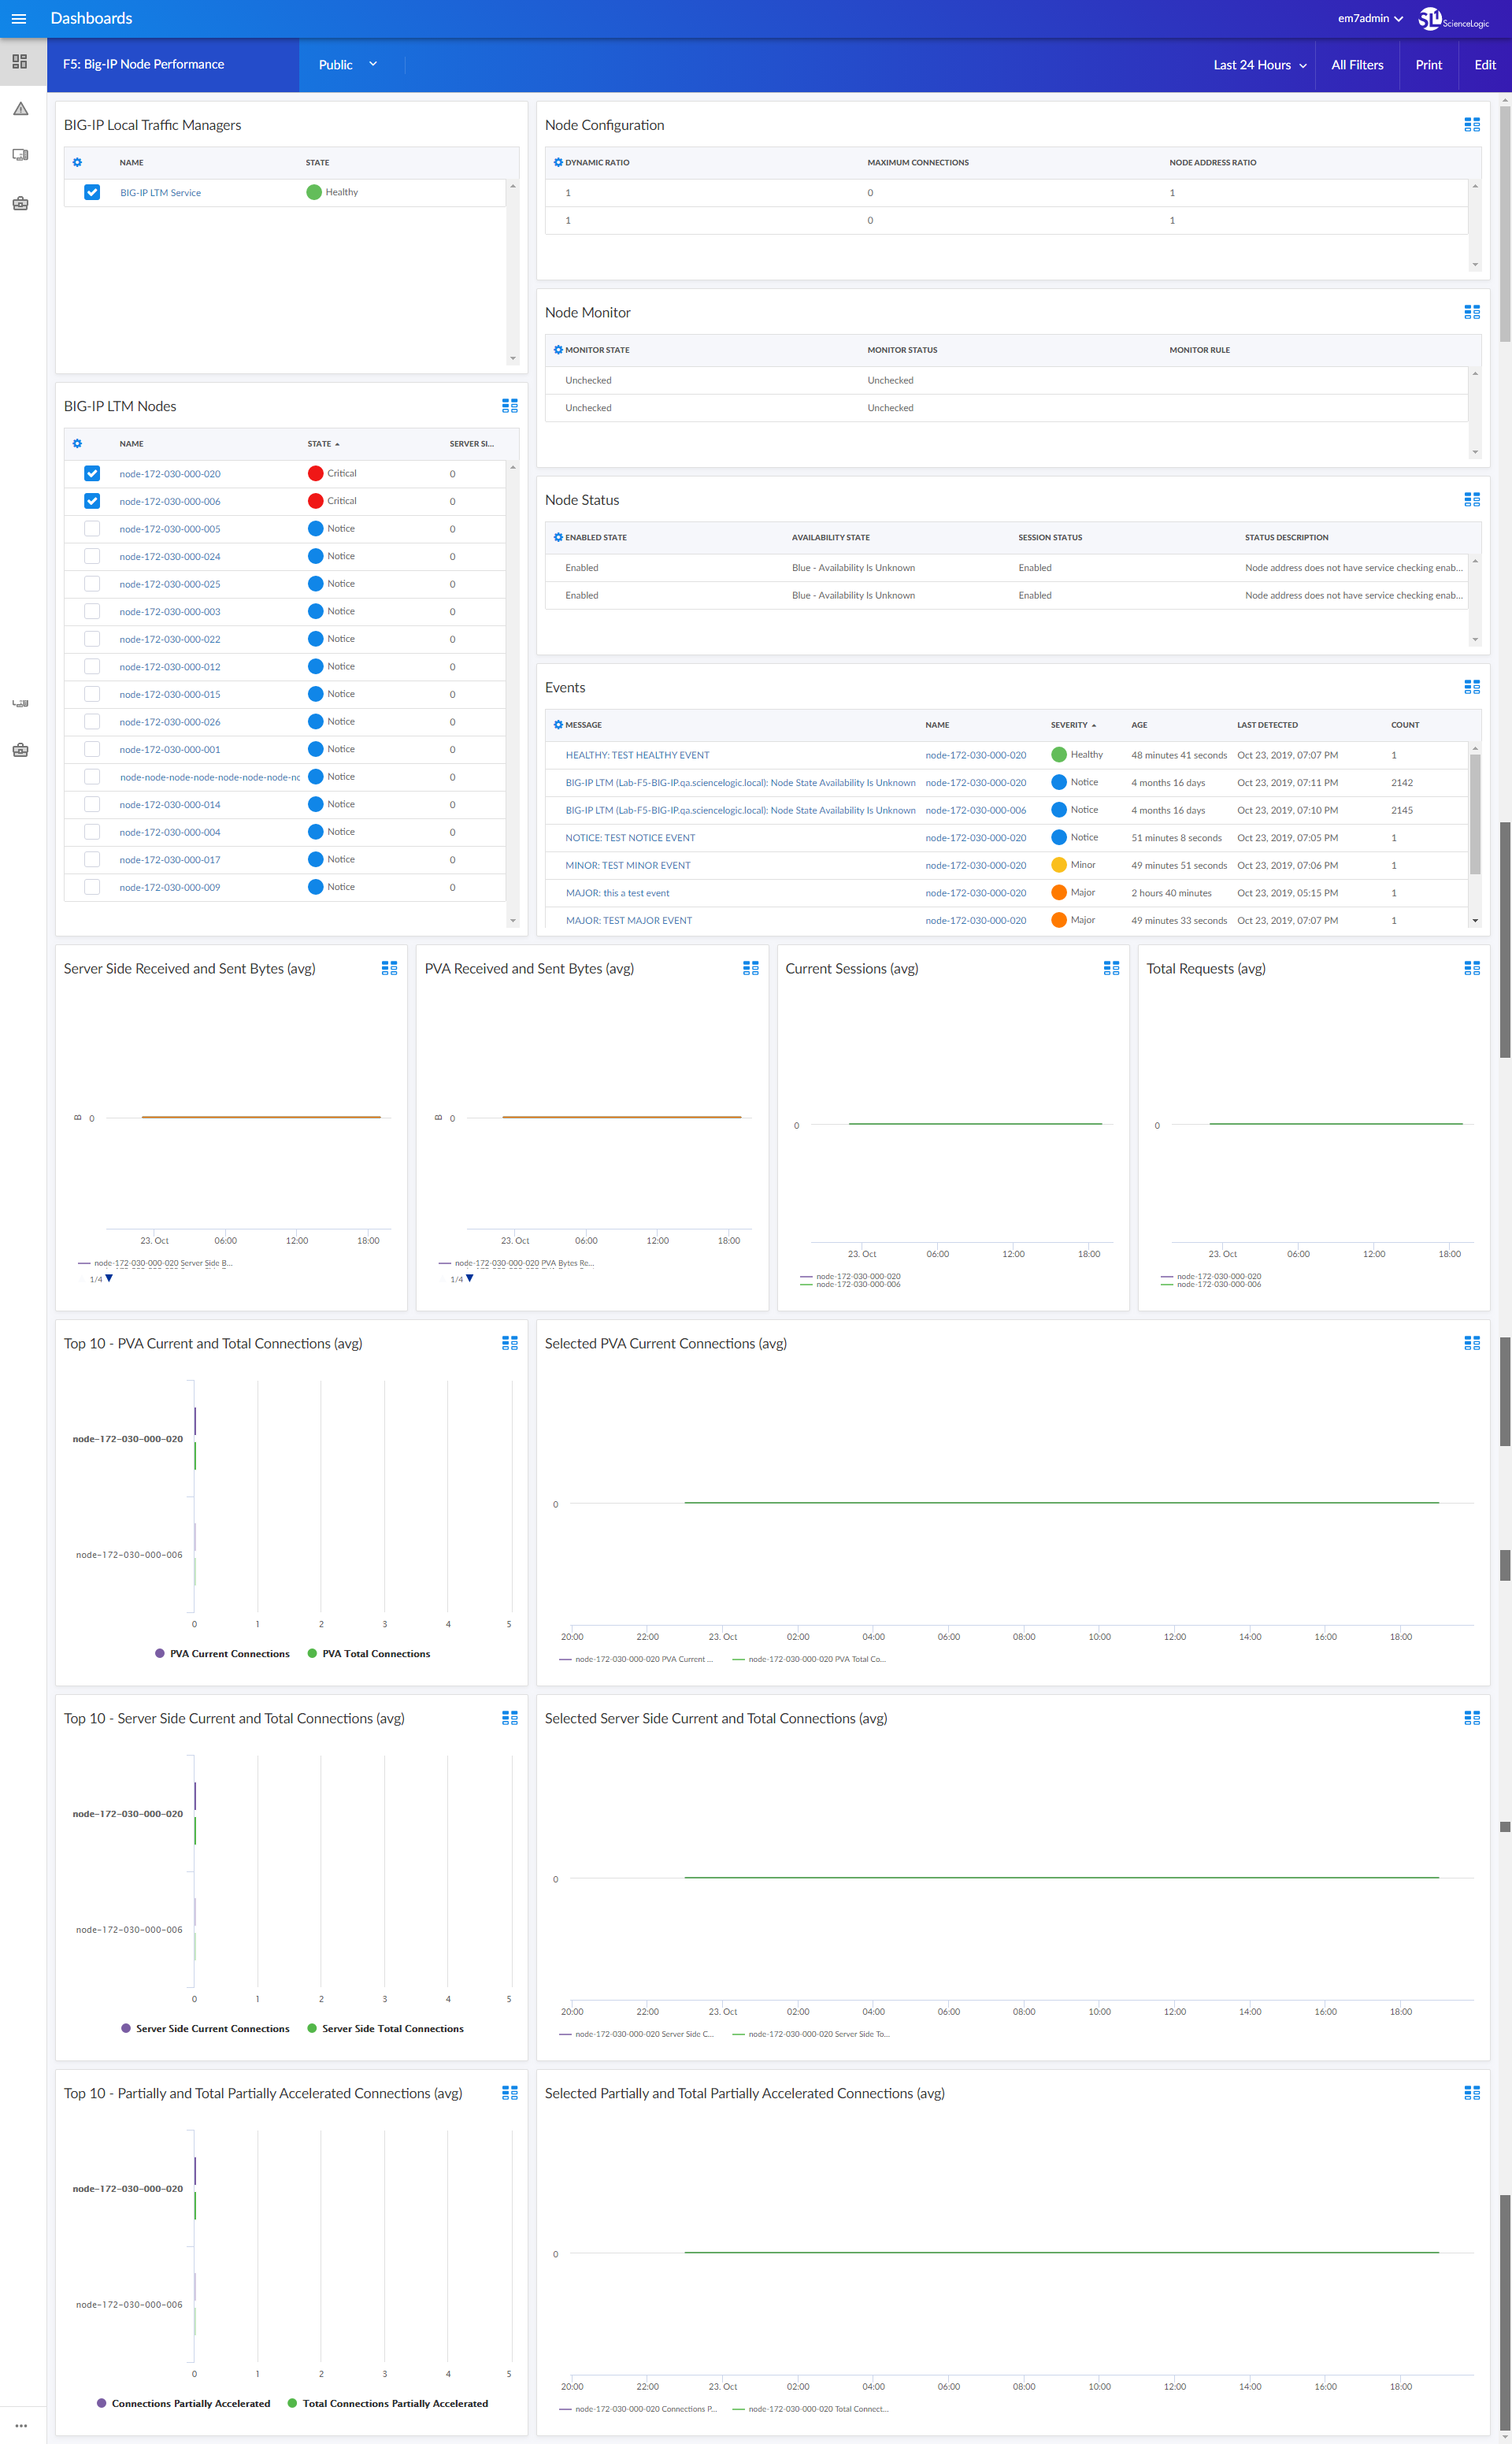
- An "F5: Big-IP Node Performance" dashboard, which includes the following widgets that display data about your F5 Big-IP nodes:
- Big-IP Local Traffic Managers
- Big-IP LTM Nodes
- Node Configuration
- Node Monitor
- Node Status
- Events
- Server Side Received and Sent Bytes (avg)
- PVA Received and Sent Bytes (avg)
- Current Sessions (avg)
- Total Requests (avg)
- Top 10 - PVA Current and Total Connections (avg)
- Selected PVA Current Connections (avg)
- Top 10 - Server Side Current and Total Connections (avg)
- Selected Server Side Current and Total Connections (avg)
- Top 10 - Partially and Total Partially Accelerated Connections (avg)
- Selected Partially and Total Partially Accelerated Connections (avg)
Enhancements and Issues Addressed
The following enhancements and addressed issues are included in version 105 of the F5 BIG-IP: SL1 Dashboards PowerPack:
- The following device investigators were added to the PowerPack:
- F5 BIG-IP LTM Root Investigator
- F5 BIG-IP LTM Node Investigator
- F5 BIG-IP LTM Pool Investigator
- F5 BIG-IP LTM Pool Member Investigator
- F5 BIG-IP LTM Virtual Server Investigator
Known Issues
Version 105 of the F5 BIG-IP: SL1 Dashboards PowerPack has no known issues.