![]()
Version 102 of the Microsoft Azure: SL1 Dashboards PowerPack includes autoselect for context-driving widgets and the addition of forecast widgets to some dashboards.
NOTE: These dashboards are intended for use only in the new SL1 user interface and will not load in the classic ScienceLogic platform user interface.
- Minimum Required SL1 Version: 8.12.1
- Minimum Required AP2 Version: 5.125.44
- Minimum Required Widget Components Version: 2.175.0
- Minimum Required Microsoft: Azure PowerPack Version: 110
Before You Install or Upgrade
Before installing Microsoft Azure: SL1 Dashboards PowerPack version 102, you must first ensure that you are running version 8.12.1 or later of SL1.
NOTE: For details on upgrading SL1, see the appropriate Release Notes.
You must also import and install the Microsoft: AzurePowerPack version 110 or later before installing the PowerPack.
Installation or Upgrade Process
To install this PowerPack:
- Familiarize yourself with the Known Issues for this release.
- See the Before You Install or Upgrade section. If you have not done so already, upgrade your system to the 8.12.1 or later release.
- Download the "Microsoft Azure: SL1 Dashboards" version 102PowerPack from the Support Site to a local computer.
- Go to the PowerPack Manager page (System > Manage > PowerPacks). Click the menu and choose Import PowerPack. When prompted, import "Microsoft Azure: SL1 Dashboards" version 102.
- Click the button. For details on installing PowerPacks, see the chapter on Installing a PowerPack in the PowerPacks manual.
Features
The following dashboards are included in version 102 of the Microsoft Azure: SL1 Dashboards PowerPack:
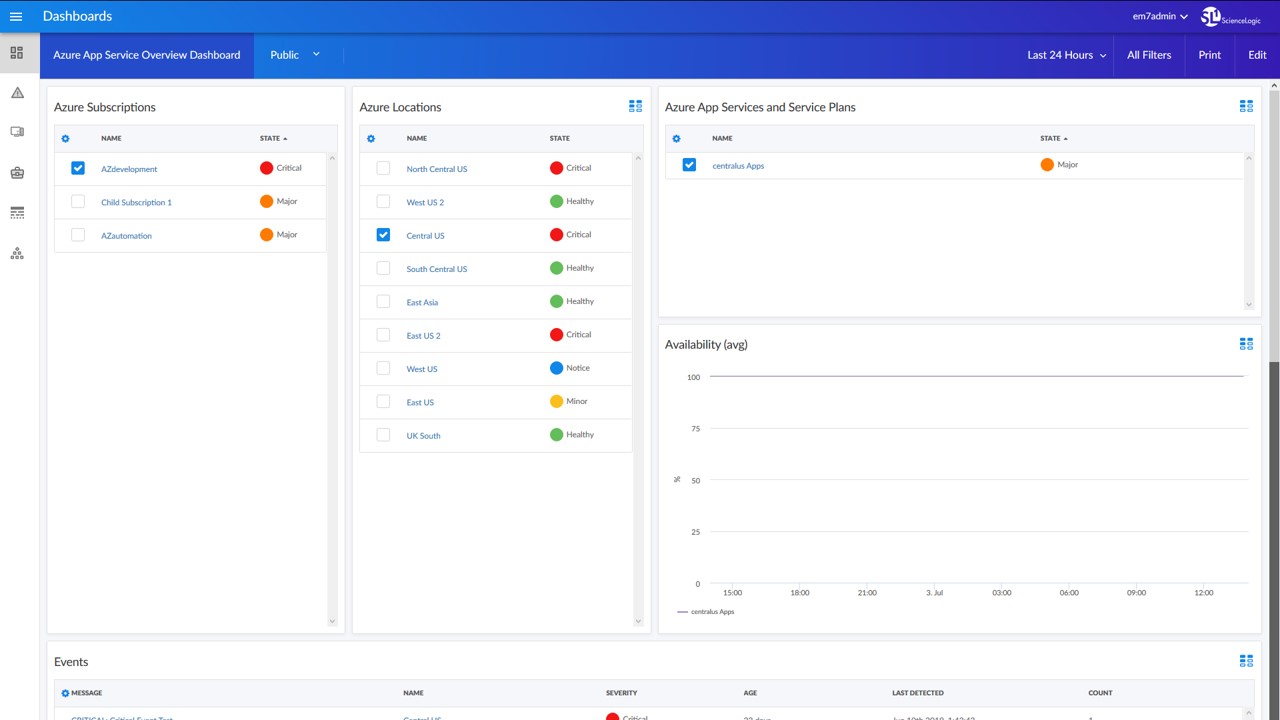
- An "Azure App Service Overview" dashboard, which includes the following widgets that display overview data about your Microsoft Azure applications:
- Azure Subscriptions
- Azure Locations
- Azure App Services and Service Plans
- Availability (avg)
- Events
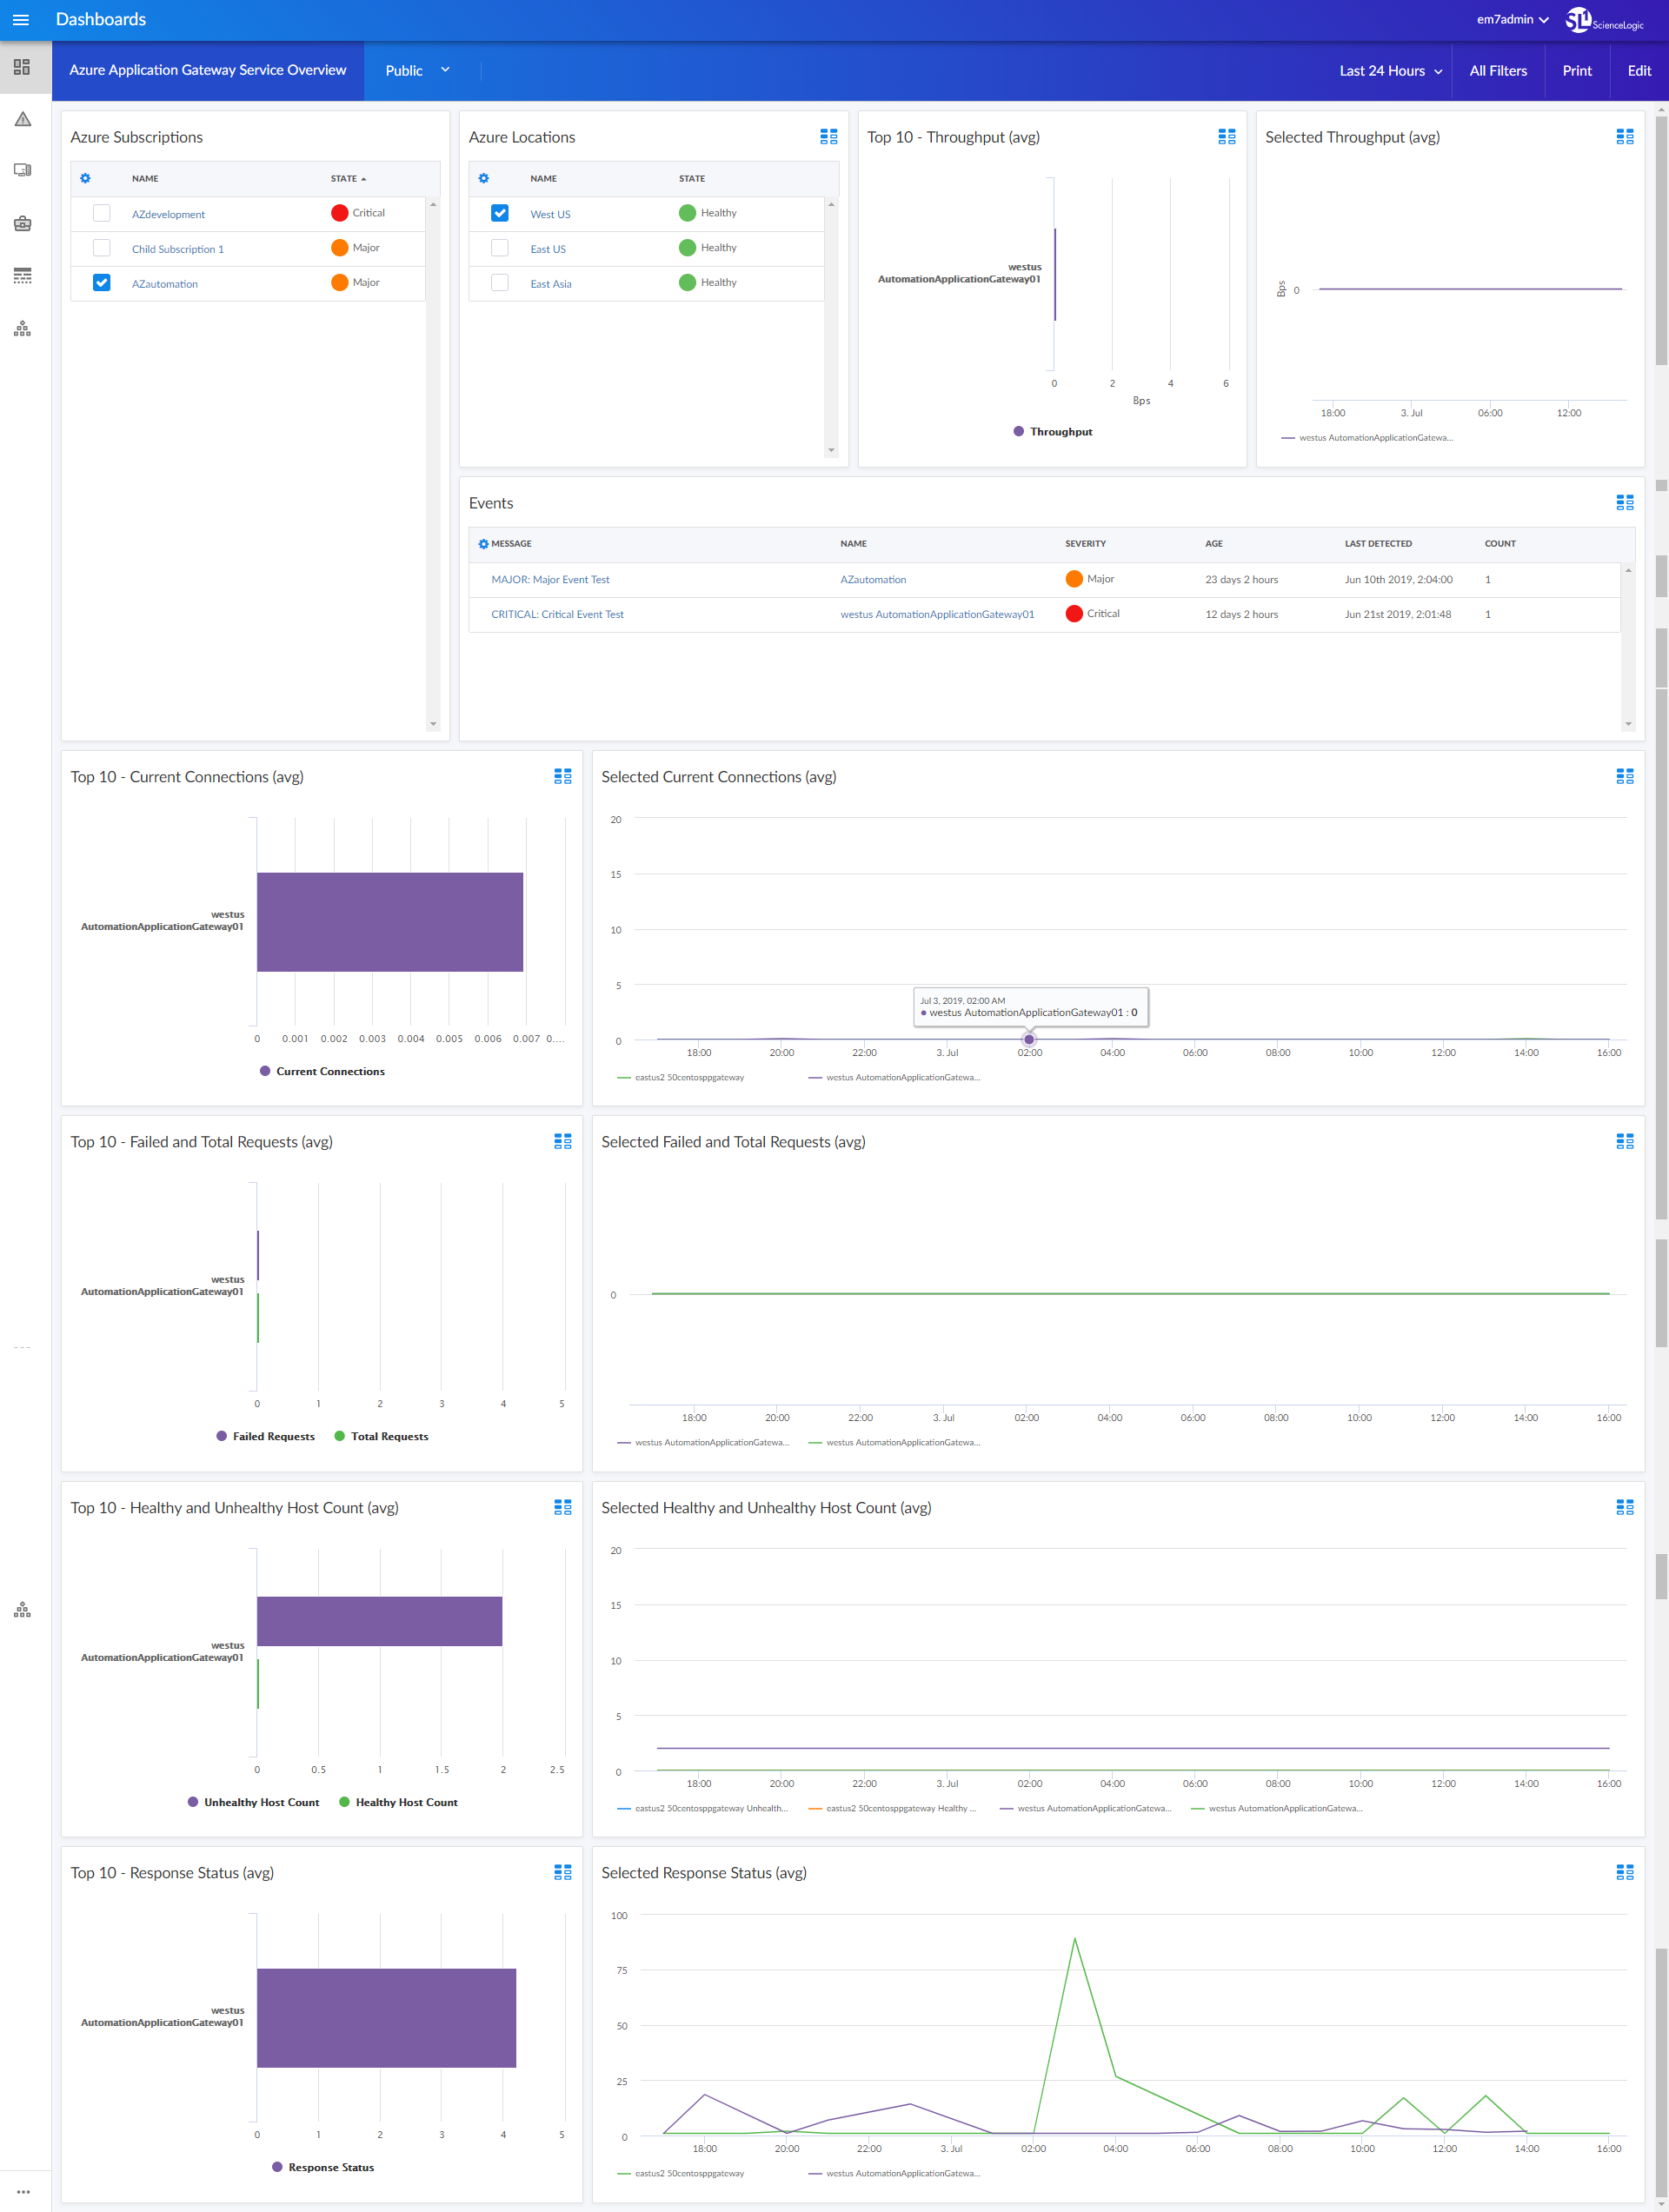
- An "Azure Application Gateway Service Overview" dashboard, which includes the following widgets that display overview data about your Microsoft Azure applications:
- Azure Subscriptions
- Azure Locations
- Top 10 - Throughput (avg)
- Selected Throughput (avg)
- Events
- Top 10 - Current Connections (avg)
- Selected Current Connections (avg)
- Top 10 - Failed and Total Requests (avg)
- Selected Failed and Total Requests (avg)
- Top 10 - Healthy and Unhealthy Host Count (avg)
- Selected Healthy and Unhealthy Host Count (avg)
- Top 10 - Response Status (avg)
- Selected Response Status (avg)
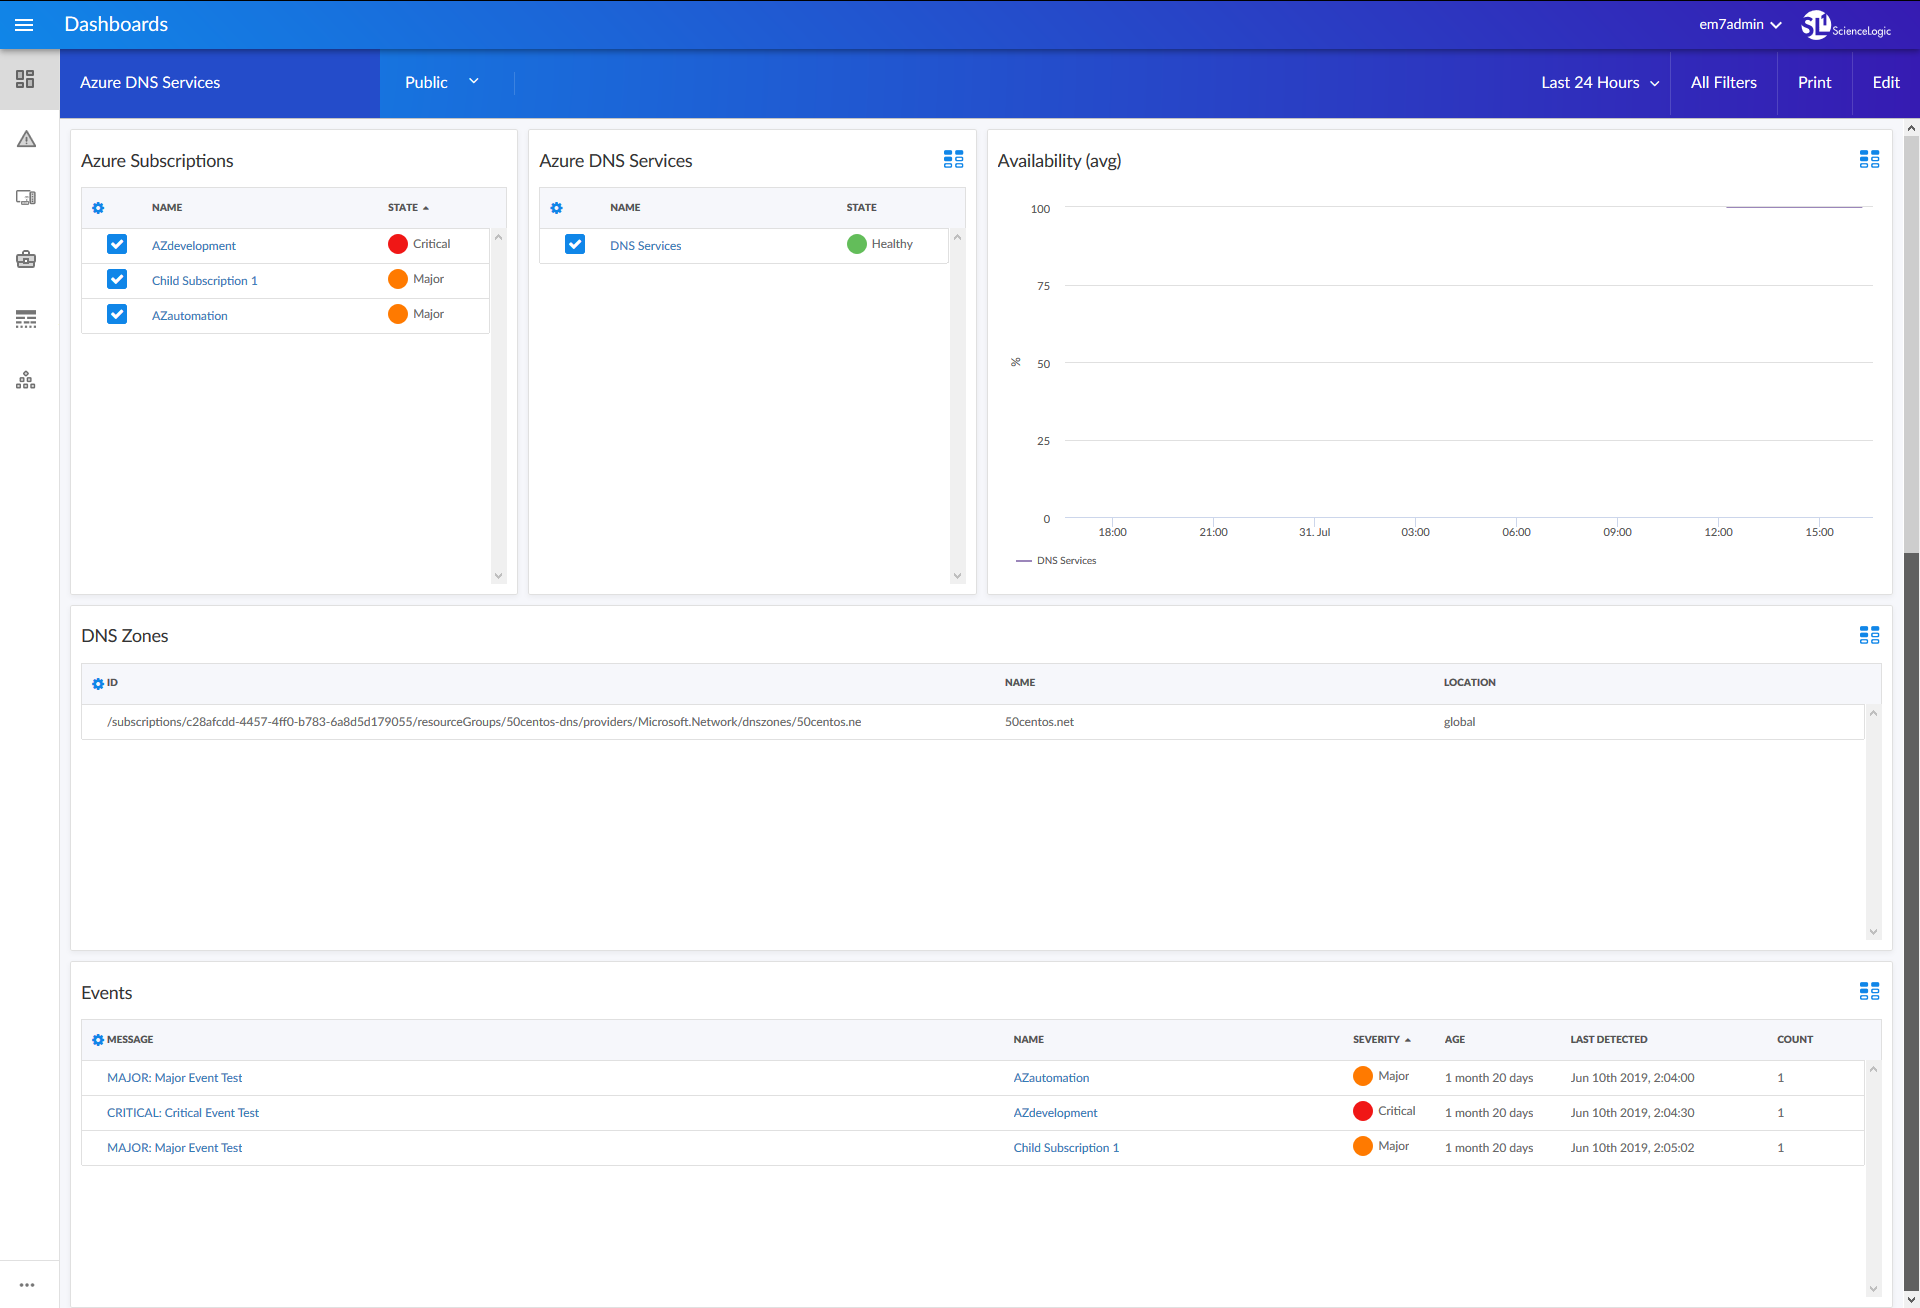
- An "Azure DNS Services" dashboard, which includes the following widgets that display data about your Microsoft Azure services:
- Azure Subscriptions
- Azure DNS Services
- Availability (avg)
- DNS Zones
- Events
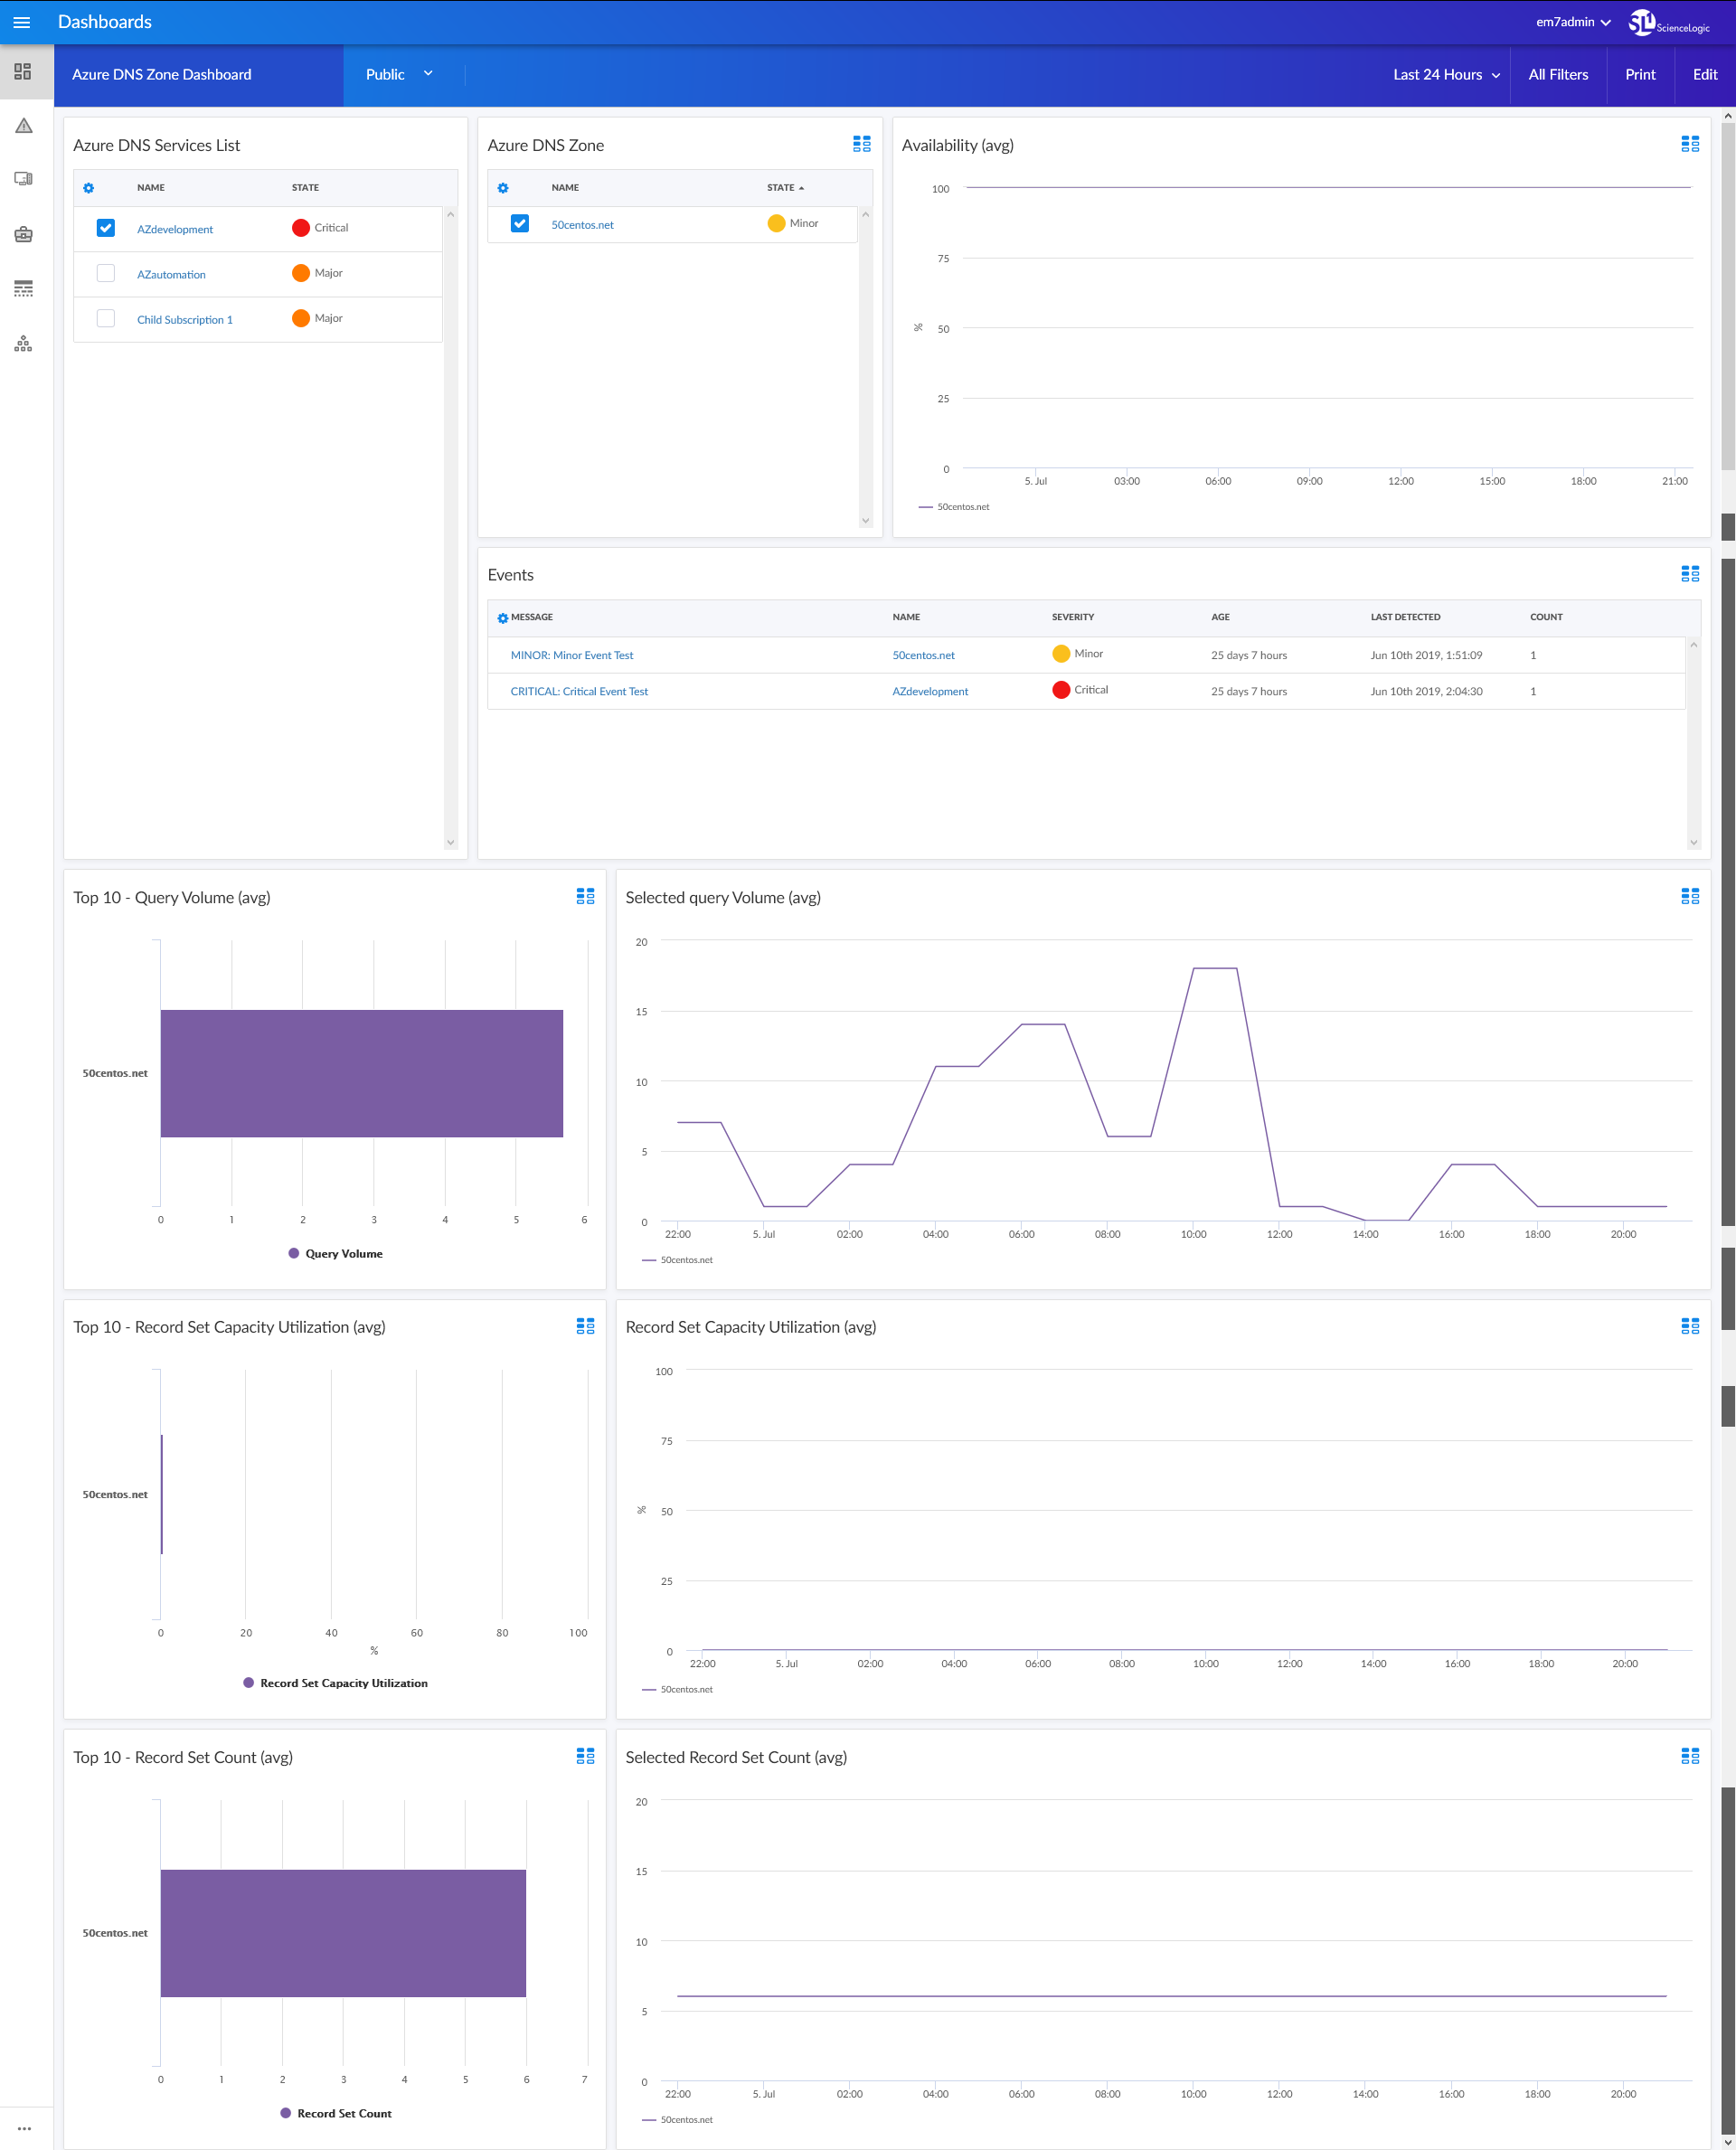
- An "Azure DNS Zone" dashboard, which includes the following widgets that display data about your Microsoft Azure zones:
- Azure DNS Services List
- Azure DNS Zone
- Availability (avg)
- Events
- Top 10 - Query Volume (avg)
- Selected Query Volume (avg)
- Top 10 - Record Set Capacity Utilization (avg)
- Record Set Capacity Utilization (avg)
- Top 10 - Record Set Count (avg)
- Selected Record Set Count (avg)
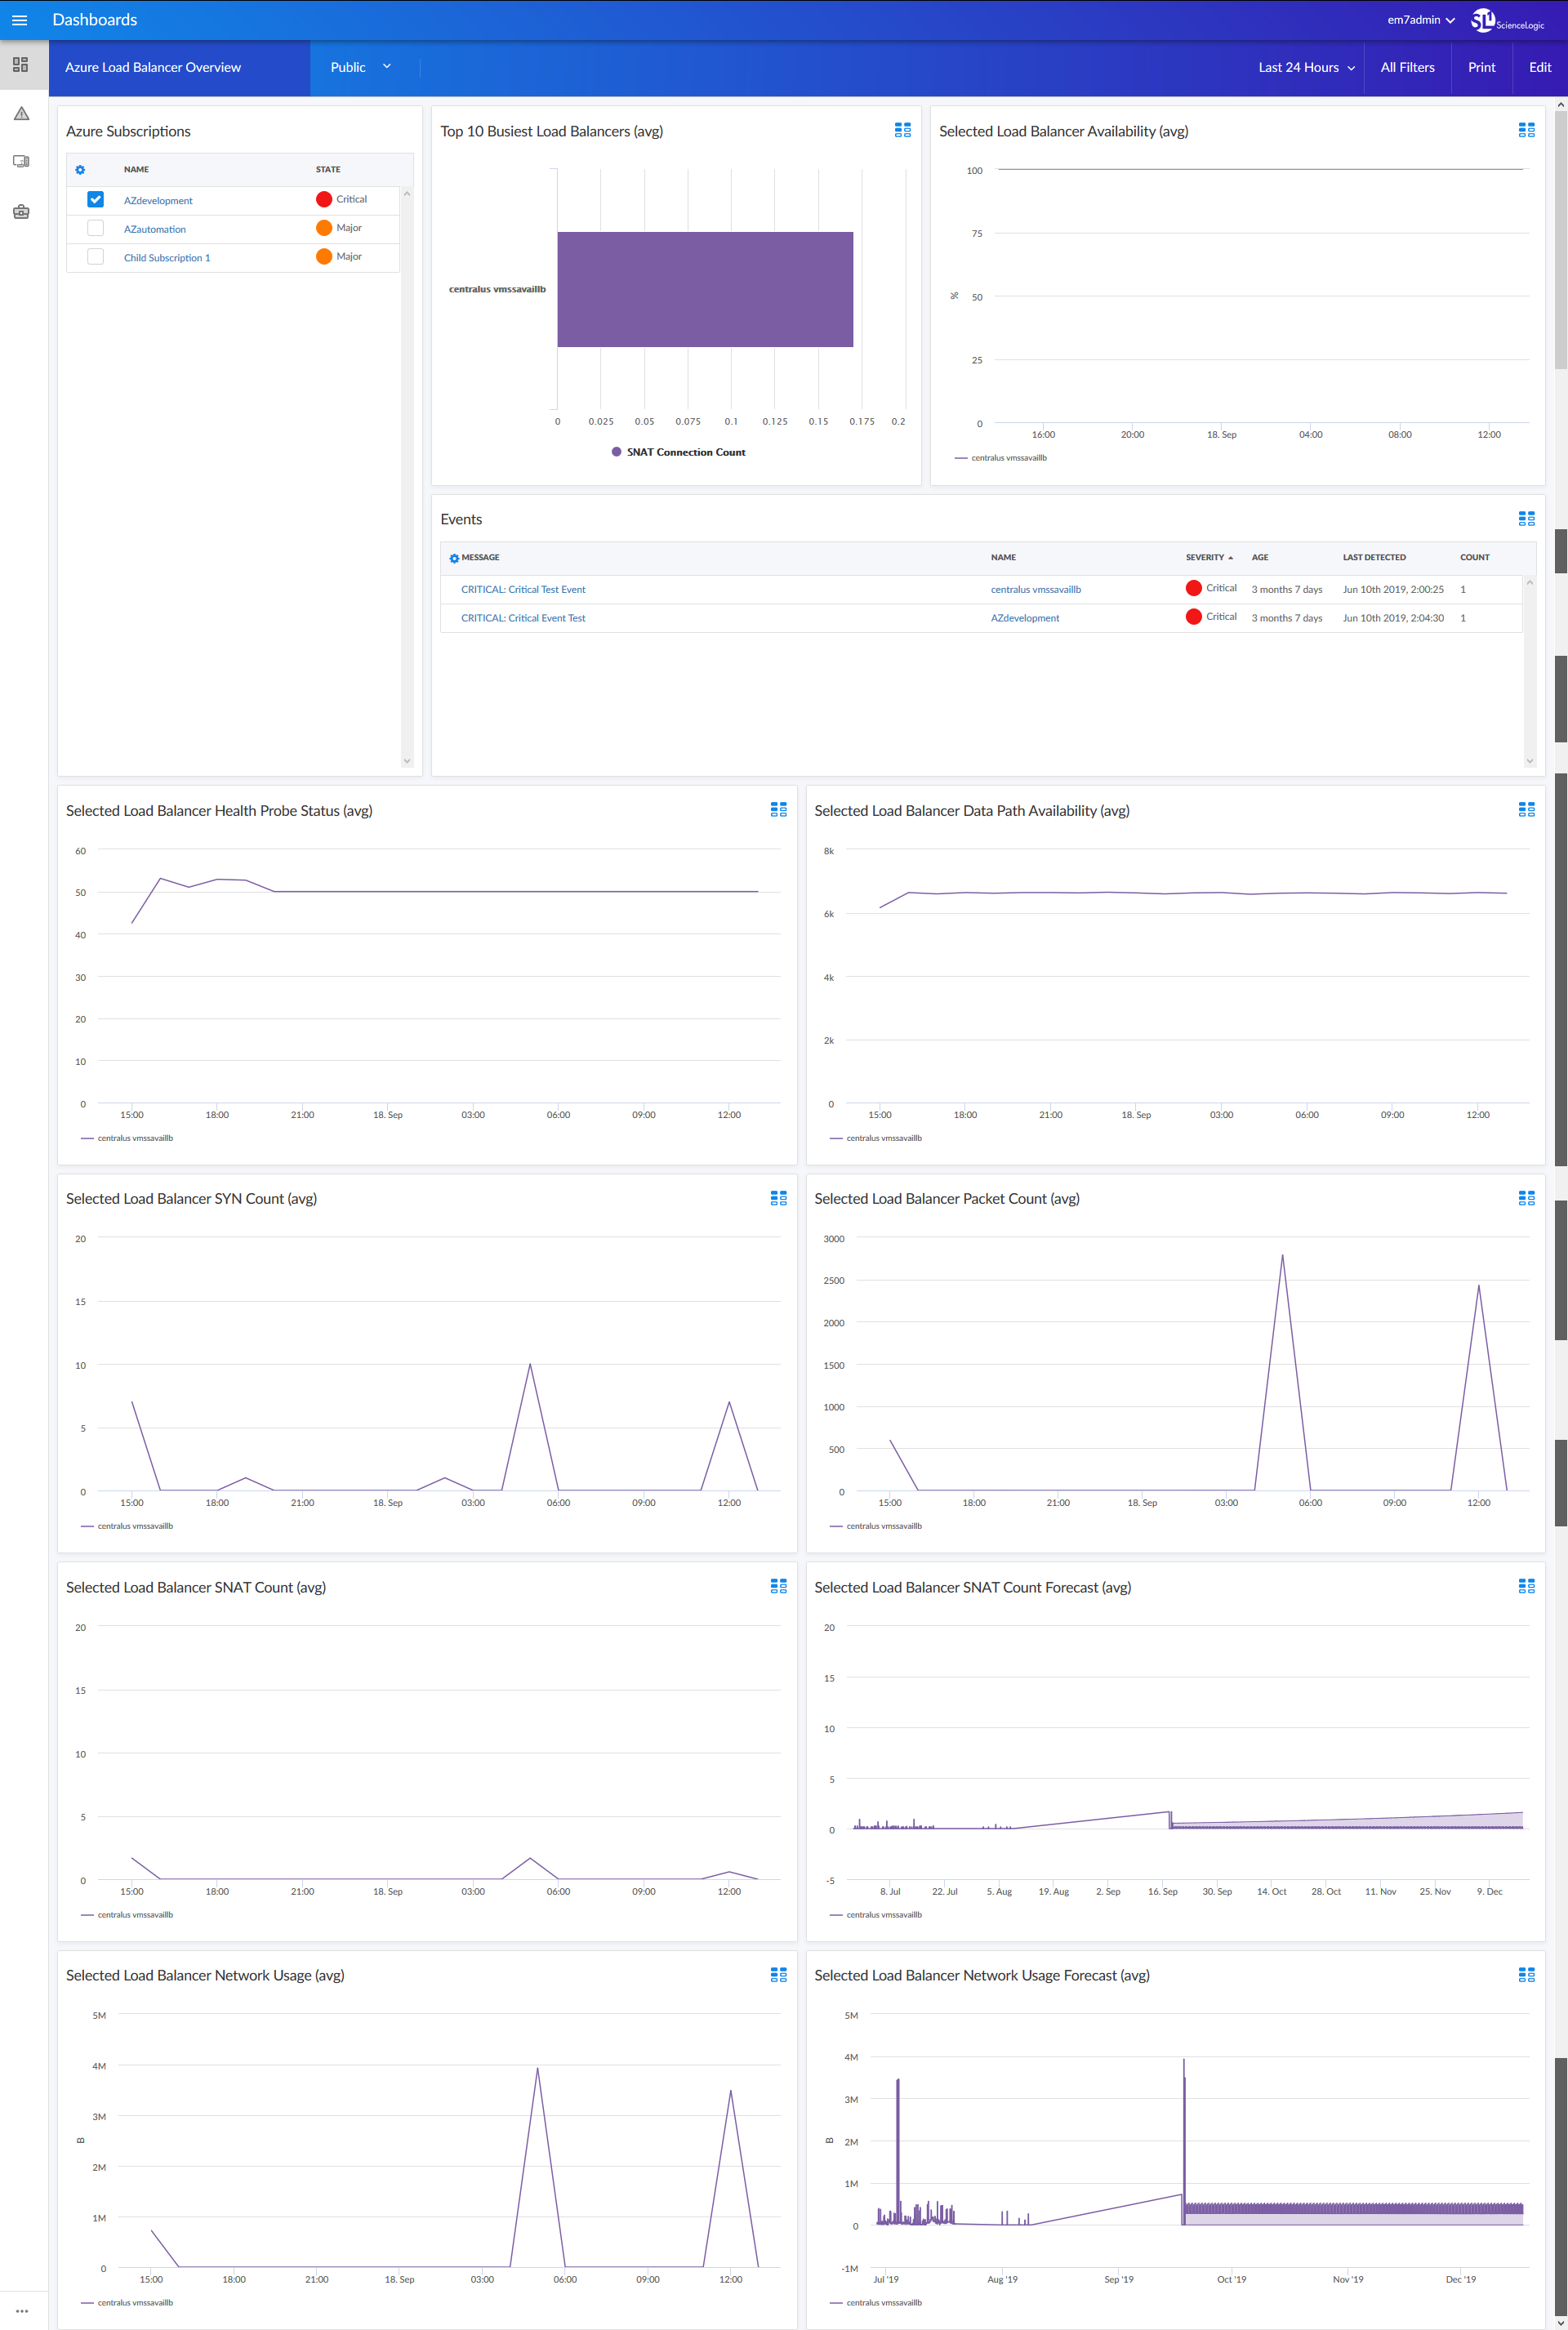
- An "Azure Load Balancer Overview" dashboard, which includes the following widgets that display overview data about your Microsoft Azure load balancers:
- Azure Subscriptions
- Top 10 Busiest Load Balancers (avg)
- Selected Load Balancer Availability (avg)
- Events
- Selected Load Balancer Health Probe Status (avg)
- Selected Load Balancer Data Path Availability (avg)
- Selected Load Balancer SYN Count (avg)
- Selected Load Balancer Packet Count (avg)
- Selected Load Balancer SNAT Count (avg)
- Selected Load Balancer SNAT Count Forecast (avg)
- Selected Load Balancer Network Usage (avg)
- Selected Load Balancer Network Forecast (avg)
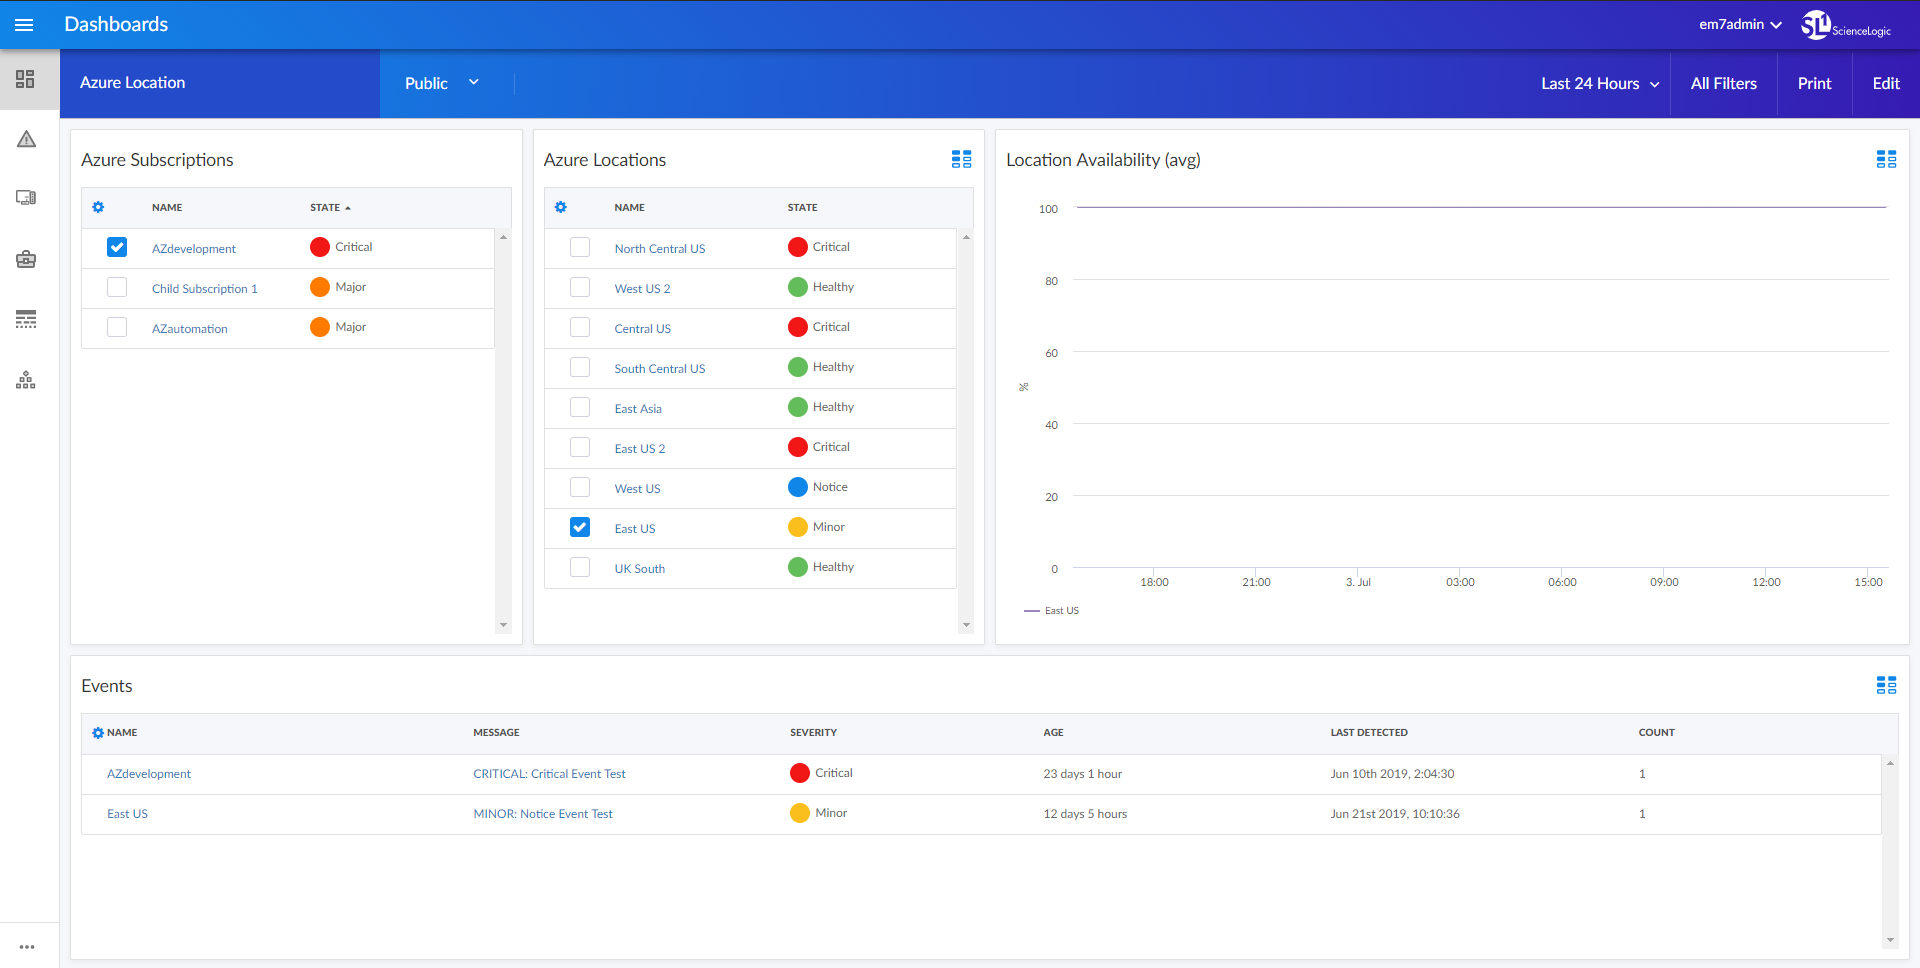
- An "Azure Location" dashboard, which includes the following widgets that display data about your Microsoft Azure locations:
- Azure Subscriptions
- Azure Locations
- Location Availability (avg)
- Events
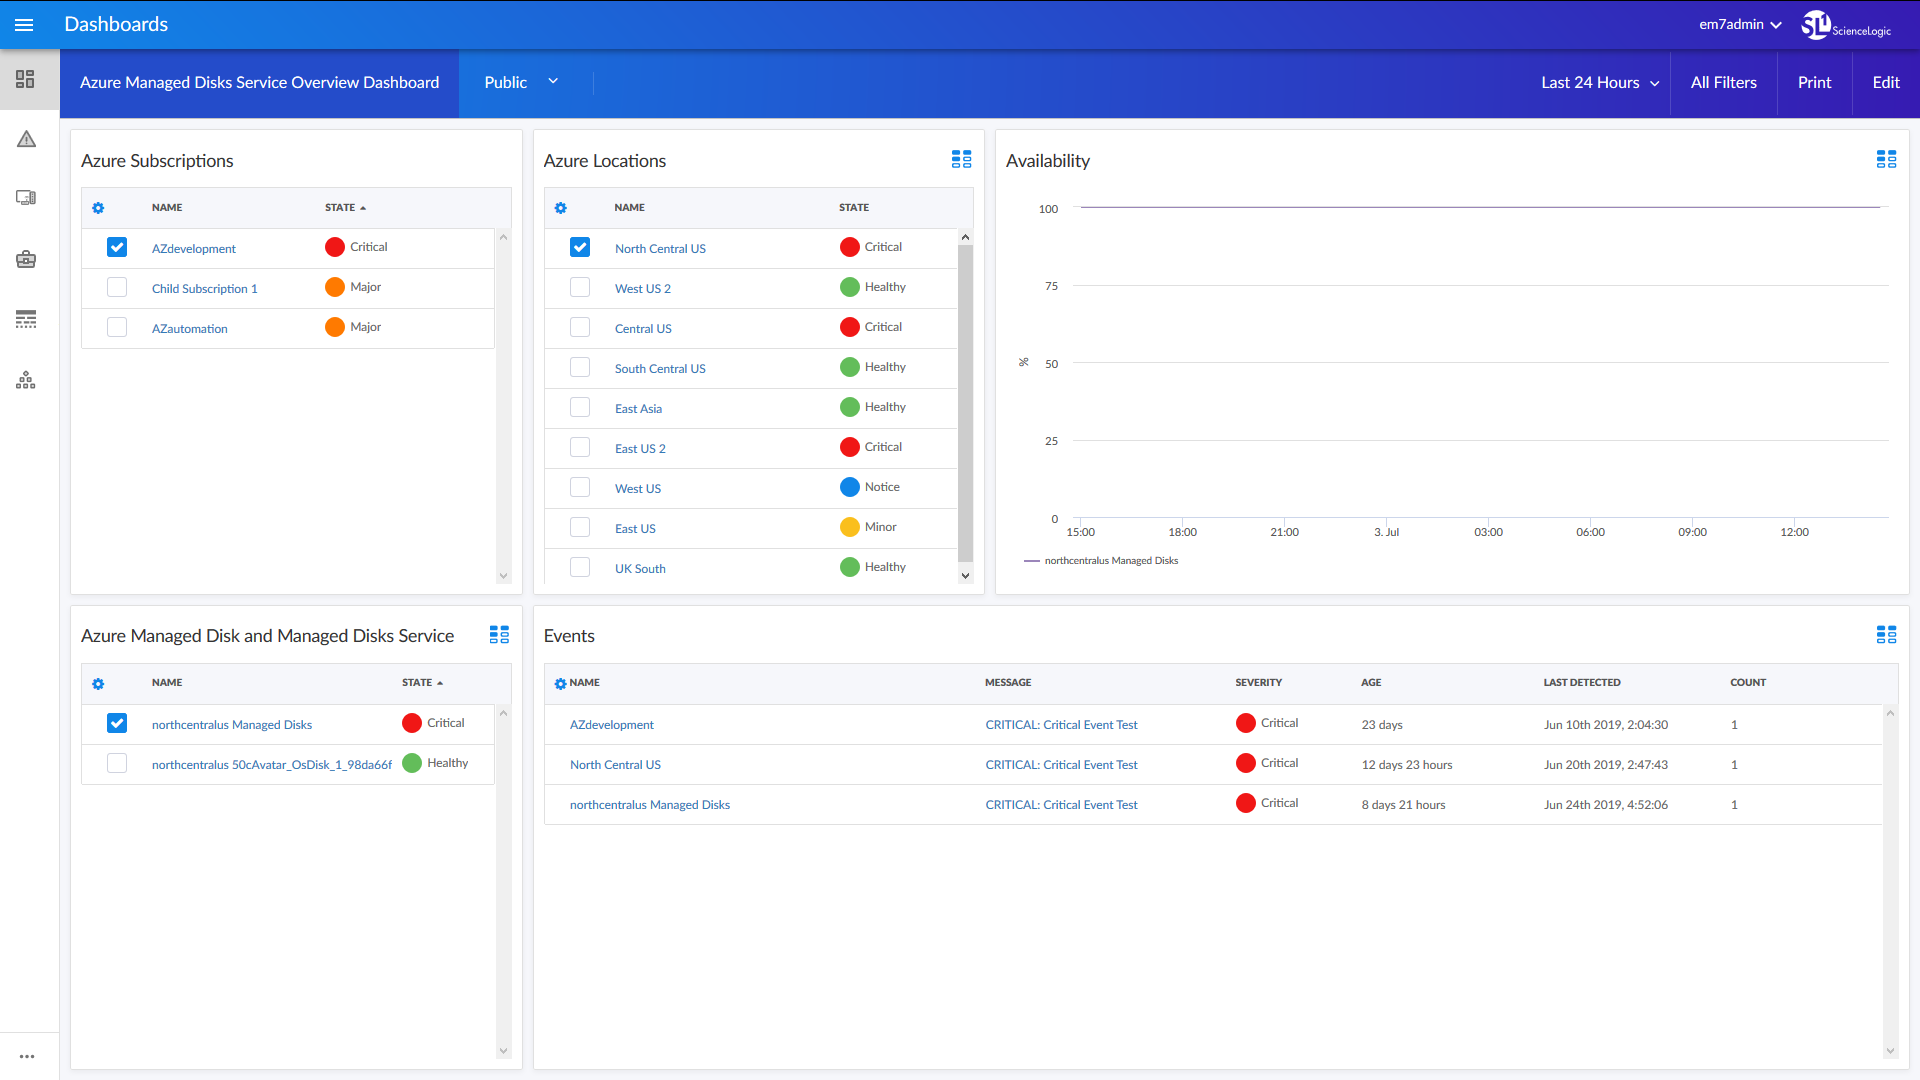
- An "Azure Managed Disks Service Overview" dashboard, which includes the following widgets that display overview data about your Microsoft Azure disks:
- Azure Subscriptions
- Azure Locations
- Availability
- Azure Managed Disk and Managed Disks Service
- Events
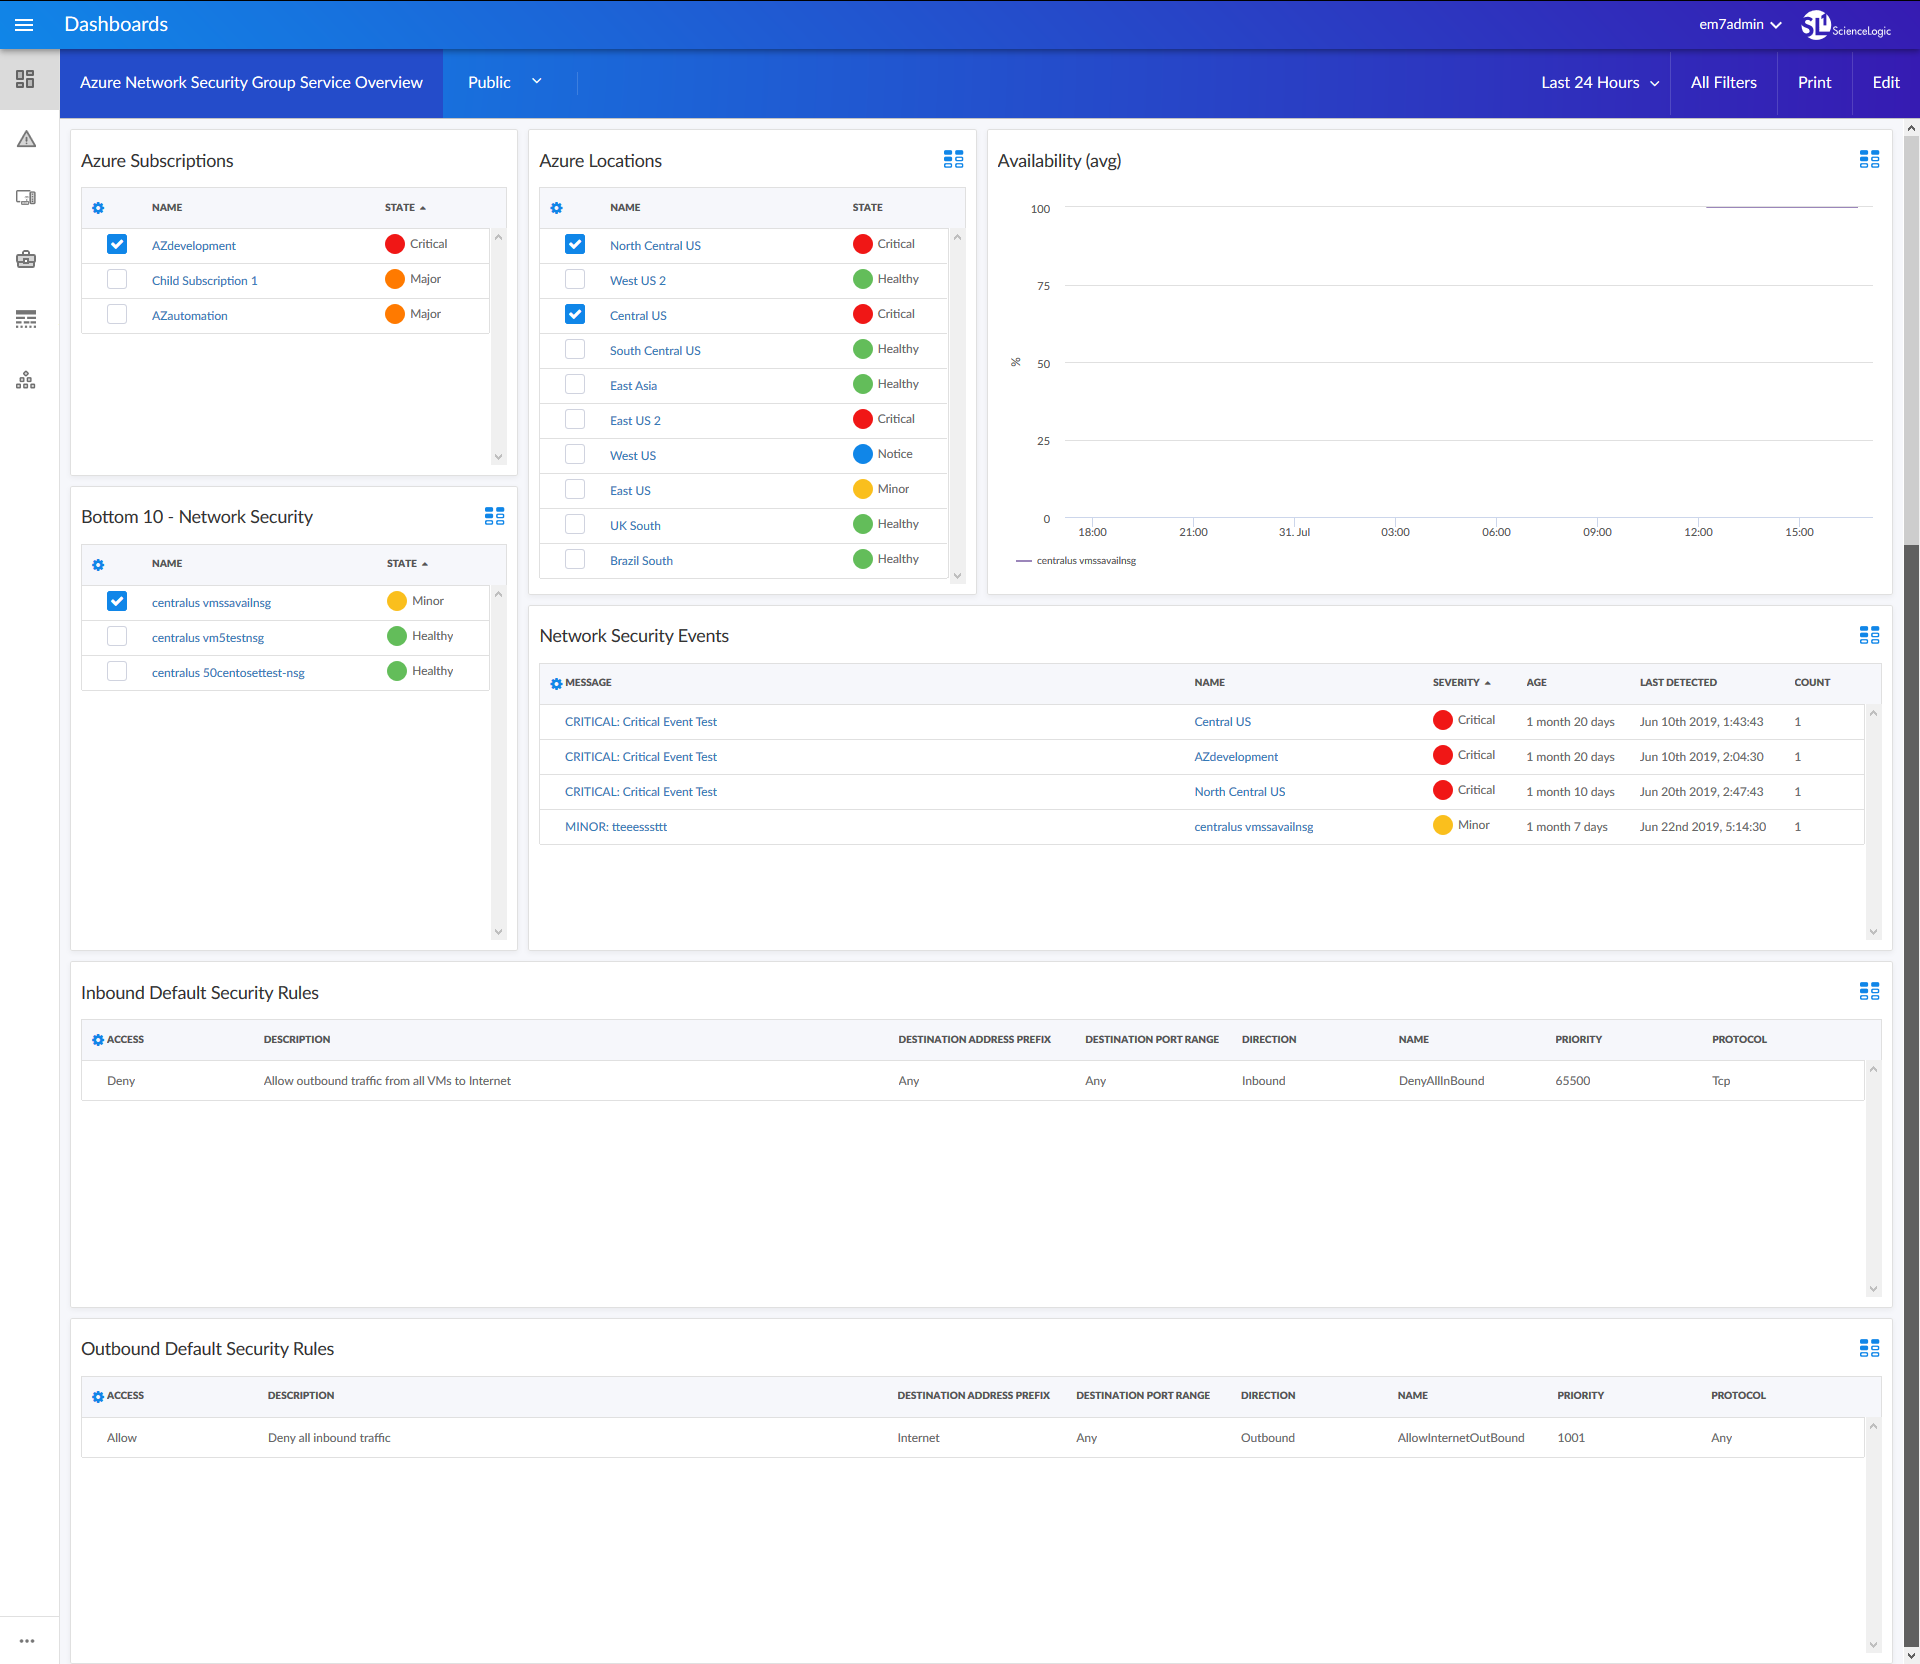
- An "Azure Network Security Group Service Overview" dashboard, which includes the following widgets that display overview data about your Microsoft Azure network security:
- Azure Subscriptions
- Azure Locations
- Availability (avg)
- Bottom 10 - Network Security
- Network Security Events
- Inbound Default Security Rules
- Outbound Default Security Rules
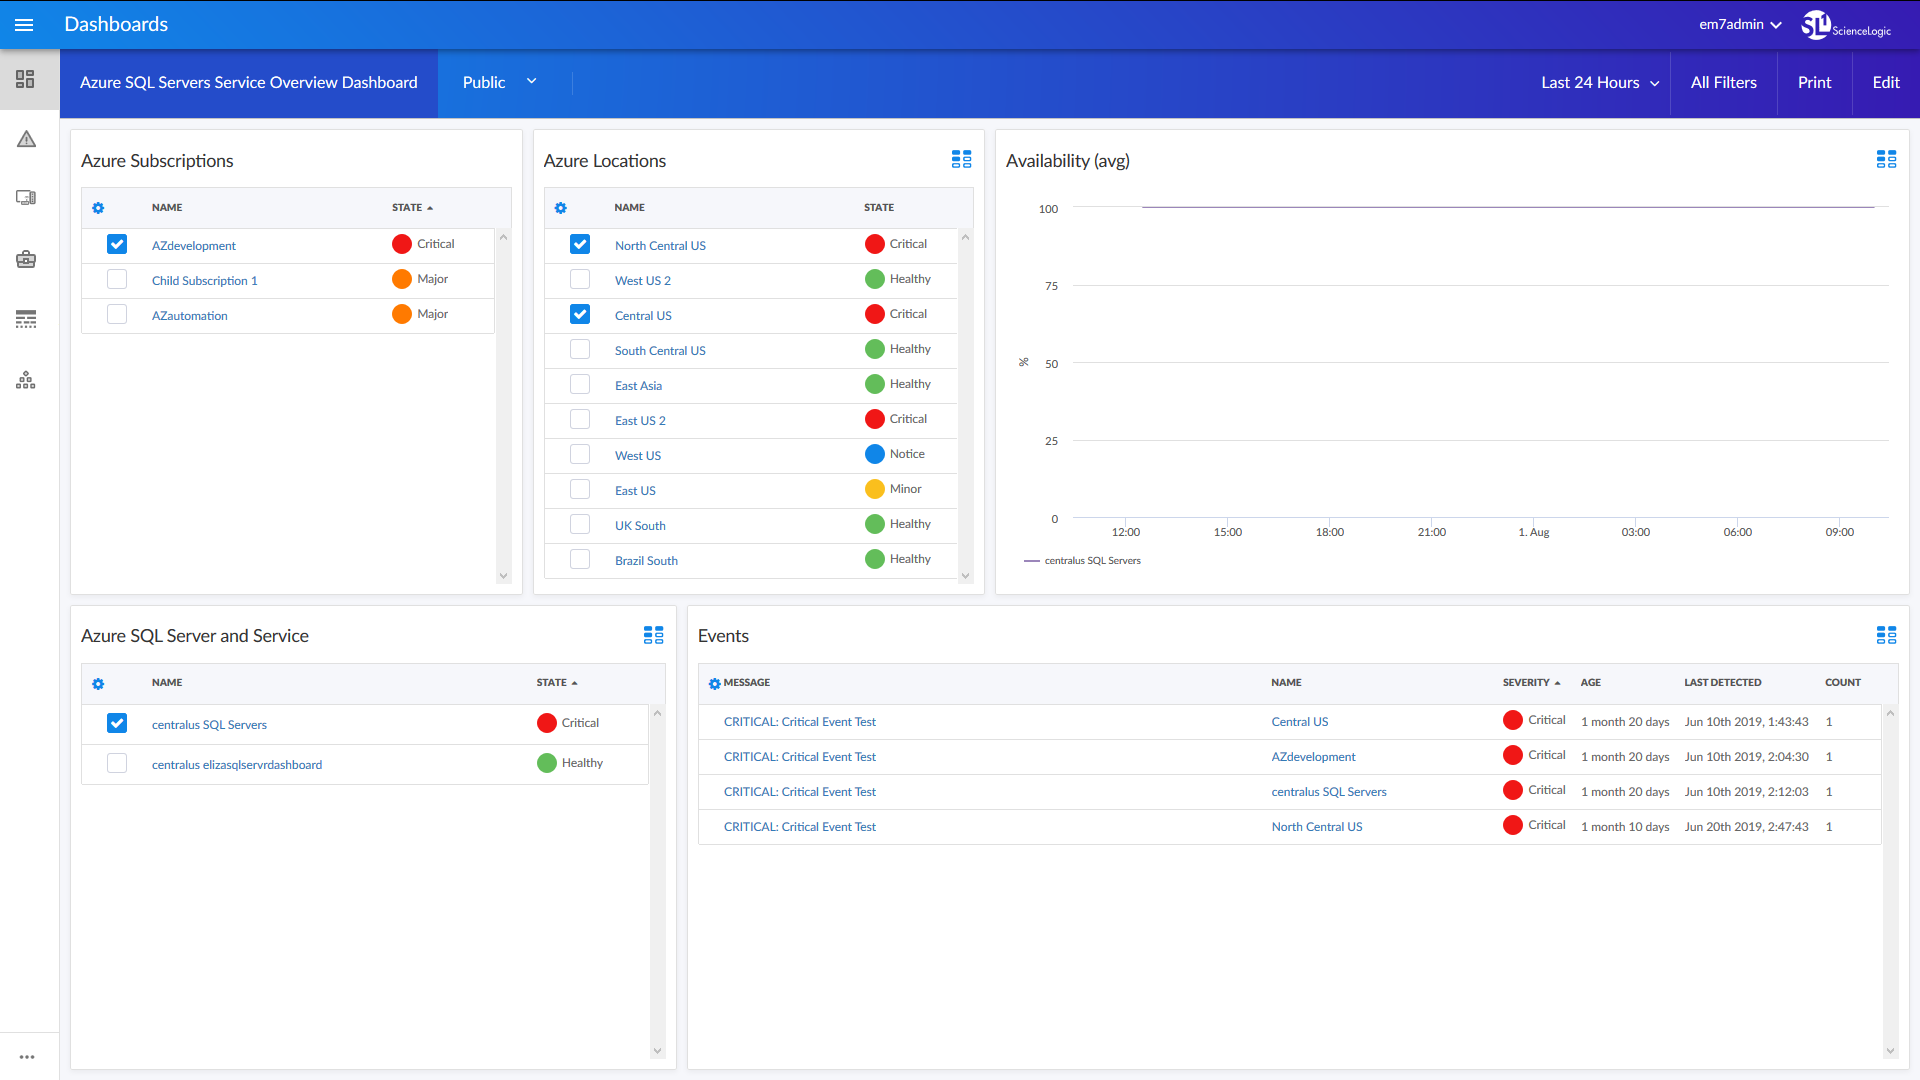
- An "Azure SQL Servers Service Overview" dashboard, which includes the following widgets that display overview data about your Microsoft Azure servers:
- Azure Subscriptions
- Azure Locations
- Availability (avg)
- Azure SQL Server and Service
- Events
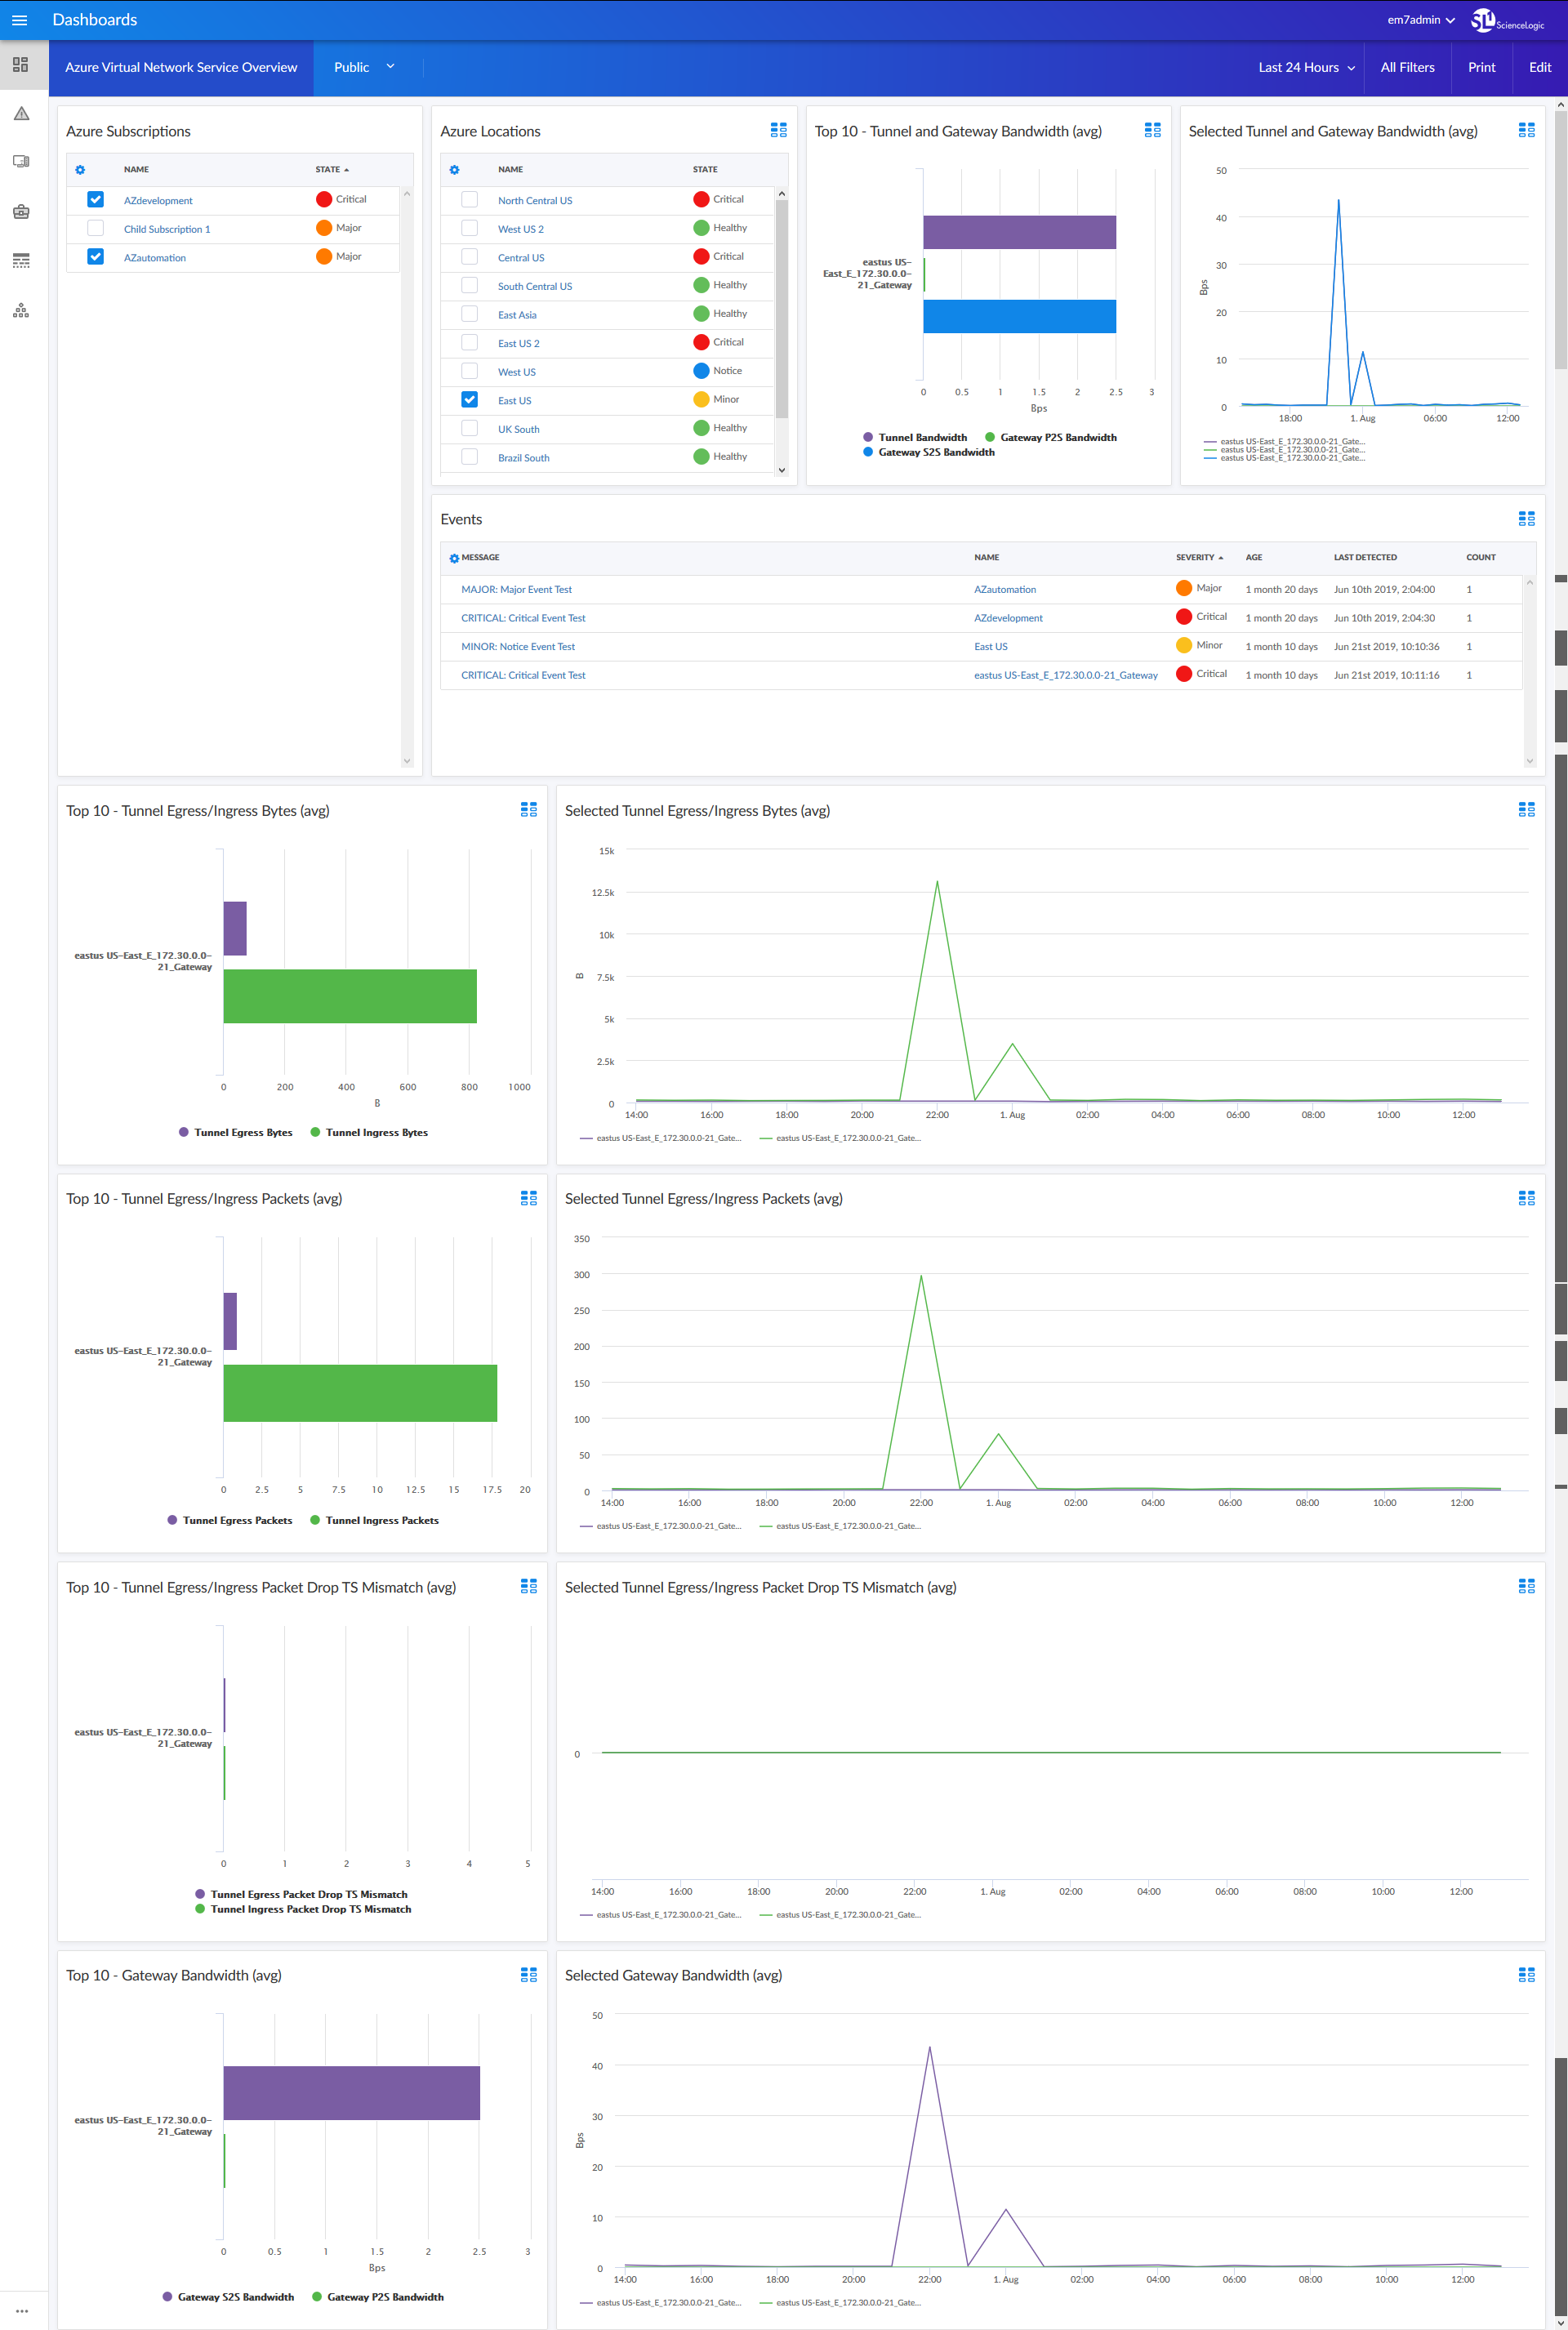
- An "Azure Virtual Network Service Overview" dashboard, which includes the following widgets that display overview data about your Microsoft Azure network service:
- Azure Subscriptions
- Azure Locations
- Events
- Top 10 - Tunnel and Gateway Bandwidth (avg)
- Selected Tunnel and Gateway Bandwidth (avg)
- Top 10 - Tunnel Egress/Ingress Bytes (avg)
- Selected Tunnel Egress/Ingress Bytes (avg)
- Top 10 - Tunnel Egress/Ingress Packets (avg)
- Selected Tunnel Egress/Ingress Packets (avg)
- Top 10 - Tunnel Egress/Ingress Packet Drop TS Mismatch (avg)
- Selected Tunnel egress/Ingress Packet Drop TS Mismatch (avg)
- Top 10 - Gateway Bandwidth (avg)
- Selected Gateway Bandwidth (avg)
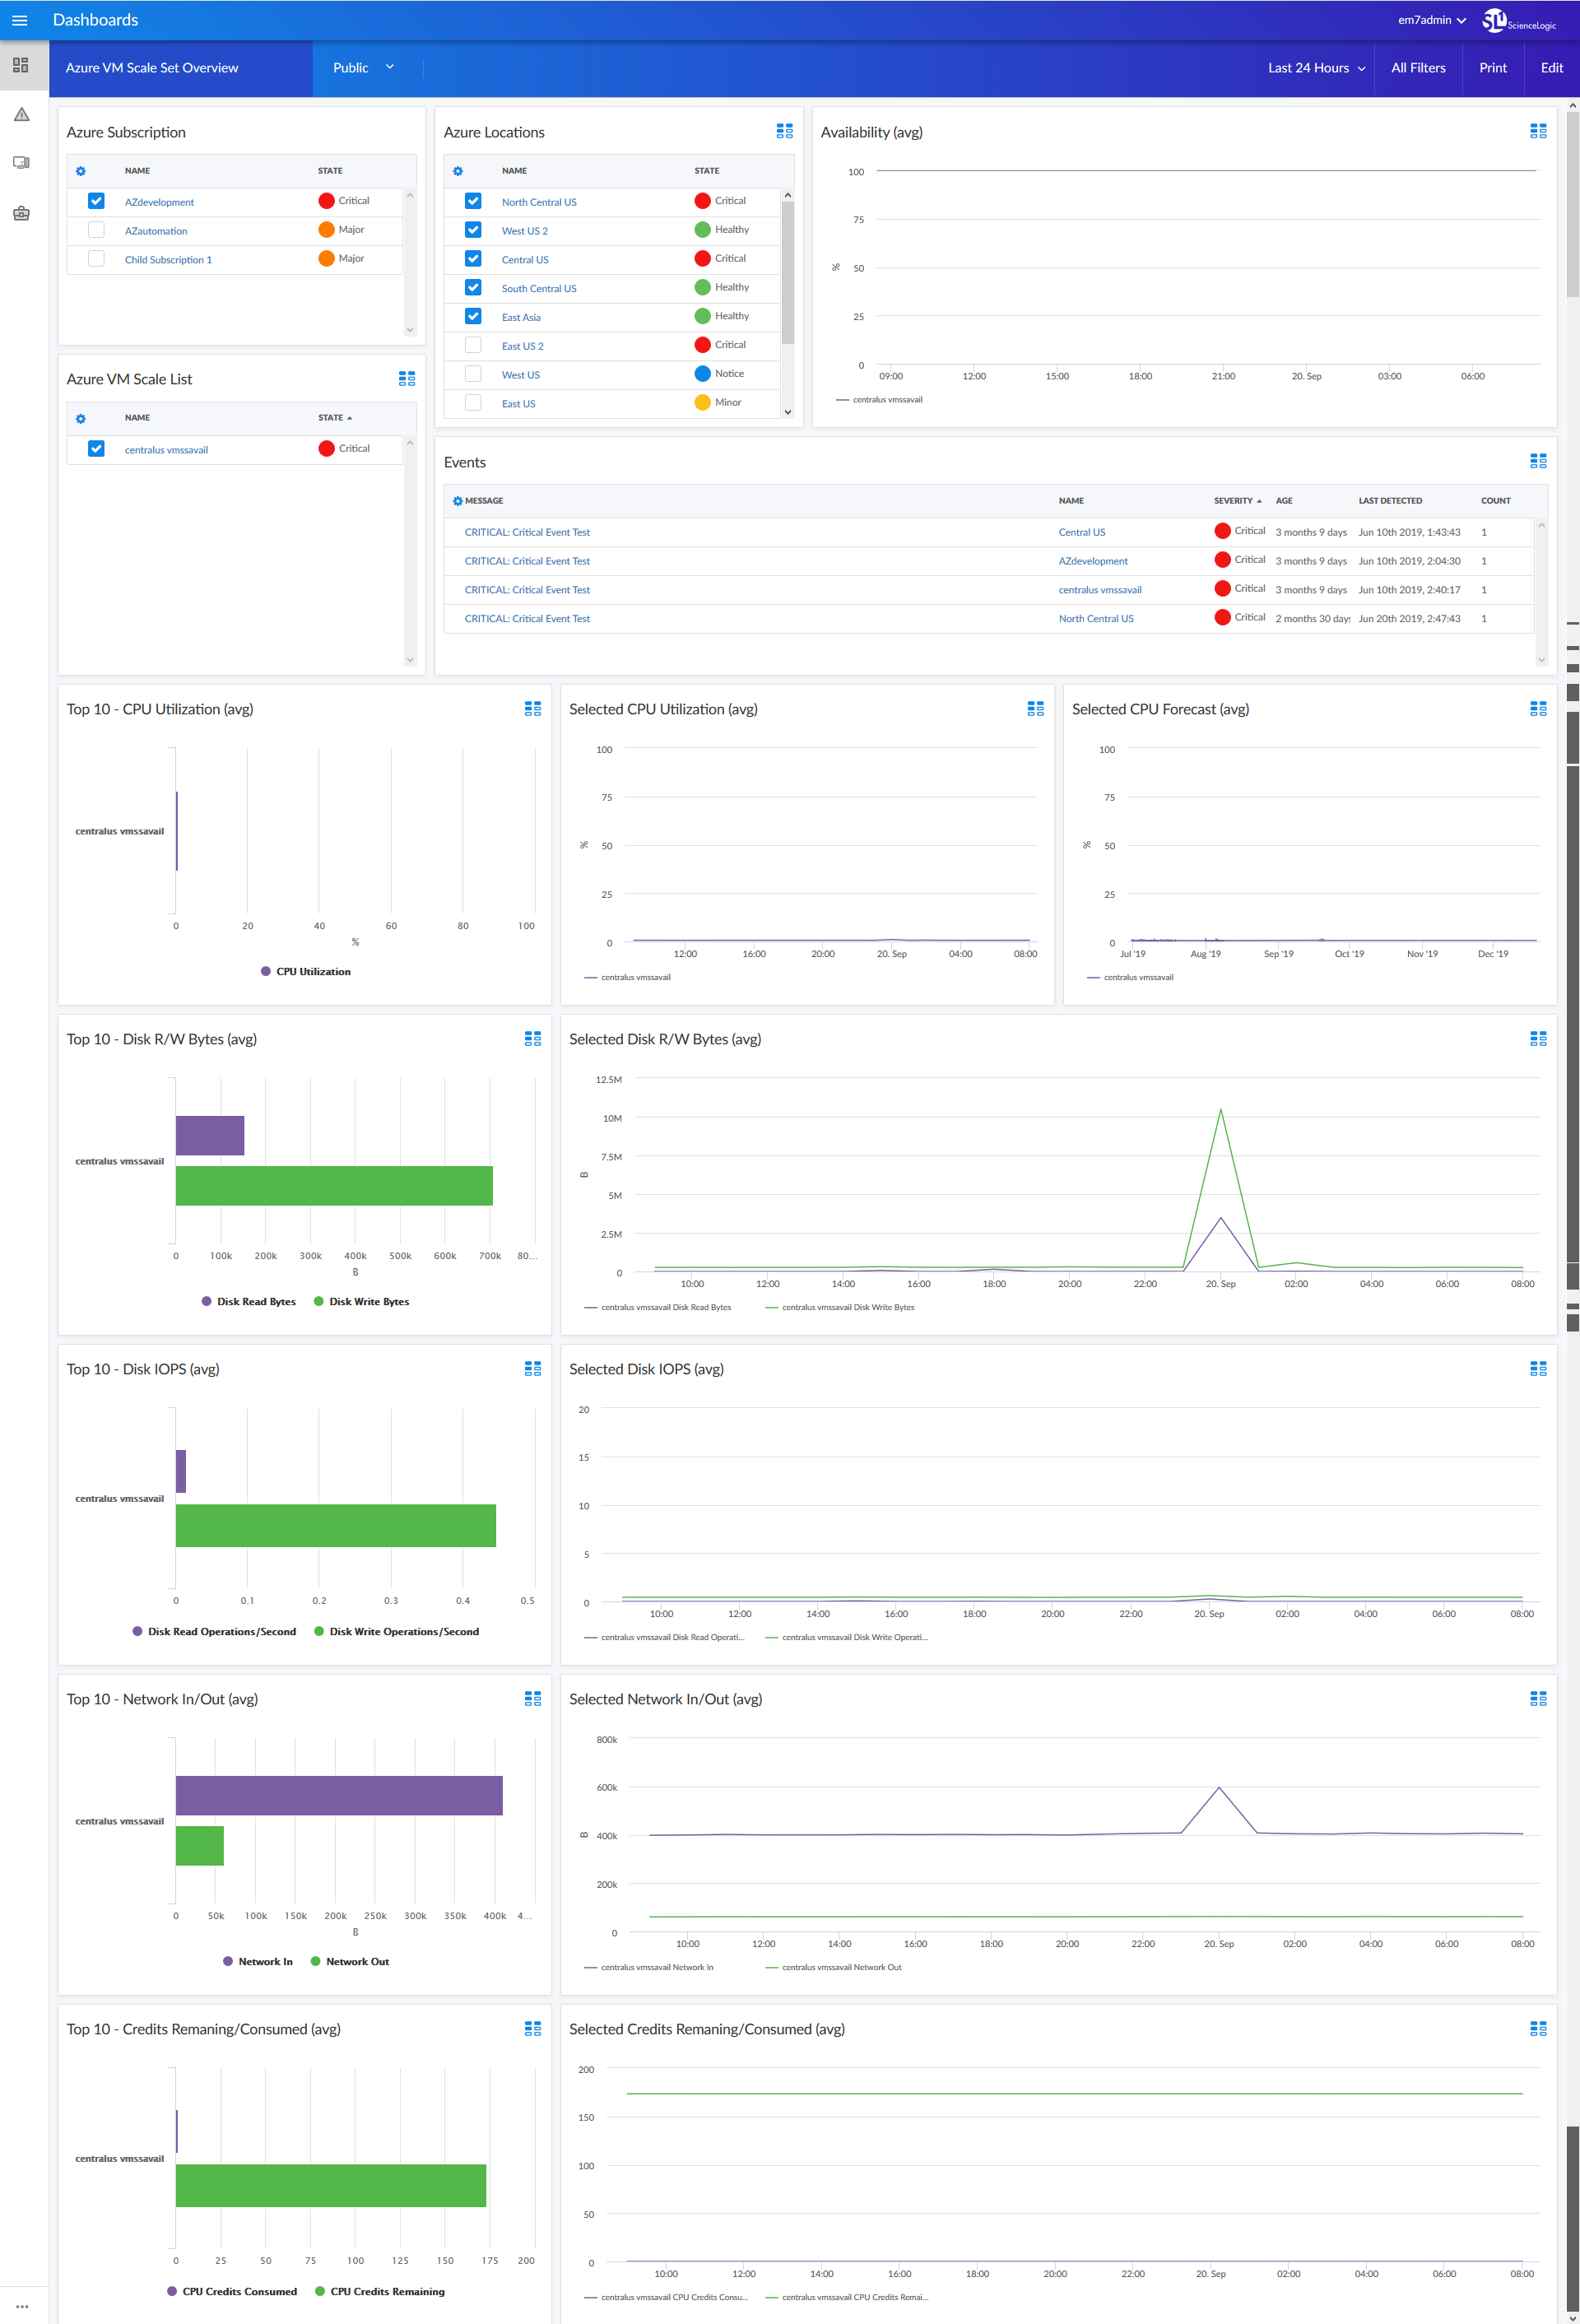
- An "Azure VM Scale Set Overview" dashboard, which includes the following widgets that display overview data about your Microsoft Azure scales:
- Azure Subscriptions
- Azure Locations
- Availability (avg)
- Azure VM Scale List
- Events
- Top 10 - CPU Utilization (avg)
- Selected CPU Utilization (avg)
- Selected CPU Utilization Forecast (avg)
- Top 10 - Disk R/W Bytes (avg)
- Selected Disk R/W Bytes (avg)
- Top 10 - Disk IOPS (avg)
- Selected Disk IOPS (avg)
- Top 10 - Network In/Out (avg)
- Selected Network In/Out (avg)
- Top 10 - Credits Remaining/Consumed (avg)
- Selected Credits Remaining/Consumed (avg)
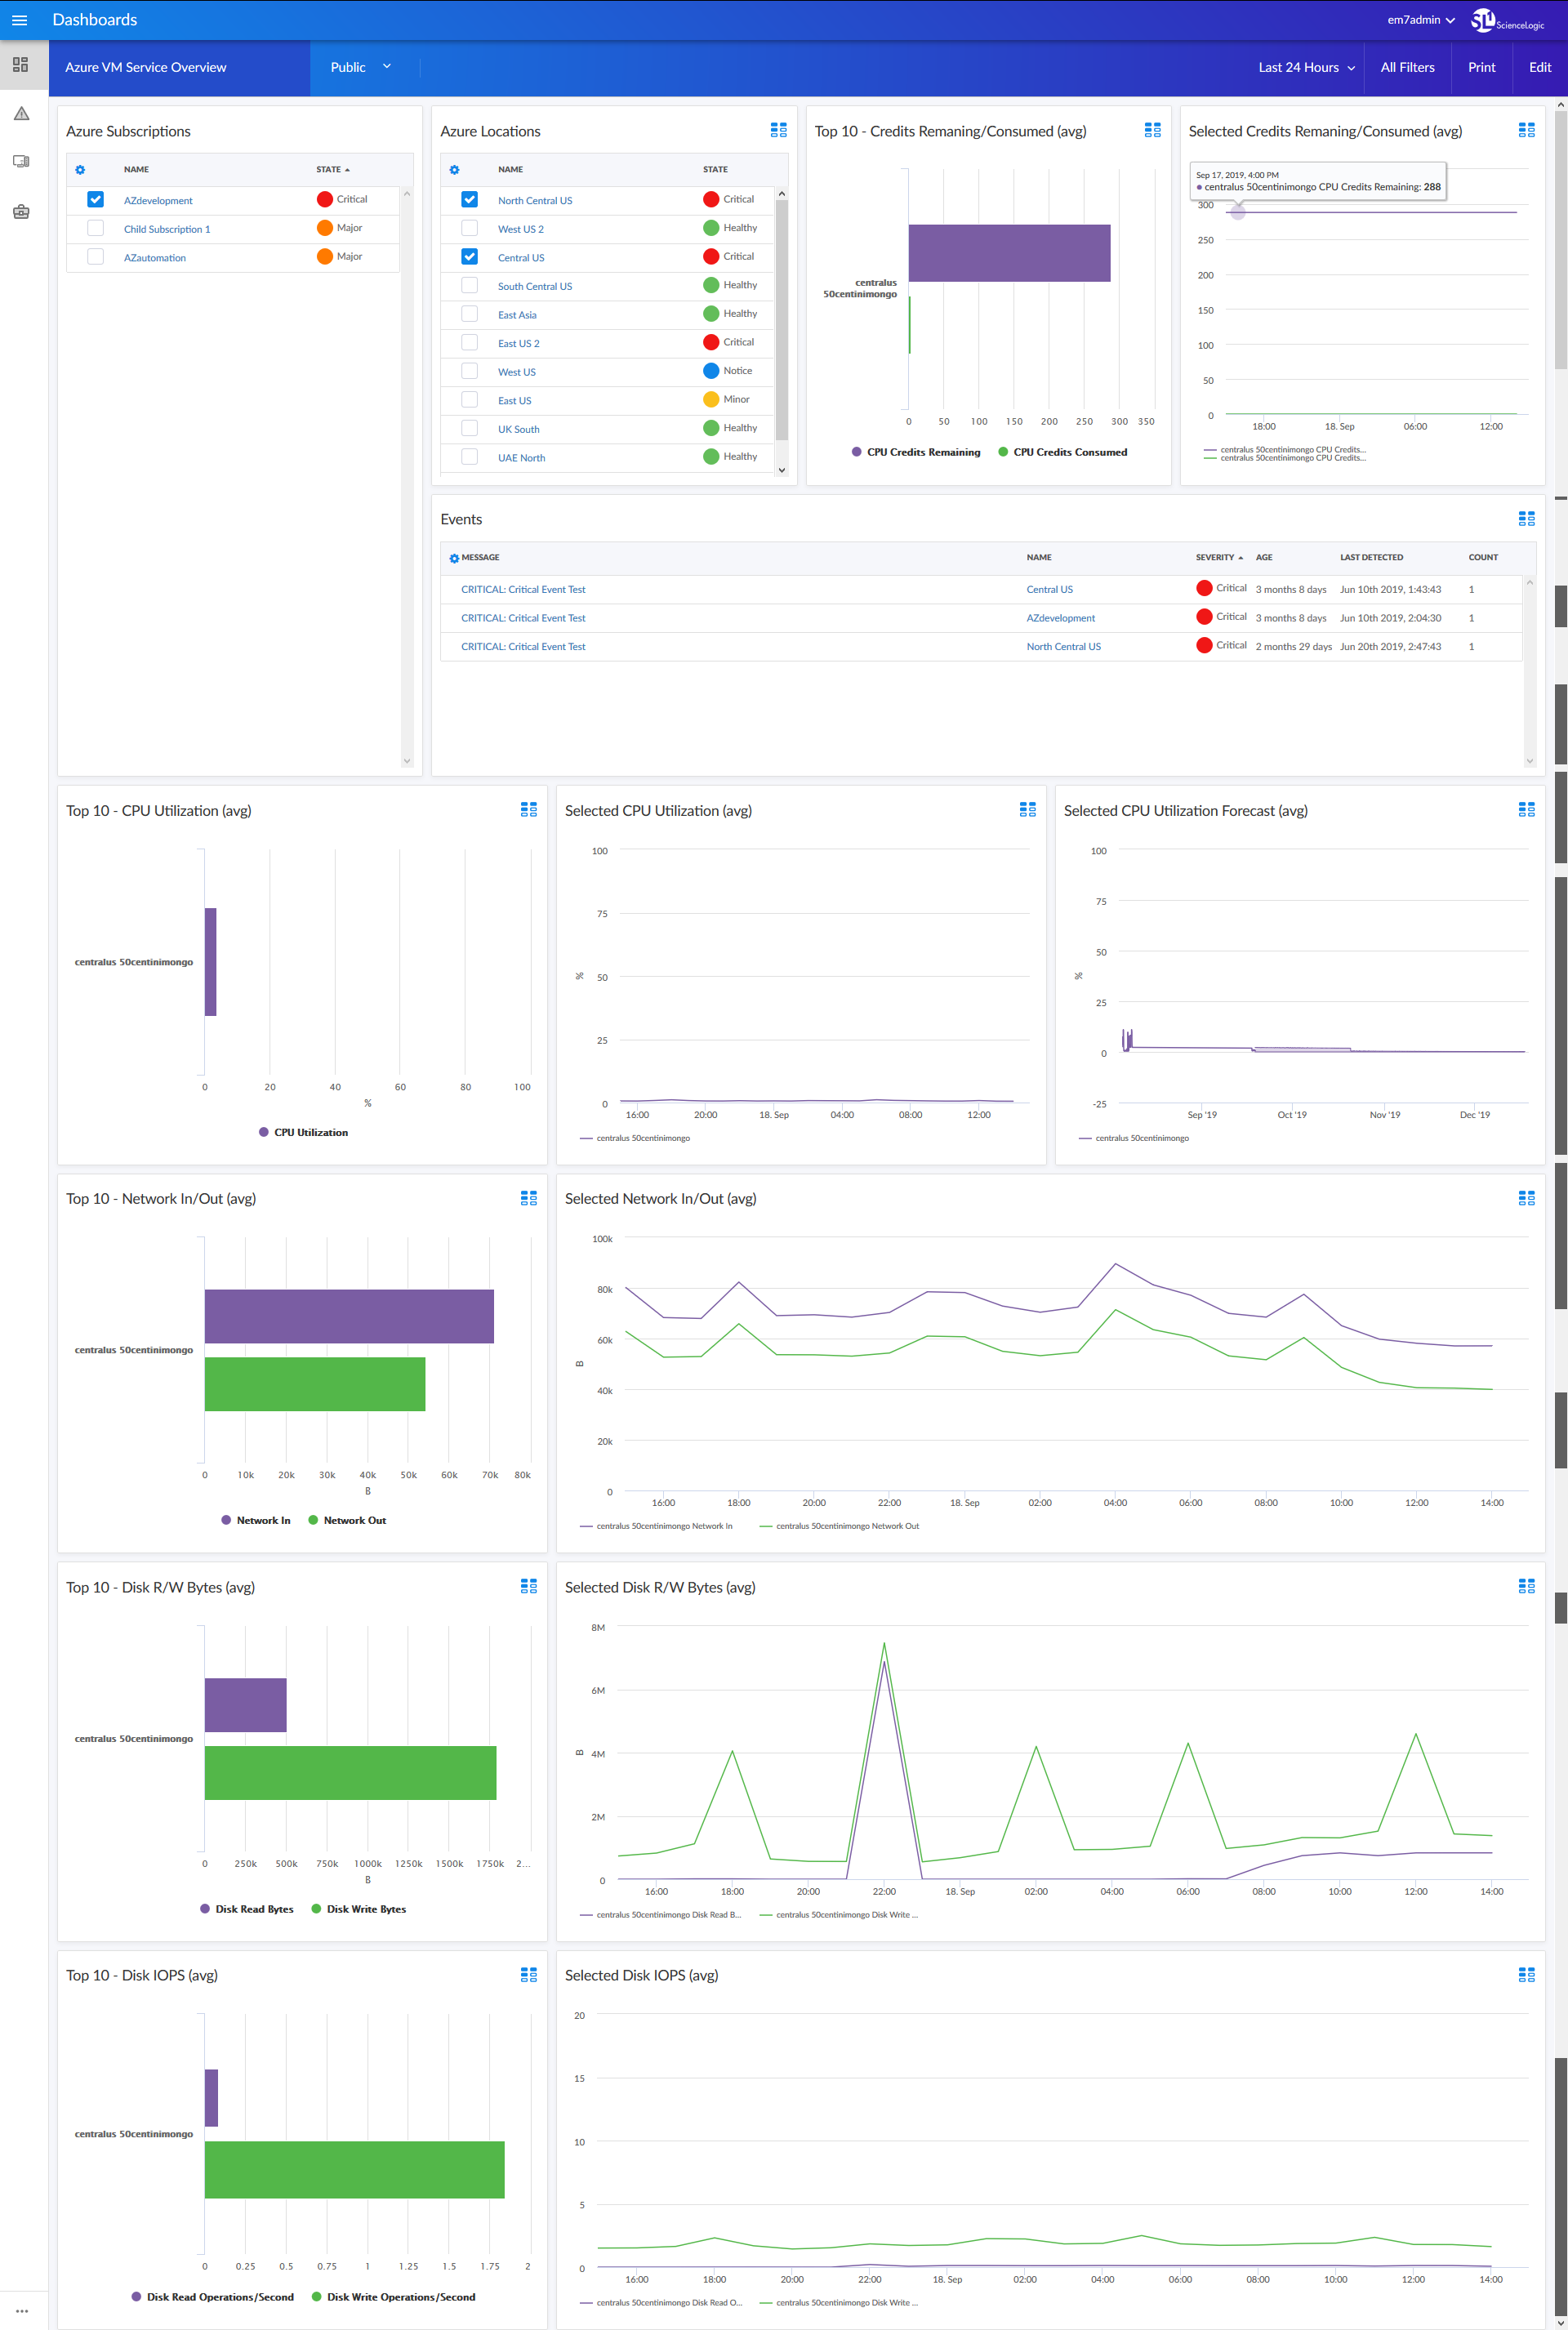
- An "Azure VM Service Overview" dashboard, which includes the following widgets that display overview data about your Microsoft Azure services:
- Azure Subscriptions
- Azure Locations
- Top 10 - Credits Remaining/Consumed (avg)
- Selected Credits Remaining/Consumed (avg)
- Events
- Top 10 - CPU Utilization (avg)
- Selected CPU Utilization (avg)
- Selected CPU Utilization Forecast (avg)
- Top 10 - Network In/Out (avg)
- Selected Network In/Out (avg)
- Top 10 - Disk R/W Bytes (avg)
- Selected Disk R/W Bytes (avg)
- Top 10 - Disk IOPS (avg)
- Selected Disk IOPS (avg)
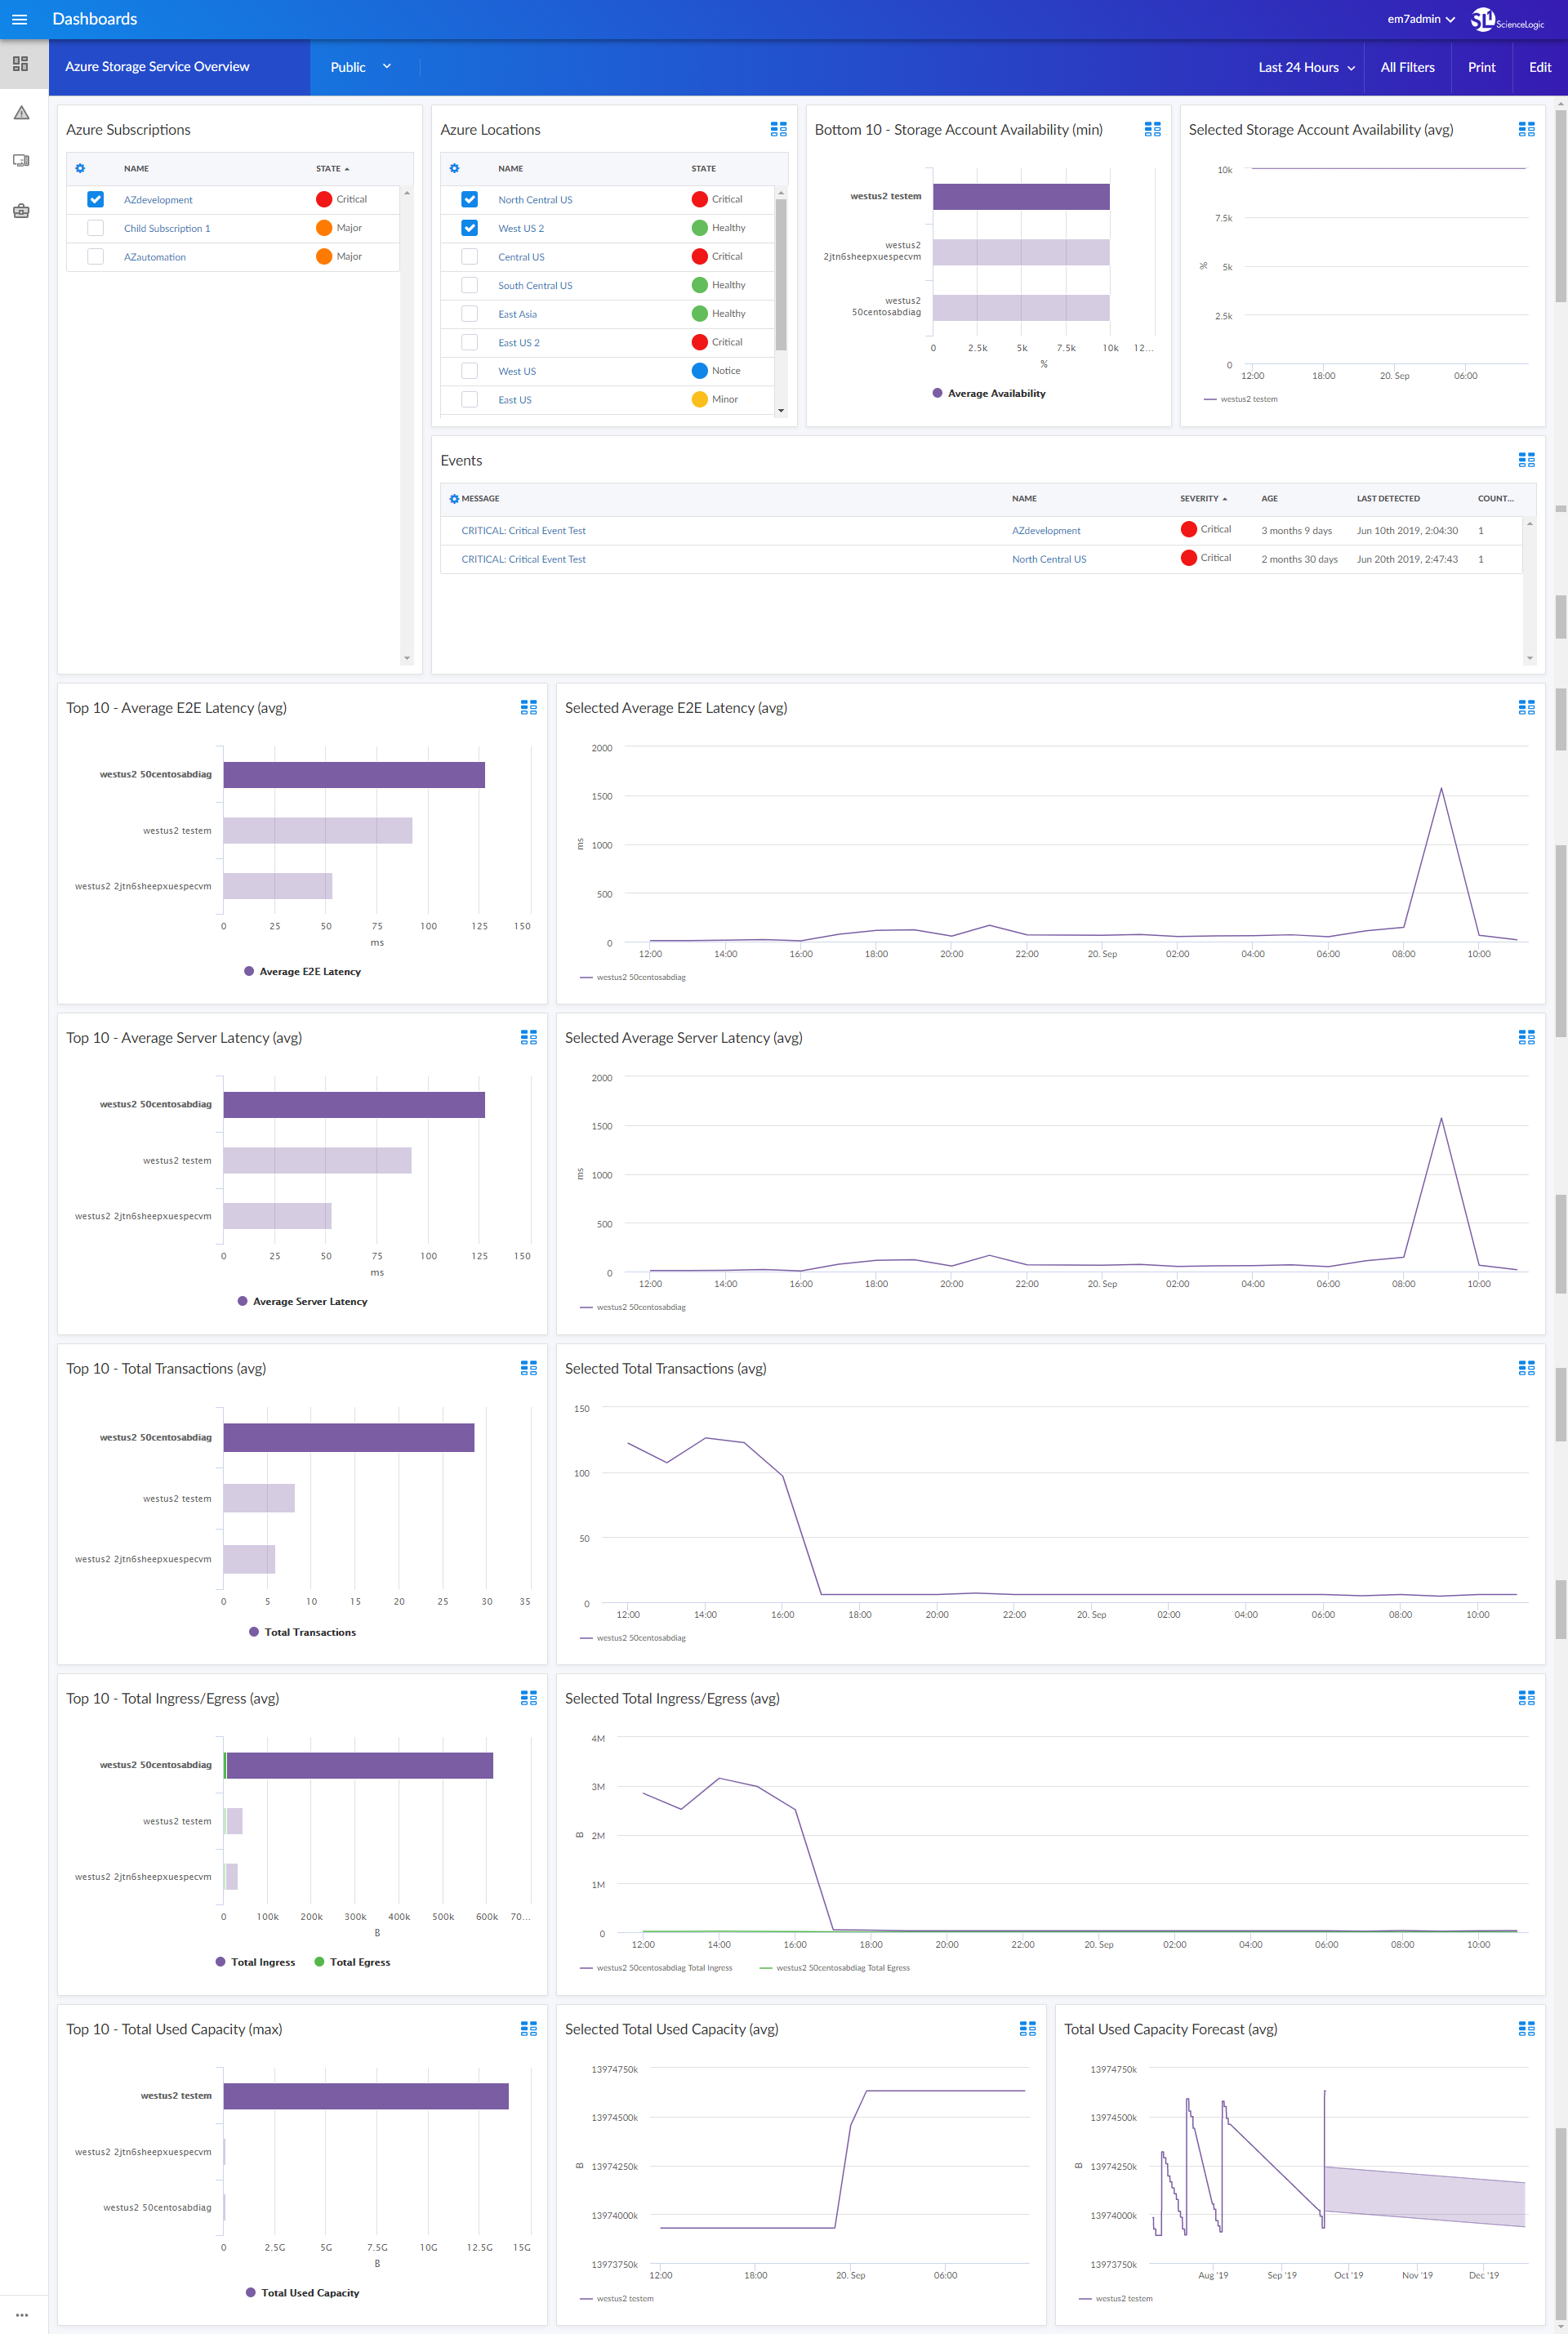
- An "Azure Storage Service Overview" dashboard, which includes the following widgets that display overview data about your Microsoft Azure services:
- Azure Subscriptions
- Azure Locations
- Bottom 10 - Storage Account Availability (min)
- Selected Storage Account Availability (avg)
- Events
- Top 10 - Average E2E Latency (avg)
- Selected Average E2E Latency (avg)
- Top 10 - Average Server Latency (avg)
- Selected Average Server Latency (avg)
- Top 10 - Total Transactions (avg)
- Selected Total Transactions (avg)
- Top 10 - Total Ingress/Egress (avg)
- Selected Total Ingress/Egress (avg)
- Top 10 - Total Used Capacity (max)
- Selected Total Used Capacity (avg)
- Total Used Capacity Forecast (avg)
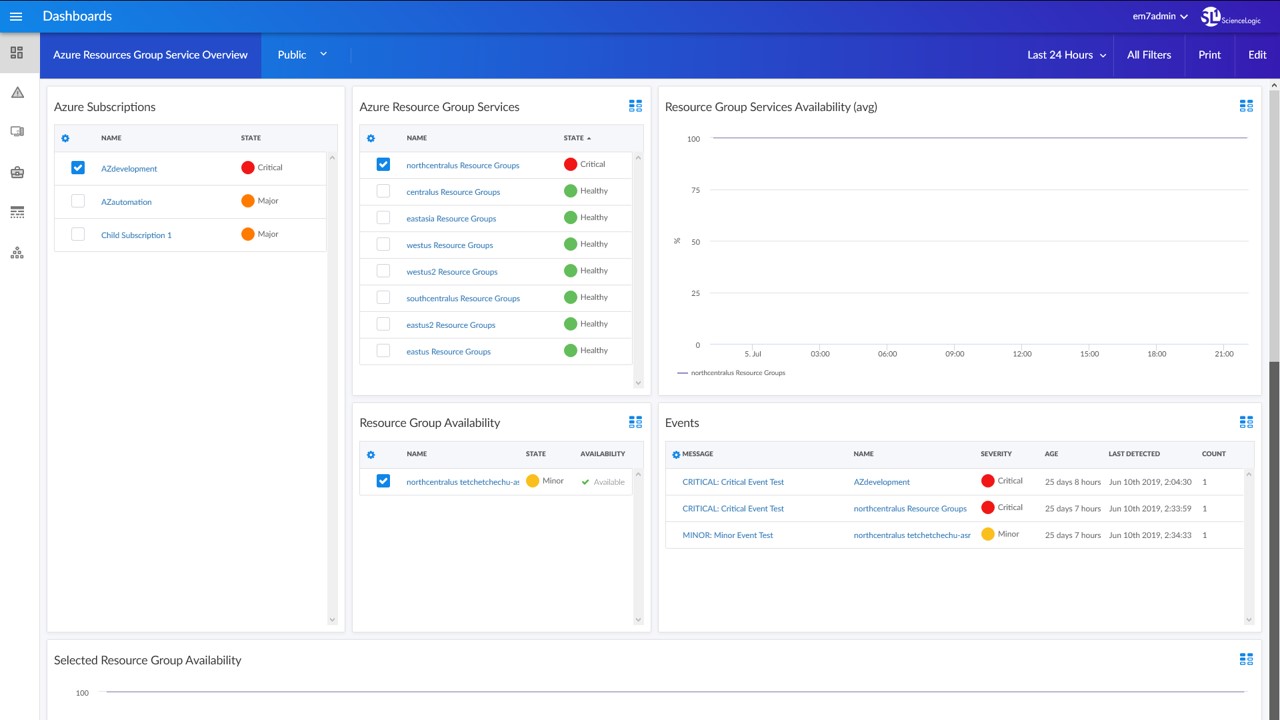
- An "Azure Resources Group Service Overview" dashboard, which includes the following widgets that display overview data about your Microsoft Azure services:
- Azure Subscriptions
- Azure Resource Group Services
- Resource Group Services Availability (avg)
- Resource Group Availability
- Events
- Selected Resource Group Availability
Enhancements and Issues Addressed
The following enhancements and addressed issues are included in version 102 of the Microsoft Azure: SL1 Dashboards PowerPack:
- Autoselect for context-driving widgets has been enabled in all dashboards.
- The Selected Load Balancer SNAT Count Forecast and Selected Load Balancer Network Usage Forecast widgets were added to the "Azure Load Balancer Overview" dashboard.
- The Selected CPU Utilization Forecast widget was added to the "Azure VM Service Overview" dashboard.
- The Total Used Capacity Forecast widget was added to the "Azure Storage Service Overview" dashboard.
- The Selected CPU Utilization Forecast widget was added to the "Azure VM Scale Set Overview" dashboard.
Known Issues
Version 102 of the Microsoft Azure: SL1 Dashboards PowerPack has no known issues.