![]()
This
This
Use the following menu options to navigate the SL1 user interface:
- To view a pop-out list of menu options, click the menu icon (
 ).
). - To view a page containing all the menu options, click the Advanced menu icon (
 ).
).
About This Guide
This guide assumes that the initial installation and configuration (deployment) of SL1 version 8.12.0 or later has been completed. SL1 8.12.0 was the first version of the that included content from both the "new" user interface and the "classic" user interface. For details on the initial configuration of SL1, see the
For the purpose of this guide and the SL1 product documentation in general, the new user interface for SL1 is called the SL1 user interface. The new user interface is also sometimes called ap2, which is short for "Admin Portal version 2". The previous version of the user interface is called the classic user interface in the SL1 product documentation.
New Features in the SL1 User Interface
The following sub-topics provide a very brief overview of each of the new features available in the SL1 user interface. Follow the links for detailed information and procedures for each new feature.
Login Process
In a browser, type the URL or IP address for your SL1 system, and then type the current user name and password you use with SL1. Click Log In.
After you log in, if you can still see the horizontal NavBar or other features of the classic user interface in the SL1 user interface, click in your browser.
For more information, see Logging In and Out of the SL1 User Interface.
Navigation Menus
Starting with the 8.12.0 release of SL1, the SL1 user interface was upgraded to include content from both the "new" user interface (also called "ap2") and the "classic" user interface. This "unified" user interface provides a more streamlined method of navigation that uses two menus: a basic menu and an Advanced menu.
Use the following menu options to navigate the SL1 user interface:
- To view a pop-out list of menu options, click the menu icon () at the top left of any SL1 page. Use the up and down arrow buttons (

 ) to expand and contract the menu options.
 - To view the Advanced Menu page, which contains links to all of the menu options, click the Advanced menu icon () at the bottom left of any SL1 page. Use + in your browser to quickly find a page.
If you are familiar with the classic user interface, the Advanced Menu page will help you get used to the structure of the SL1 user interface.
The name of the SL1 page appears in the title bar of your browser, and the page title also appears in your browsing history to help you navigate through the pages you have visited.
Icons on the Left Navigation Bar
By default, the SL1 user interface displays the following icons, in the following order, on the left navigation bar:
- Dashboards (
 ). Clicking this icon displays the Dashboards page, where you can view and define custom dashboard views. A dashboard view is a page that displays one or more graphical reports, called widgets. Each widget is displayed in its own customizable pane.
 - Events (
 ). Clicking this icon displays the Events page, which displays a list of all active events. An event is a message that is triggered when a specified condition is met. Among other things, an event can signal that a server has gone down, that a device is exceeding CPU or disk-space thresholds, that communication with a device has failed, or simply display the status of a managed entity.
 - Devices (
 ). Clicking this icon displays the Devices page, which allows you to view all of your managed devices in SL1 and also run a discovery to find more devices to monitor. You can select a device from the list on the Devices page to view detailed data on the Device Investigator page for that device.
 - Business Services (
 ). Clicking this icon displays the Business Services page, where you can create and manage business services for your company. Business services let you gauge the availability, health, and risk of your services and the devices that provide those services.
 - Machine Learning (
 ). Clicking this icon displays the Machine Learning page, which lets you enable anomaly detection. You can use machine learning-based anomaly detection to trigger events and automations in SL1. Machine learning-based anomaly detection is available only in SL1 Premium solutions; to upgrade, contact ScienceLogic Customer Support. You might not see this icon if your SL1 system is not configured for anomaly detection.
 - Maps (
 ). Clicking this icon displays the Maps page, where you can view, create, and manage relationship maps for the various elements in your SL1 environment.
To view a pop-out list of additional menu items on the left navigation bar, click the menu icon (![]() ). Click the left arrow icon (
). Click the left arrow icon (![]() ) to close the list of menu items.
) to close the list of menu items.
Icons
The user interface includes many icons for quick and easy access to information. The SL1 user interface uses some of the same icons from the classic user interface along with a set of new icons.
The most common icons in the SL1 user interface include the following:
| New User Interface Icons | Classic User Interface Icons | ||
|---|---|---|---|
|
|
Expand the menu of options in the left navigation bar |
|
Edit an object or policy |
|
|
Open the Advanced Menu page, which contains links to all pages |
|
Delete an object |
|
|
Expand an item in a list or a menu, such as the Event Drawer or the More menu for the Device Investigator page |
|
Access the Device Reports tools |
|
|
Close or collapse an item in a list or a menu |
|
Access the Device Administration tools |
|
|
Open a context-sensitive menu or set of options |
|
View information about an event |
|
|
Open a context-sensitive set of options for a specific item or widget |
|
View information about an object |
|
|
When found on the top left of a list page, open the Select Column menu, where you can add or remove columns from the view |
|
View the Notification Log |
|
|
When found at the end of a row, open a context-sensitive menu or set of options |
|
Access Ticketing tools (often called the "life ring") |
|
|
Select one or more items in a list |
|
Execute (usually Discovery) |
|
|
View masked events on the Event Investigator page |
|
View a report |
|
|
Create an event note |
|
Print a report |
|
|
Refresh the contents of a list |
|
View log entries |
|
|
Close an item or a widget |
|
View the calendar and define or edit a schedule |
|
|
Shows that a command or search is incorrectly formatted or incomplete |
|
Export an object or policy |
|
|
Shows that a command or search is complete and formatted correctly |
|
View raw logs |
Filtering the Tables on Inventory Pages
In SL1, an inventory page is any page (or tab) that contains a table with a list of items that you work with, like the Events page or the Devices page. At the top of most inventory pages in the SL1 user interface are a set of filters for the columns in the table on that page.
On an inventory page, you can start typing filter text or select filter options in one or more of these filters to narrow down the items in the list to just the items you want to view.
As you type text in the Filter field at the top of a column, SL1 starts to filter the list to include only those elements that include your search terms.
For more information, see Filtering Inventory Pages.
Basic Search
At the top of most lists in the SL1 user interface, the Search field lets you look for specific elements in that list. The Search field contains a magnifying glass icon (![]() ) next to the words "Type to search" or "Search".
) next to the words "Type to search" or "Search".
As you type text in the Search field, SL1 filters the list to include only those elements that include your search terms. When searching, SL1 considers all relevant columns for the search, including those that are not currently displayed on the page.
SL1 retains your search criteria on pages in the SL1 user interface even after you refresh the browser or navigate to another page and then return to the search page using the button in the browser.
For more information, see Using Basic Search.
Advanced Search
The SL1 user interface includes an Advanced Search option that lets you use customized search commands to search for data. The syntax for these Advanced Searches can be much more complex than a Basic Search, enabling you to find exactly what you need from a list of items.
Also, because the Basic Search only uses "AND" for multiple search criteria, you need to use an Advanced Search for an "OR" search using multiple search criteria, or if you want to create more complicated searches using Boolean Algebra.
At a minimum, an Advanced Search requires the following components, in the following order:
- A field. The general type of data for which you are searching, such as a device name or an event message.
- An operator. A word or symbol that specifies the relationship between the field and the value, such as equals or less than.
-
A value. A specific aspect or version of the field, such as a name or an amount. If a value is a string, it should be surrounded by "quotation marks" or 'apostrophes'.
As you type your Advanced Search, a red icon (![]() ) or a green icon (
) or a green icon (![]() ) appears at the end of the text field to show that your search is incorrectly or correctly formatted.
) appears at the end of the text field to show that your search is incorrectly or correctly formatted.
To view a list of all possible search commands in an Advanced Search, press + .
Below are simple examples of Advanced Search syntax:
message contains 'risk is high'
organization has (company contains 'system')
attribute has (id = year and value = 2021)
name contains 'web_tier' and deviceClass has (description contains 'AppDynamics')
deviceClass has (description contains 'em7 admin portal')
You can type search commands in the Basic Search field and then click the gear icon (![]() ) and select Advanced to "translate" your basic search into an Advanced Search. You cannot go from an Advanced Search back to a Basic Search, however, without losing your search criteria.
) and select Advanced to "translate" your basic search into an Advanced Search. You cannot go from an Advanced Search back to a Basic Search, however, without losing your search criteria.
For more information, see Performing an Advanced Search.
Bulk Actions in a List View
If a page in SL1 displays a list of items, and that page contains a checkbox (![]() ) to the left of each item in the list, you can select two or more items to perform bulk actions on all of the selected items at the same time.
) to the left of each item in the list, you can select two or more items to perform bulk actions on all of the selected items at the same time.
To select all of the items on a page, click the checkbox at the top of the list. To clear all of the selected items, click the checkbox at the top again.
Pages that contain lists use "infinite scrolling", where the list continues to populate as you scroll toward the bottom of the list. The scrolling stops when you reach the end of the list.
For more information, see Performing Bulk Actions.
Custom Themes for the SL1 User Interface
You can customize the look and feel of your SL1 system by creating new themes. For example, you could create a theme that replaces the SL1 logo with your company's logo and updates the colors used in the user interface to match those used in your company's branding. You can also choose between a light theme or a dark theme.
For more information, see Customizing the SL1 User Interface.
New About and Help Pages
For more information about the components used by SL1, click your user name in the navigation bar at the top of any SL1 page and select About. The About ScienceLogic page appears, displaying the latest version numbers of the components used by SL1.
For product documentation about any page in SL1, click the button at the top right of any page in SL1. A product documentation topic specific to the current page appears in a new browser window:
As of version 8.12.2 of SL1, ScienceLogic no longer updates the help content that appears when you click the button in the classic the user interface. All help content is maintained in the online help, which is located at https://docs.sciencelogic.com.
Click the button on the right side of the window to send comments directly to the ScienceLogic Documentation team, such as reporting typos, inaccuracies, questions, or other comments about that specific page in the Product Documentation.
For more information, see Getting Help and More Information.
Events
The Events page in the SL1 user interface displays a list of currently active events, from critical to healthy. From this page you can acknowledge, clear, and view more information about an event. You can also view events by organization to focus on only the events that are relevant to you.
To navigate to the Events page, click the Events icon (![]() ) on the navigation bar:
) on the navigation bar:
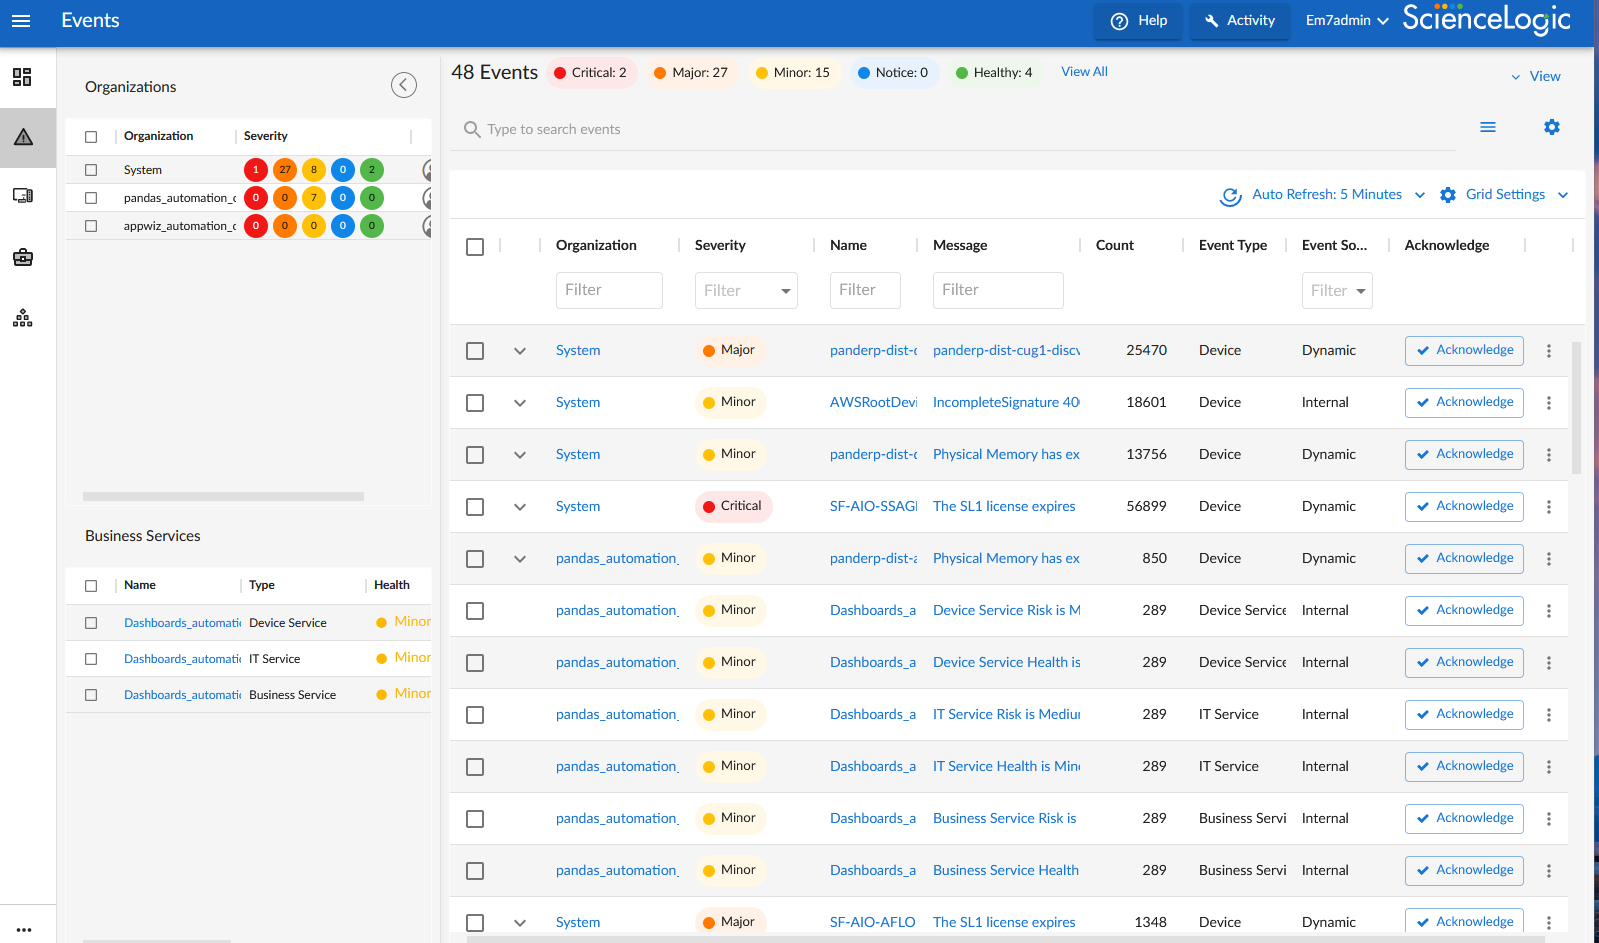
Each event includes a description of the problem, where the problem occurred (device, network hardware, software, policy violation), a pre-defined severity, the time of first occurrence, the time of most recent occurrence, and the age of the event.
For more information, see the Events chapter.
Devices
As part of monitoring your network, SL1 collects data using common networking protocols. Most collected data is associated with a device in SL1. A device in SL1 is a record that can represent physical network hardware, a component of a larger system, or any other entity about which you want to collect data. For example, you might configure a device record that represents a web site or a cloud service.
To navigate to the Devices page, click the Devices icon (![]() ) on the navigation bar:
) on the navigation bar:

SL1 allows you to monitor and manage hardware and applications within your network. SL1 provides a network-wide view through a "single pane of glass." This means that you can monitor status, create policies, define thresholds, and receive notifications, all through a single, browser-based application.
For more information, see the Devices chapter.
Discovery and Credentials
Discovery is the tool that automatically finds all the hardware-based devices, hardware components, and software applications in your network.
You can use the Universal Discovery Framework process in SL1 that guides you through a variety of existing discovery types in additional to traditional SNMP discovery. This process, which is also called "guided discovery", lets you pick a discovery type based on the type of devices you want to monitor. The Universal Discovery workflow includes buttons for the following discovery types: Alibaba Cloud, Amazon Web Services, Microsoft Azure, Citrix, and IBM Cloud. The SNMP Discovery used in the classic user interface is also available, and is sometimes called "unguided" Discovery.
To run a Universal Discovery or an "unguided" Discovery, go to the Devices page (![]() ) and click the button to start the Discovery wizard.
) and click the button to start the Discovery wizard.
Credentials are access profiles (usually username, password, and any additional information required for access) that allow SL1 to retrieve information from devices and from software applications on devices. Discovery uses SNMP credentials to retrieve SNMP information during initial discovery and nightly auto-discovery. If SL1 can connect to a device with an SNMP credential, SL1 deems that device "manageable" in SL1.
To navigate to the Credentials page, go to Manage > Credentials:

For each device, hardware component, or software application the discovery tool "discovers", the discovery tool can collect a list of open ports, DNS information, SSL certificates, list of network interfaces, device classes to align with the device, topology information, and basic SNMP information about the device.
For more information, see Discovery and Credentials.
Dashboards
A dashboard is a page that displays one or more graphical reports, called widgets. These widgets appear in their own pane, and display charts, tables, and text. To define a widget, you first select from a list of pre-defined widget definitions, and then customize what will be displayed by the selected widget by supplying values in the option fields provided by that widget.
To navigate to the Dashboards page, click the Dashboards icon (![]() ) on the navigation bar. The following is an example of a dashboard:
) on the navigation bar. The following is an example of a dashboard:

Access to dashboards is based on your login credentials, so you can view only dashboard data for which you have access. Also, some dashboards might be private instead of public.
If an item name displays as a hyperlink in a dashboard, you can click that link to go to the relevant detail or Investigator page for that item. You can click dashboard links to the Investigator pages for devices, events, and services.
You cannot use dashboards and widgets that were created in the classic user interface in the SL1 user interface.
For more information, see Dashboards.
Business Services
A business service includes one or more technical services that provide value to internal or external customers. Some examples of business services include verifying Internet access or website hosting, online banking, remote backups, and remote storage. Usually a business service includes an associated Service Level Agreement (SLA) that specifies the terms of the service.
Business Services are only available in the SL1 user interface.
To navigate to the Business Services page, click the Business Services icon (![]() ) on the navigation bar:
) on the navigation bar:

You create the following types of services on the Business Services page, in the following order:
- Device Service. Monitors a set of related devices, such as all devices from a specific region.
- IT Service. Monitors a service that IT provides to your organization. An IT service is made up of one or more device services.
- Business Service. Monitors a service your organization provides to your customers. A business service is made up of one or more IT services.
NOTE: Business Services and IT Services created in the classic SL1 user interface are not included in the new Business Services, and "classic" Business Services and IT Services are not related in any way to the new business services, IT services, and device services. For more information about the classic versions, see
For more information, see Business Services.
Machine Learning-based Anomaly Detection
Anomaly detection is a technique that uses machine learning to identify unusual patterns that do not conform to expected behavior.
SL1 does this by collecting data for a particular metric over a period of time, learning the patterns of that particular device metric, and then choosing the best possible algorithm to analyze that data.
SL1 uses the resulting combination of collected data and the auto-selected algorithm to build a model that is unique to that specific device and metric. That model is then used to anticipate the expected behavior for that device metric. Anomalies are detected when the actual collected data value falls outside the boundaries of the expected value range.
SL1 then continuously refines the model as it collects more data.
Anomalies do not necessarily represent problems or events to be concerned about; rather, they represent unexpected behavior that you might want to investigate.
To navigate to the Machine Learning page, click the Machine Learning icon (![]() ) on the navigation bar:
) on the navigation bar:

Anomaly detection and the Machine Learning page are only available in the SL1 user interface.
For more information, see
Maps
A map is a visual representation of the various devices and related elements, also called nodes, in your environment that have been discovered by SL1. A map displays the important details about the nodes, their hierarchy, and the relationships associated with those nodes.
To view a map, click the Maps icon (![]() ) on the navigation bar, and then click the name of the map from the Maps page. The following is an example of a map that displays device components and business services:
) on the navigation bar, and then click the name of the map from the Maps page. The following is an example of a map that displays device components and business services:

Maps can display business services, component maps (DCM, DCM+R), CDP topology, LLDP topology, Layer-2 topology, Layer-3 topology, and Virtual Infrastructure (VMware and virtual machines). You can also create your own maps with your most important devices, and add images, text, and shapes to customize your maps.
Maps are only available in the SL1 user interface. They are directly related to "Classic Maps", which were called "Views" in the classic user interface. You can view HTML (non-Flash) versions of these Maps on the Classic Maps page (Maps > Classic Maps).
For more information, see