![]()
The Device Investigator page provides a view of detailed data for a specific device. This
Use the following menu options to navigate the SL1 user interface:
- To view a pop-out list of menu options, click the menu icon (
 ).
). - To view a page containing all the menu options, click the Advanced menu icon (
 ).
).
The following video provides an overview of the Device Investigator page:
This
What is the Device Investigator?
The Device Investigator displays a customizable, detailed set of data about a specific device.
From the Devices page, click the name of a particular device to open the Device Investigator page for that device:

The tabs on the Device Investigator page provide access to all of the data associated with the device. The tabs are similar to the tabs on the Device Administration and Device Properties panels in the classic SL1 user interface.
Only tabs relevant to the selected device are available on the Device Investigator page. For example, the and tabs do not display if the selected device does not use agents or interfaces. Also, widgets on the tab display as "Empty" where no metrics exist for that widget.
The Device Investigator page can include the following menus and buttons:
-
- Report. This button lets you generate a detailed report on the device.
- Tools. This button opens the Activity Center, where you can run a set of diagnostic tools or user-initiated actions, or to click on custom links that will open in a separate browser window.
The Device Investigator page contains the following tabs:
- Investigator. Displays panels that provide basic information and metric data about a device. For most devices, the default panels include an Overview panel, Events, Logs, Availability, and combined charts for metrics such as utilization, discards, and errors. You can customize the panel layout on this page to meet your specific business needs, including select additional metrics to display.
- Settings. Lets you manage your preferences for that device, such as whether to auto-clear events, accept all logs, run daily port scans, and more. You can also set user maintenance preferences and disable or enable collection on that device.
- Attributes. Lists the custom descriptive fields that are currently aligned with this device. On this tab, you can add and remove extended custom attributes to this device.
- Changes. Displays active and cleared Change Events for a device.
- Collections. Lets you align or un-align Dynamic Applications with this device, enable or disable collection for the Dynamic Applications, and run a Dynamic Application. You can also change credentials and update the poll frequency for a Dynamic Application.
- Configs. Displays configuration information collected from the device by Dynamic Applications. If this device does not have any configuration data, this tab does not appear.
- Events. Displays a list of active and cleared events for the device. You can acknowledge events from this tab and add event notes.
- Interfaces. Displays information about the interfaces used by the device. If this device does not use interfaces, this tab does not appear.
- Journals. Displays journal entry information collected from the device by Dynamic Applications.
- Logs. Displays all of the messages SL1 and the SL1 Agent, if applicable, have collected from the device.
- Machine Learning. Displays a list of machine learning metrics that are enabled for the device.
- Map. Opens a map of that device and the devices it is related to (for systems that have the Maps page enabled).
- Monitors. This tab lets you define monitoring policies for the device.
- Notes. Displays notes and attachments associated with the device. You can also edit and create notes.
- Ports. Displays a list of all open ports on the device.
- Processes. Displays a list of system processes running on the device.
- Redirects. Allows you to redirect logs entries from an IP-based device to the current device. This is most useful when the current device is a virtual device, but you can also redirect log entries from one IP-based device to another IP-based device.
- Relationships. Displays information about parent-child relationships between devices.
- Schedules. Allows you to view and manage all the scheduled processes you have defined in your system.
- Software. Displays a list of all the software installed on the device.
- Thresholds. Lets you define space and performance thresholds for a device.
- Tickets. Displays all open, pending, or working tickets associated with the device.
- More. This drop-down lets you select additional tabs to display on the Device Investigator page by clicking the star icon next to the tab name. You can search for specific items on a tab, such as Device Class, Uptime, or Category, and the relevant tab will appear in the search results. You can also remove a tab by clicking the star icon again, turning it from blue to white. Your tab selections are saved and remain in place even after you log out:
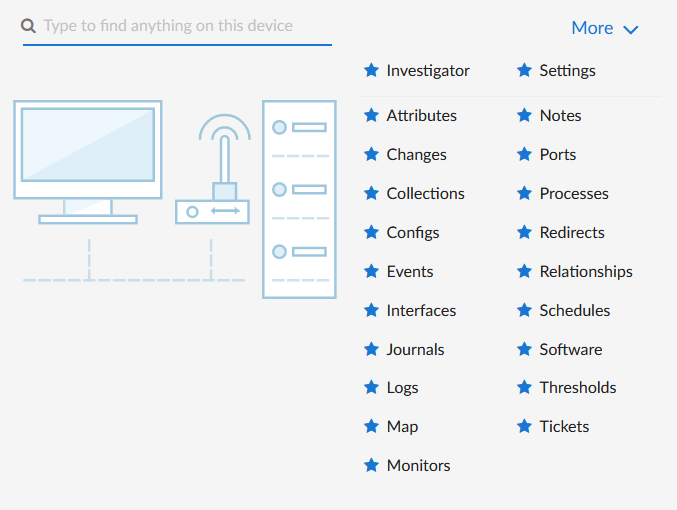
Click the forward-slash button (/) to open the More drop-down. You can highlight search results using the Up and Down Arrow keys on your keyboard, and select a result by pressing Enter. To close the drop-down, click the word More.
Using the Info Drawer on the Device Investigator Page
On the Device Investigator page, you can view read-only information about the device in the Info drawer:

The Info drawer displays the following information for the device:
- Status. The status of the device.
- Collector. The Collector Group that was last used to collect data from the device. For All-In-One Appliances, this field will contain the name of the default, built-in Collector Group.
- Collecting. Indicates that the device collection is "Collecting" with a green check mark icon (
 ), meaning SL1 is periodically collecting data from the device, or "Not Collecting" with a prohibition icon (
 ), meaning the SL1 is not currently collecting data from the device.
- IP. IP address of the device.
- Organization. The organization to which this device belongs. Click the organization name to view a detail page for the organization.
- Device Class. Device class for the device. A device class usually describes the manufacturer of the device.
- Category. The device category associated with the device. The device category usually describes the primary function of the device, such as a "server", "switch", or "router".
- Device Type. Specifies whether the device is a physical device or a virtual device.
- Collection Time. Date and time of the most recent collection.
- Uptime. The number of days and hours that the device has been continuously up and communicating with SL1.
- More Attributes. This lower section lists any custom attributes that might be aligned with this device.
Running a Device Report
On the Device Investigator page for a specific device, you can generate a detailed report on that device. You can specify the information to include in the report and the format that SL1 will use to generate the report, including HTML, PDF, XLS, and more.
- On the Device Investigator page, click the button in the top navigation bar. The Device Report modal page appears.
- In the Type drop-down, select the type of report you want to generate. Your options include:
- . Includes information about device status, status of all device policies, status of all monitors, status of hardware components, status of all thresholds defined for the device, a list of all active events associated with the device, and information about the last collection time and last entry to the device log.
- . Includes information about device status, status of all monitors, status of hardware components, status of all thresholds defined for the device, and information about the last collection time and last entry to the device log.
- . Includes status of all monitors, status of all thresholds defined for the device, and information about the last collection time and last entry to the device log.
- . Includes contact information for the device's organization and contact information for all vendors and warranty or support accounts.
- . Includes overview of hardware components for the device.
- . Includes all notes created in the Notepad Editor page.
- . Displays a list of software installed on the device.
- . Displays a list of all processes running on the device.
- . Includes information about network ports and network configuration.
- . Includes a list of all active events associated with the device.
- . Includes information about device status, status of all monitors, status of all Dynamic Applications associated with the device, status of all thresholds defined for the device, and a list of all active events associated with the device.
- In the Format drop-down, select the format for the report. Your options include:
- HTML. Create the report as an HTML document.
- PDF. Create the report as a PDF document.
- DOC. Create the report as a Microsoft Word document.
- XLS. Create the report as Microsoft Excel spreadsheet.
- CSV. Create the report using comma-separated values.
- Click to generate the report.
Using Device Tools in the Action Runner
On the Device Investigator page, you can click the Tools menu to display the Action Runner. The Action Runner enables you to run a set of diagnostic tools or user-initiated actions, or to click on custom links that will open in a separate browser window.
NOTE: The tools and actions that are available in the Action Runner are based on the device type and your user permissions, as determined by your organization assignment and access hooks. For example, if a device does not have an IP address, only the Availability tool will be available.
NOTE: For more information about user-initiated actions, see
To use the Action Runner:
- Access the Action Runner for devices in one of the following ways:
- On the Devices page, open the Device Drawer for a particular device. Click the search bar in the Tools pane.
- On the Device Investigator page, click the button in the top navigation bar.
- Click in the navigation bar at the top of any page in SL1. Click the search bar.
- When you click the search bar, a list appears of the default tools, actions, or custom links that are available for the selected device. Click one of these tools, actions, or custom links, or use the search bar to search for a tool or action that is not listed. The following default tools are available in the Action Runner:
- Availability. Displays the results of an availability check of the device, using the port and protocol specified in the Availability Port and Availability Protocol fields on the tab for this device.
- Ping. Displays statistics returned by the ping tool. The ping tool sends a packet to the device's IP address (the one used by SL1 to communicate with the device) and waits for a reply. SL1 then displays the number of seconds it took to receive a reply from the device and the number of bytes returned from the device. If the device has an IPv6 address, SL1 uses the appropriate IPv6 ping command.
- Who Is. Displays information about the device's IP, including the organization that registered the IP and contacts within that organization.
- Port Scan. Displays a list of all open ports on the device at the time of the scan.
- Deep Port Scan. Displays a list of all open ports and as much detail about each open port as the deep port scanner can retrieve.
- ARP Lookup. Displays a list of IP addresses for the device and the resolved Ethernet physical address (MAC address) for each IP address.
- ARP Ping. Displays the results from the ARP Ping tool. The ARP Ping tool is similar in function to ping, but it uses the ARP protocol instead of ICMP. The ARP Ping tool can be used only on the local network.
- Trace Route. Displays the network route between SL1 and the device. The tool provides details on each hop to the endpoint. If the device has an IPv6 address, SL1 uses the appropriate IPv6 traceroute command.
The tools found in the Action Runner can also be found in the Device Toolbox in the classic SL1 user interface.
- If you clicked a custom link, the link opens in a new browser window. If you clicked on a tool or action, then as it runs, its progress and results appear in a log in the Activity Center.
- After the tool or action has run, if you want to run it again, click the button. This button appears only for activities completed during your current session.
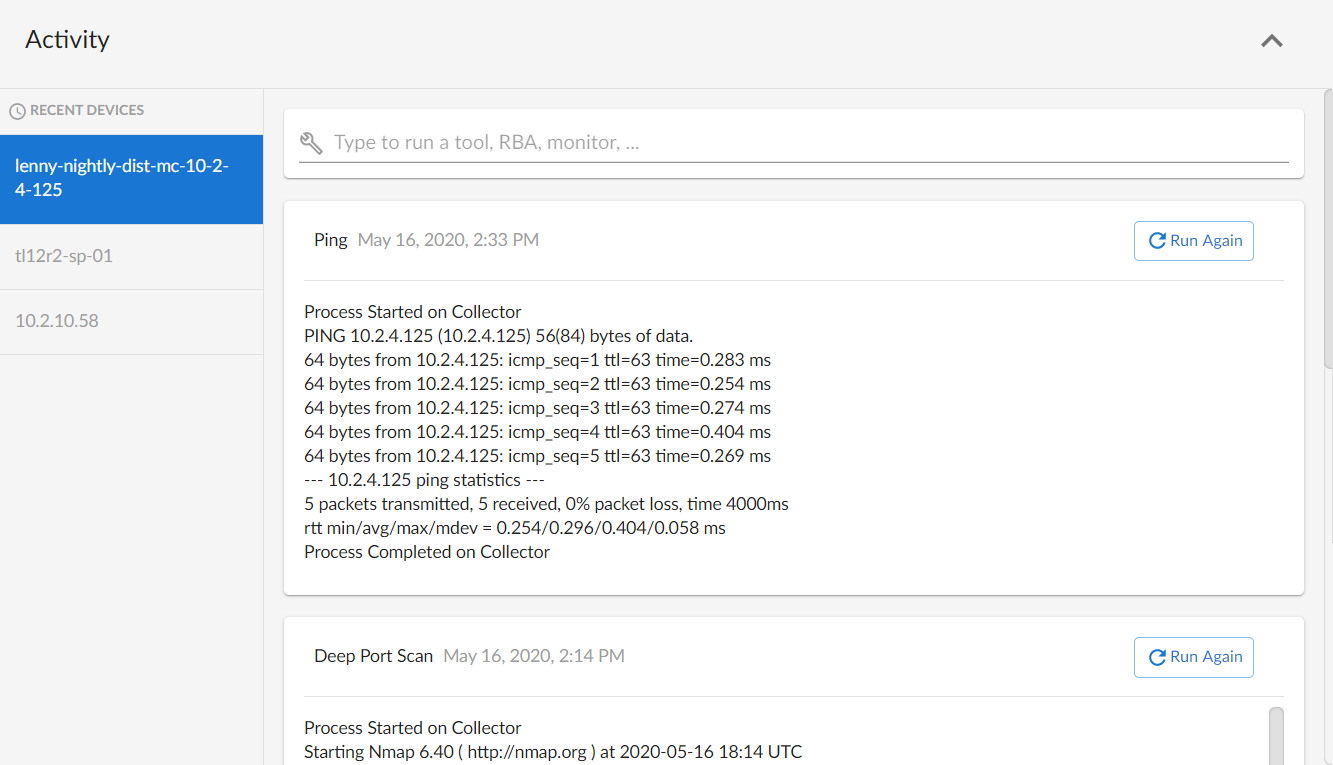
The left pane of the Activity Center displays a list of devices for which you have most recently used the Action Runner, with the current device at the top of the list. To use the Action Runner for any of the other recently used devices or to view historical logs for the tools or actions that have been run on those devices, click on the device name.
Overview of the Device Investigator Tabs
The following section provides an overview of how to use the tabs on the Device Investigator page for a selected device.
The Investigator Tab
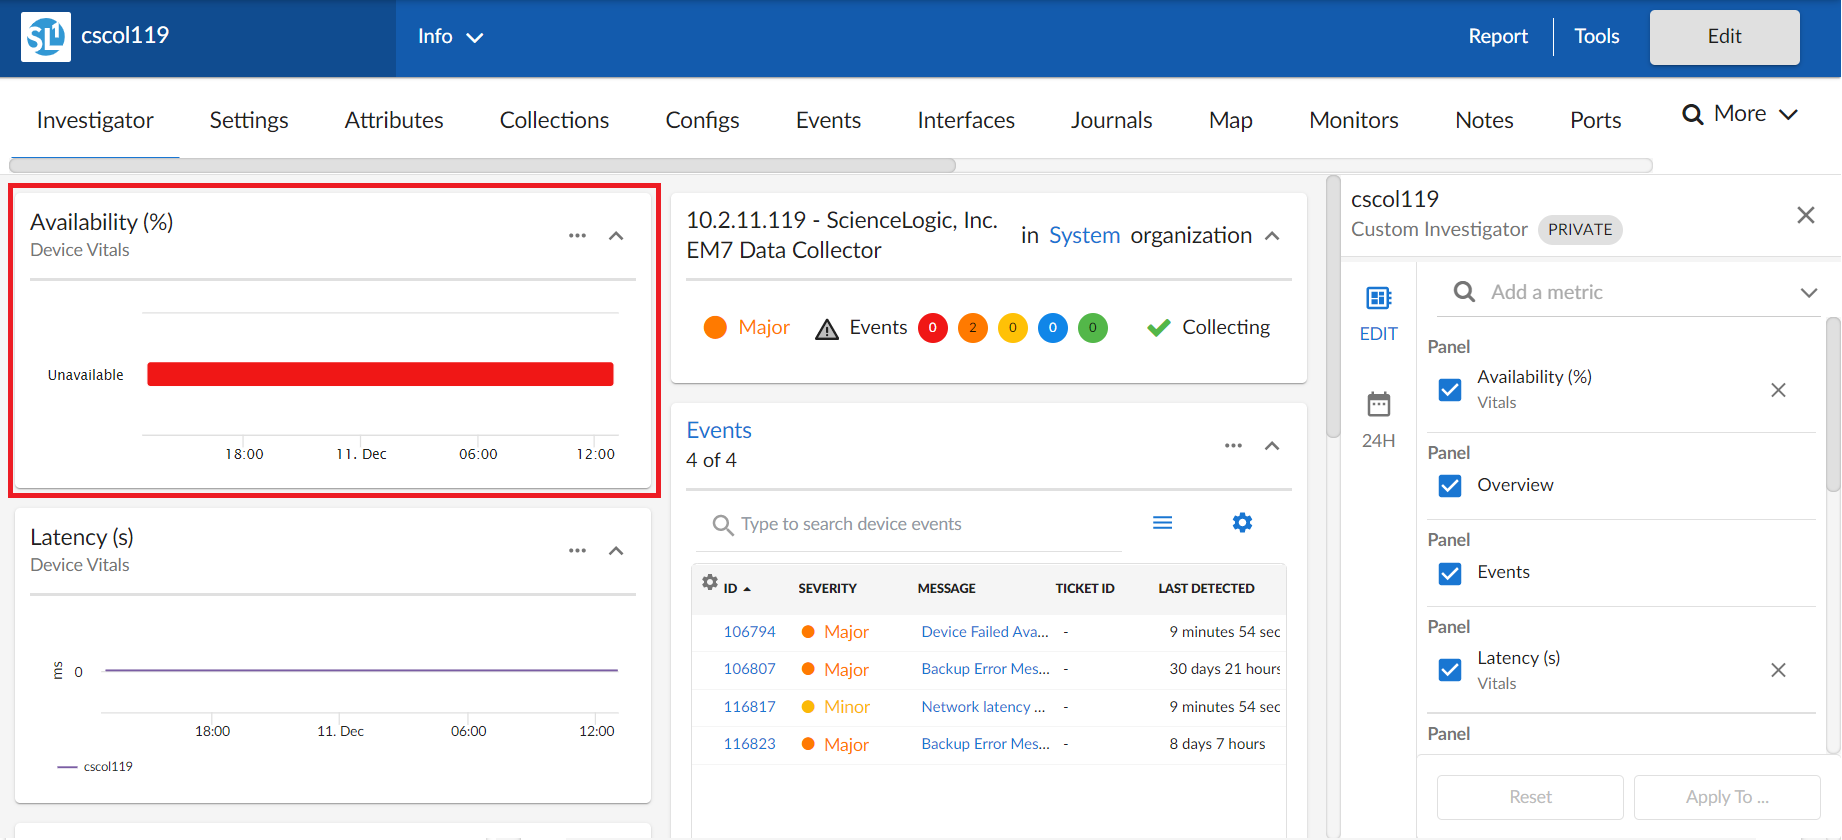
The tab of the Device Investigator page displays a customizable set of metrics about the selected device.
The device type determines which metrics appear in the tab. For most devices, the following panels and metrics appear by default:
- Overview. Displays a panel that includes basic information about the device, including its IP address, Device Class, organization, current state, event count, and collection status.
- Events. Displays a panel with the list of events aligned with this device. In the right-hand pane, you can click the ID or Message field to view the Event Investigator page for that event.
- Availability. Displays a panel for the device's availability over time. Availability means a device's ability to accept connections and data from the network.
- Latency. Displays a panel for latency for the device over time, in milliseconds. Latency means the amount of time it takes SL1 to communicate with the device.
- Map. Displays a panel with a map of the device and all of the devices with which the device has relationships. You can also click the Map panel heading to go to the tab for that device. This panel is disabled by default, but can be enabled by clicking the button, and then selecting the Map checkbox.
- CPU Utilization, Physical Memory Utilization, and Swap Memory Utilization. Displays a combined chart panel with the percentage of CPU, physical memory, and swap memory used by the device over time.
- Utilization In and Out. Displays a combined chart panel with the percentage of utilization in and out for the device's network interfaces.
- Discards In and Out. Displays a combined chart panel with the number of discards in and out for the device's network interfaces over time.
- Errors In and Out. Displays a combined chart panel with the number of errors in and out for the device's network interfaces over time.
- Logs. Displays a panel with a list of the logs for the device, sorted from newest to oldest by default. You can use the Search field to search device logs for specific event messages, event IDs, date ranges, source types, and other relevant text for troubleshooting. You can also click on the column headers for Date/Time, Source, Event ID, Severity, and Message to sort by that column.
You can customize the look and feel of the tab by contracting, expanding, and resizing panels as needed. Click the contract icon (![]() ) in the panel header to display only the header or click the expand icon (
) in the panel header to display only the header or click the expand icon (![]() ) to display the panel's full contents. Click the Actions icon (
) to display the panel's full contents. Click the Actions icon (![]() ) in the panel header and then select Small, Medium, or Large to resize the panel.
) in the panel header and then select Small, Medium, or Large to resize the panel.
You can customize the appearance of leaderboard panels for interfaces, file systems, and Dynamic Applications in the tab. Click the Leaderboard Bar Chart icon (![]() ) to switch from a bar chart to a line chart, or click the Line Chart icon (
) to switch from a bar chart to a line chart, or click the Line Chart icon (![]() ) to switch from a line chart to a leaderboard bar chart.
) to switch from a line chart to a leaderboard bar chart.
The tab panel layout is responsive. Panels are automatically resized or relocated whenever a panel is added or removed, the panels are rearranged on the page, or the browser page increases or decreases in size.
The Device Investigator page also includes the following sidebar buttons:
- Edit. Click the button on the right panel to edit the content that appears on the tab and its layout. For example, you can add or remove metrics, edit the metric panel order, or combine charts on the tab.
- Timespan. Click the timespan button on the right panel to adjust the timespan of data that appears in all of the metric panels on the tab. The default timespan is Last 24 Hours.
Select the Always display raw data checkbox at the top of the timespan selector to ensure that the metric data that appears in the panels on the tab always includes the most recent data available. If you do not select that checkbox, SL1 will still display raw data when you select a timespan of less than 2 days, but will automatically display rolled up hourly data for timespan selections of 2-45 days and rolled up daily data for timespan selections of more than 45 days.
Adding and Removing Metrics on the Investigator Tab
Optionally, you can add metrics to the tab for Dynamic Applications, interfaces, and the SL1 Agent (if applicable), among other things. You can also remove metrics from the tab.
To add and remove metrics on the tab:
- To add a metric panel that is not currently on the tab, click the button on the right sidebar to expand the layout panel, and then click the Add a metric field. A list of metrics appears:

- Select a metric from the list, or type the name of a metric and select it from the list. The metric is added to the right pane, and a corresponding widget appears in the left pane.
- Some metrics might require you to make additional selections, such as the network interfaces associated with a device. Click the field and add one or more additional metrics, as needed.
You can select up to eight additional metrics per widget.
- To remove a metric panel from the tab, uncheck the corresponding box in the right panel. The metric remains listed in the right panel, but the panel is removed from the tab.
- To completely remove the metric and its corresponding panel from the tab, click the button (
 ) for that metric in the right panel.
The tab retains any changes you made to the set of device metrics displayed for each device, on a per-user basis. To reset these changes to their default settings, click the button at the bottom of the right panel. Optionally, you can apply these changes to other Device Categories, Device Classes, or devices. For more information, see the section on Applying a Custom Device Investigator Layout to Other Devices.
Editing the Metric Panel Order on the Investigator Tab
On the tab of the Device Investigator page, the order in which the metric panels appear in the right panel when you click the button mirrors the order in which the corresponding metric panel widgets appear in the left panel. You can drag and drop the panels up or down in the right panel to edit the order in which the metric panels appear on the left panel. This enables you to prioritize the information that appears on the page.
To edit the order in which widgets appear on the tab:
- On the tab of the Device Investigator page, click the button on the right sidebar to expand the layout panel.
- Hover your mouse over the "Panel" heading of the panel that you want to move until you see an open hand icon appear:
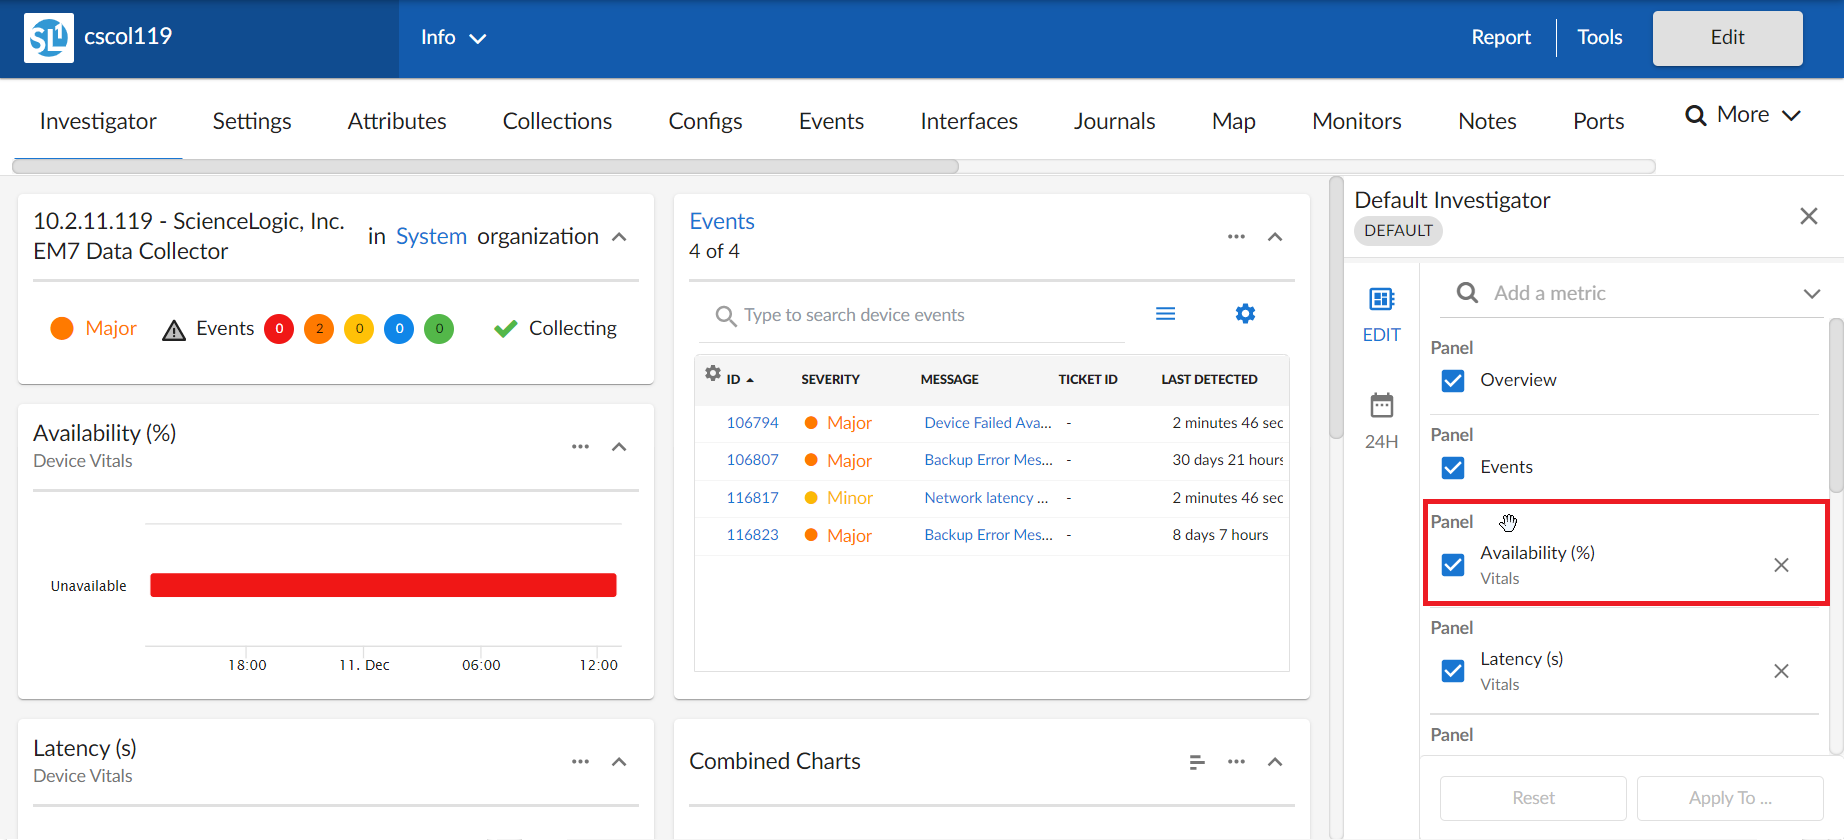
- Click and hold down the left button on your mouse to grab the panel, and then use your mouse to drag the panel to a different location in the list. When you do so, the open hand icon becomes a closed hand icon, and a blue dotted box appears around the panel.
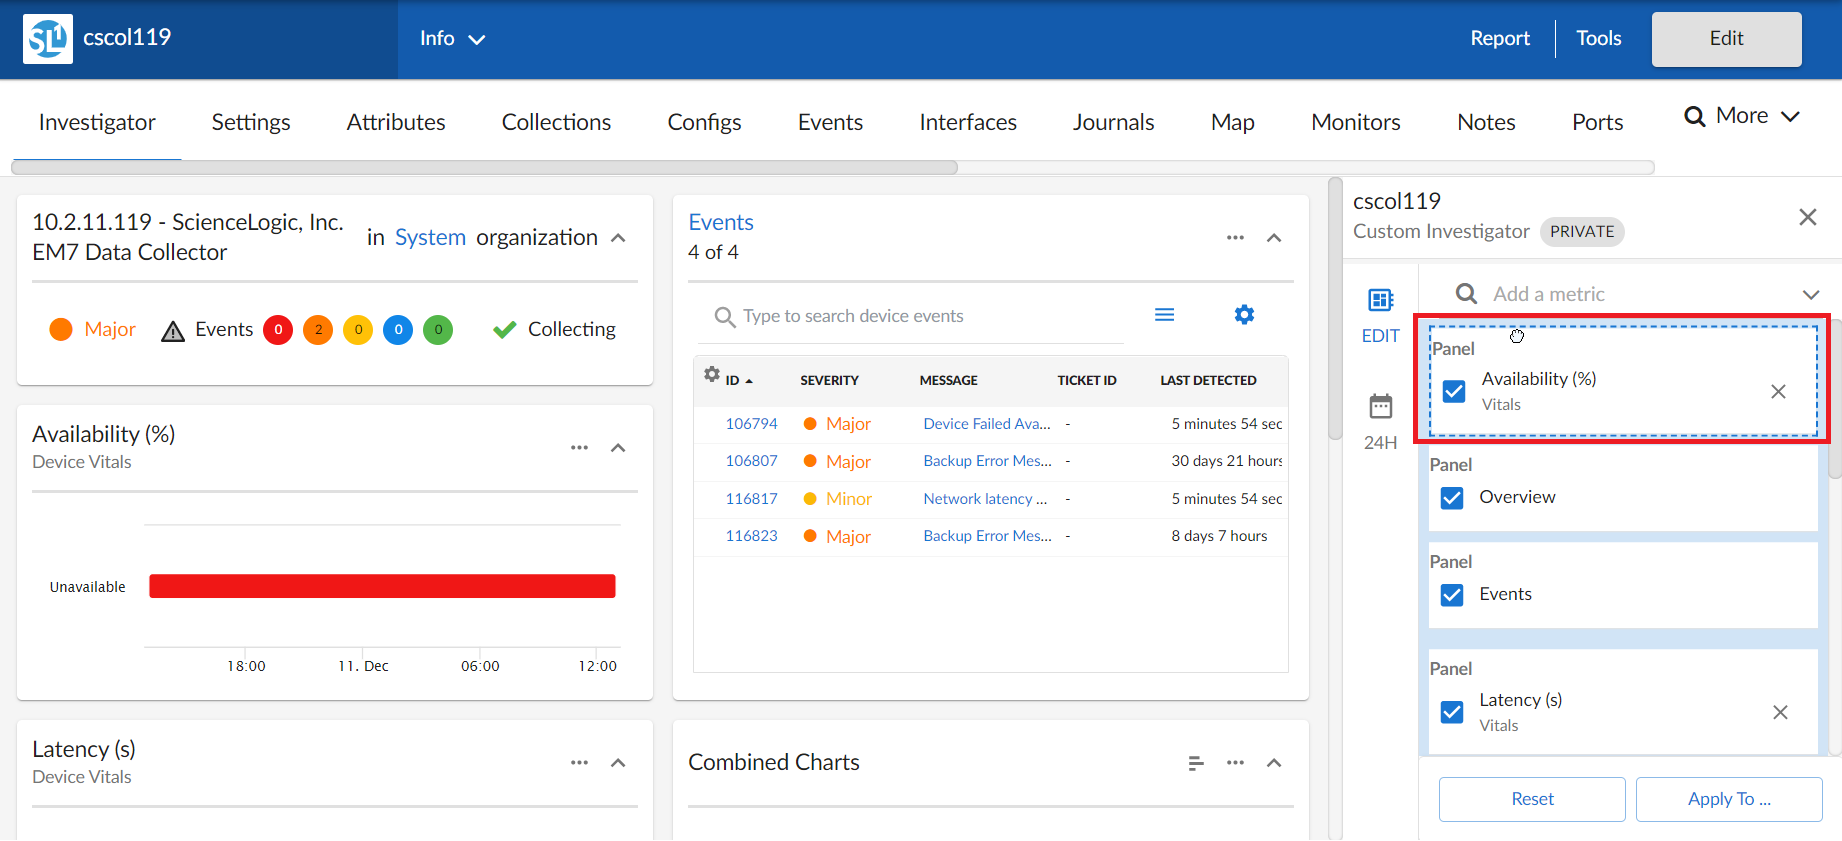
- Release the left mouse button to drop the panel in your desired location. The new right-hand panel order will be reflected in the left-hand widget panel.
The tab retains any changes you made to the set of device metrics displayed for each device, on a per-user basis. To reset these changes to their default settings, click the button at the bottom of the right panel. Optionally, you can apply these changes to other Device Categories, Device Classes, or devices. For more information, see the section on Applying a Custom Device Investigator Layout to Other Devices.
Combining Charts on the Investigator Tab
On the tab of the Device Investigator page, you can combine charts for different time-series metrics to see all of the combined data for those metrics in a single chart.
To combine charts:
- On the tab of the Device Investigator page, click the button on the right sidebar to expand the layout panel.
- Hover your mouse over a time-series metric name until you see an open hand icon appear.
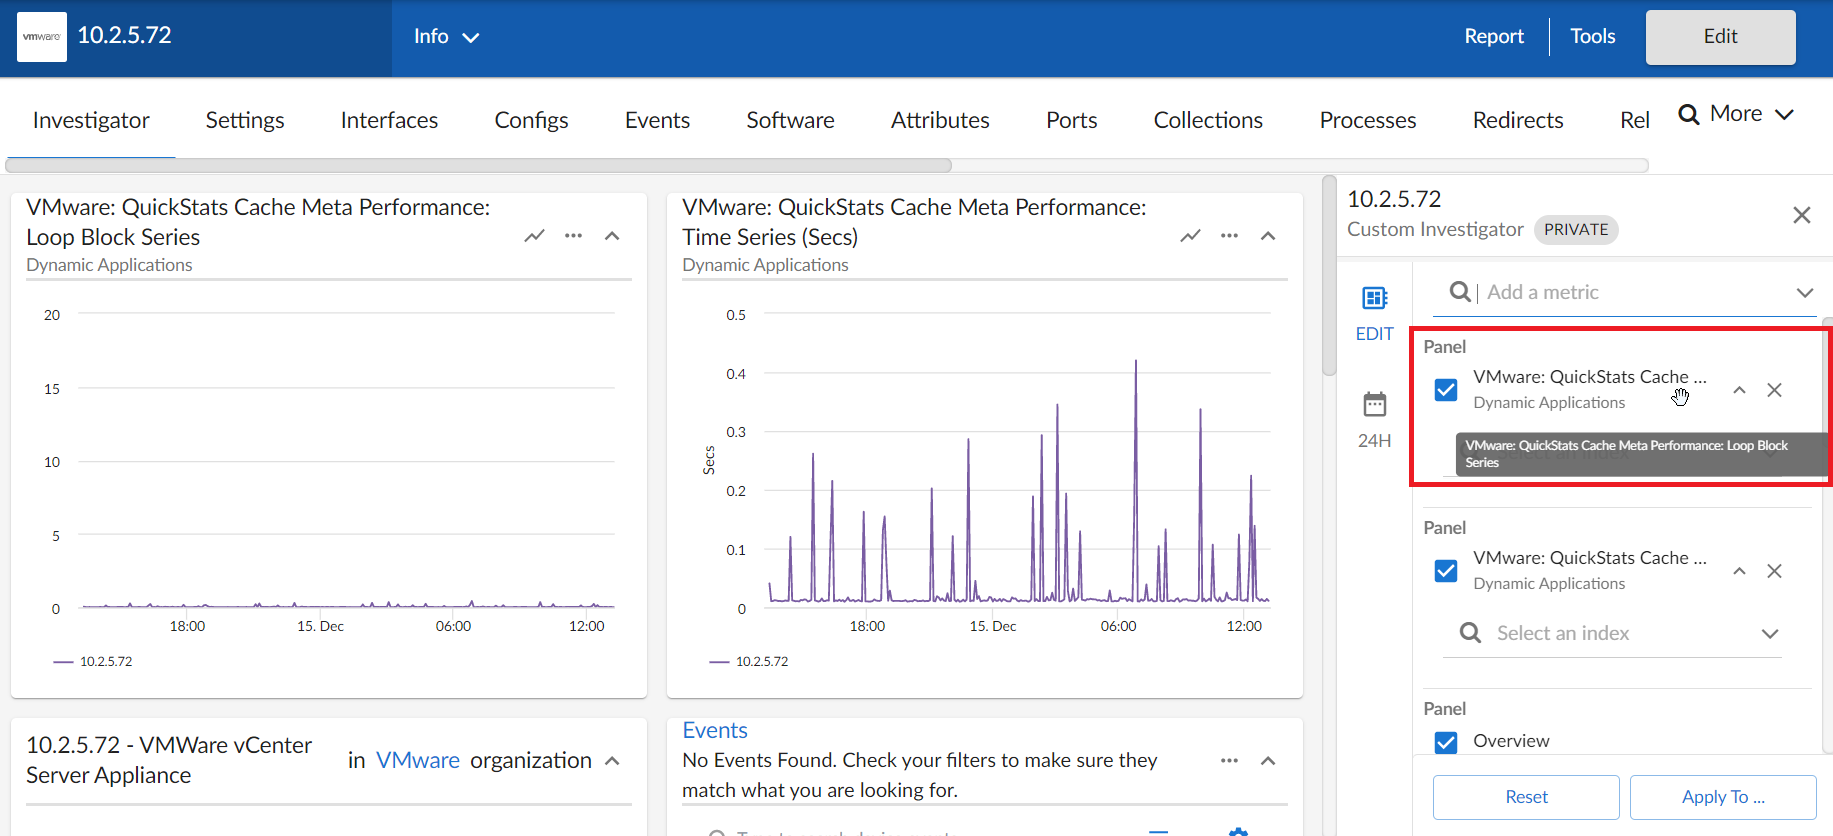
- Click and hold down the left button on your mouse to grab the metric, and then use your mouse to drag the metric into the panel of a different time-series metric in the list. When you do so, the open hand icon becomes a closed hand icon, and the panel containing the combined metrics turns blue.

- Release the left mouse button to drop the metric into the desired panel. The newly combined metric panel will be reflected in a "Combined Charts" widget in the left-hand widget panel.

The tab retains any changes you made to the set of device metrics displayed for each device, on a per-user basis. To reset these changes to their default settings, click the button at the bottom of the right panel. Optionally, you can apply these changes to other Device Categories, Device Classes, or devices. For more information, see the section on Applying a Custom Device Investigator Layout to Other Devices.
Applying a Custom Device Investigator Layout to Other Devices
The device tab has a default layout that includes widgets such as an Overview panel, Events panel, Logs panel, and combined chart panels for utilization, discard, and error metrics. Initially, this layout is assigned to all devices.
You can also create custom tab layouts for individual devices or entire Device Classes or Device Categories, and then apply those updates either to only yourself or to all system users.
To apply a custom device layout to other devices:
- On the tab of the Device Investigator page, click the button on the right sidebar to expand the layout panel. When you do so, the tab name will appear at the top of the layout panel, along with one of the following labels:
- Default. Indicates the layout has not been changed from the default settings.
- Private. Indicates the layout has been changed from the default settings but only applied to the logged in user.
- Public. Indicates the layout has been changed from the default settings and has been applied to all system users.
- Make updates to the layout as needed, such as by adding or removing metrics, editing the metric panel order, or combining one or more charts into a single panel. When you do so, the label at the top of the layout panel will change to "Private", if it was not already labeled as such.
- To save the custom layout for other devices, Device Classes, or Device Categories, and/or to save the layout for all system users, click the button, and then proceed to step 4. Otherwise, do one of the following:
- To save the custom layout for only the current device and your user account, leave the page. When you do so, SL1 automatically saves the custom layout, and will display the custom layout when you return to the for that device.
- To revert your layout changes to the default settings, click the button.
- On the Apply "Custom Investigator" to... modal, use the following tabs and fields to specify the devices and users to which you want to apply the custom layout, as well as its name:
- Categories, Classes, and Devices tabs. Click the appropriate tab(s) at the top of the modal page and then use the search field to locate the specific Device Categories, Device Classes, or individual devices to which you want to apply the custom layout. Select the checkbox for each category, class, or device that you want to select.
- Name. Type a new name for the custom layout.
- Apply Investigator for. Select one of the following options:
- Myself. Applies the custom layout to only your user account.
- All System Users. Applies the custom layout to all users in your SL1 system.
- Click . A summary of your selections appears.
- To confirm your selections, click .
The Settings Tab
On the tab of the Device Investigator page, you can manage your preferences for that device, such as whether to auto-clear events, accept all logs, run daily port scans, and more.

Click the button to change your settings. When you are done making changes, click .
The Agent section appears only for agent-type devices.
Set the following Agent data collection preferences:
- Disk Space. Specify the amount of disk space in MB that the agent can use to store data. If the agent loses connectivity to SL1, this disk space will be used to store collected data until the connection to SL1 is restored. When connectivity is re-established, the agent uploads all of its stored data.
- Excludes. Type a list of processes and directories, separated by semi-colons, that you do not want the agent to monitor.
-
Includes. Type a list of processes and directories, separated by semi-colons, that you want the agent to monitor. This field ensures that specific processes are monitored.
If a process or directory is included in both the Excludes field and the Includes field, the item in the Includes field will override the item in the Excludes field.
- Collect File Information. Select this option if you want the agent to report the names of files accessed by each monitored process.
- Collect Named Pipe Information. Select this option if you want the agent to collect named pipe information.
- Collect Socket Information. Select this option if you want the agent to collect socket information.
- Collect Thread Information. Select this option if you want the agent to collect thread information.
- Collect Non-Intercepted Processes. Select this option if you want the agent to collect limited information for processes that do not contain the agent library.
- Processes Aggregation. Specify how you want the agent to collect limited information for processes that do not have the agent library in them, and how to aggregate short-lived processes. Your options include the following:
- All: Aggregate every short-lived process into its parent.
- None: Do not aggregate any short-lived process.
- Without Sockets: Aggregate short-lived processes unless those processes have sockets.
- Upload Interval. Specify how often the agent should upload data. Your options include the following:
- 20 Seconds. Upload a data snapshot every 20 seconds.
-
60 Seconds. Upload a data summary every 60 seconds. This is the default setting starting with SL1 version 11.1.0, and version 174 of the Linux agent and version 133 for the Windows agent. This option uses an improved data format that requires fewer SL1 resources. The SL1 agent continues to internally collect and poll data every 20 seconds, but the agent summarizes and uploads that data every 60 seconds. There is no data loss even though the data is uploaded less frequently.
Set the following Collection preferences:
- Enable Collection. Select this option to enable collection using the collector group specified in the following field.
- Collection Poller. Select the name of collector group you want to use for collection on this device.
- Collection Type. Select the type of collection you want to use on this device. Your options include Standard or DHCP.
Set the following Monitoring preferences:
- SNMP Read. Select the community string for read-only access to SNMP information on the device.
- SNMP Write. Select the community string for read-and-write access to SNMP information on the device.
- Availability Protocol. Select the protocol to monitor that determines if the device is available.
- Availability Port. Select the port to monitor that determines if the device is available.
- Latency Protocol. Select the protocol to monitor that determines latency for the device.
- Latency Port. Select the port to monitor that determines latency for the device.
- Auto-Update. This checkbox specifies whether or not you want SL1 to perform a nightly discovery of the device and update records with changes to the device. If this field is unchecked, SL1 will not perform nightly discovery. Changes to the device, including newly opened ports, will not be recorded by SL1.
- Scan All IPs. If the device uses multiple IP Addresses, SL1 will scan for open ports on all IPs during initial discovery and nightly discovery.
Set the following User Maintenance preferences:
- Enable User Maintenance. Specifies whether the device is in user maintenance mode. User maintenance is an option that allows a user to manually put a device in to "maintenance mode". During maintenance mode, for the selected devices, SL1 generate only events with a severity less than the system-wide Maintenance Minimum Severity setting. If you select Enabled, the device is put in user maintenance mode, and the device will remain in this state until you or another user disables user maintenance mode.
- Enable Collection During Maintenance . Specifies whether SL1 will poll the device when user maintenance mode is enabled. If you select Enabled, SL1 will continue to poll and collect data from this device during user maintenance mode.
Set the following Alerts and Events preferences:
- Event Mask. Specify the time frame for masking events. When a device uses the Event Mask setting, SL1 groups together events that occur on that device within the specified span of time.
- Always Create Latency Alert. Select this option to generate two alerts when availability and latency checks fail. Deselect to generate only an availability alert and suppress latency alerts.
- Allow Events to Auto-Clear. Deselect this option to override an event policy's auto-clear setting for this device.
- Critical Ping. Pings the device and creates an event if the device does not respond. When enabled you can select between 5 and 120 seconds.
Set the following Other device preferences:
- Accept All Logs. This checkbox specifies whether or not you want to keep and save all logs for this device. If you want to retain only logs associated with events, uncheck this field.
- Daily Port Scans. This checkbox specifies whether or not you want SL1 to perform a daily scan of the device for open ports.
- Preserve Device Name. If selected, the name of the device in SL1 will remain the same, even if the name of the actual device is changed. If unselected, the SL1 name for the device will be updated if the name of the actual device is changed.
- Disable Asset Update. If selected, SL1 will not automatically create a new asset record for the device or update the existing asset record for the device. For the single device, this checkbox over-rides any settings defined in the Asset Automation page (System > Settings > Assets).
-
Bypass Interface Inventory. Specifies whether or not the discovery session should discover network interfaces. Your options include:
- Selected. SL1 will not attempt to discover interfaces for this device during re-discovery and nightly auto-discovery.
- Not Selected. SL1 will attempt to discover network interfaces for this device during re-discovery and nightly auto-discovery using the Interface Inventory Timeout value and Maximum Allowed Interfaces value specified in the Device Thresholds page.
- Dynamic Discovery. If selected, SL1 will automatically assign the appropriate dynamic applications to the device during discovery.
The Attributes Tab
On the tab of the Device Investigator, you can view a list of list of custom attributes that are already aligned with that device, and you can also add and remove extended custom attributes for the device:

For more information about this tab, see the section on Adding Custom Attributes for a Device.
The Changes Tab
On the tab of the Device Investigator, you can view a list of the active and cleared change events for a device.
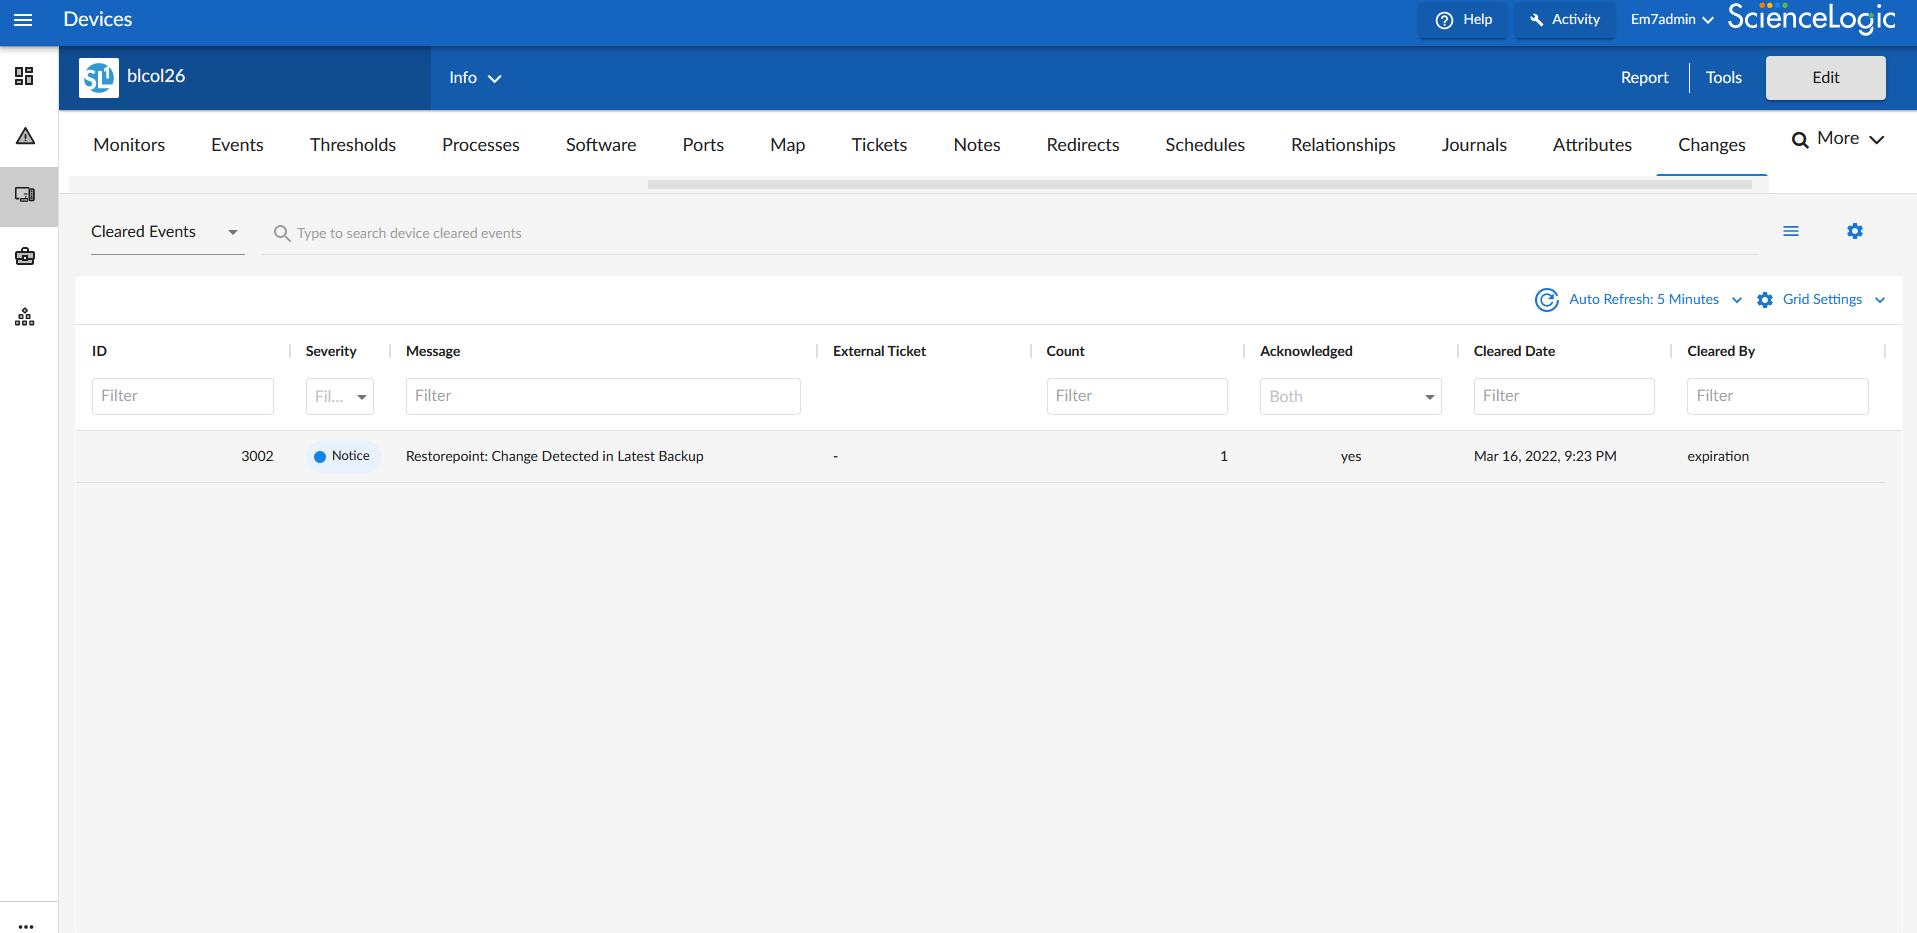
SL1 PowerFlow users can use the tab to view a list of events that are created when PowerFlow pulls change data from ServiceNow and Restorepoint Synchronization PowerPacks.
Based on your third-party integrations, the tab displays the following information:
- ServiceNow planned change events
- ServiceNow emergency change events
- Restorepoint configuration change events
About the Changes Widget
The Changes tab uses data from the Changes widget, which is also used on the Service Investigator page to show change events for Business Services.
The Changes widget is available to
The
The
From the
- Use the drop-down menu to choose which type of change events display in the widget: Active Events or Cleared Events.
- Filter and search for events by their date; either by 5, 7, 14, 30 days, or more than 30 days.
- Use the Search field to search for specific change events.
- For active events that are aligned to devices, click the down-arrow icon (
 ) next to the event to open the Event Drawer panel, which displays the following panes:
- Vitals. A widget displaying the past 24 hours of CPU and memory usage for the device related to the event. You can zoom in on a shorter time frame by clicking and dragging, and you can go back to the original timespan by clicking the button.
- Tools. A set of network diagnostic tools or user-initiated actions that you can run on the device associated with the event. Click the search bar to search for a tool or action to run, or click one of the default tools or actions that are available based on the device type and your user permissions.
- Logs. A list of the log entries from the device's log file, sorted from newest to oldest by default.
- View the Organizational Summary page for the organization aligned with an active event by clicking the link in the Organization column.
- View the Service Investigator or Device Investigator page for the service or device aligned with an active event by clicking the link in the Name column.
- View the Event Investigator page for an active event by clicking the link in the Message column.
- For ServiceNow integrations, view the ServiceNow ticket associated with an active event by clicking the link in the Ticket External Reference column.
- For ServiceNow integrations, view the ServiceNow ticket associated with a cleared event by clicking the link in the External Ticket column.
- Acknowledge an active event by clicking the button. When you acknowledge an event, you let other users know that you are aware of that event, and you are working on a response.
- Clear an active event by clicking the button. When you clear an event, you let other users know that the event has been addressed.
- Create a ticket from an active event.
- View the event policy for an active event.
- Select multiple active events for action using the check boxes next to the events.
Configuring and Enabling the Changes Widget
To use the
- Ensure that you are running SL1 version
- Ensure that you are running SL1 PowerFlow Platform version 2.2.2 or greater and one or more of the following PowerPacks, depending on your integration:
- For a ServiceNow integration:
- ServiceNow CMDB Synchronization PowerPack version 3.2.0 or later installed in PowerFlow. For more information, see
- ServiceNow Change Management Synchronization PowerPack version 3.2.1 or later installed in PowerFlow. For more information, see
- For a Restorepoint integration:
- Restorepoint Synchronization PowerPack version 1.2.0 or later installed in PowerFlow.
- Restorepoint PowerPack version 102 or later installed in SL1.
- Restorepoint Automation PowerPack version 102 or later installed in SL1. For more information, see
- In SL1, create a SOAP/XML credential to connect with PowerFlow and make note of its credential ID.
-
For a ServiceNow integration:
- In PowerFlow, sync SL1 devices with ServiceNow and make note of the Configuration field value in the Sync Devices from SL1 to ServiceNow application.
- In SL1, open the "ServiceNow: Send Change Request Event to PowerFlow" Run Book Action (which is included in the Business Services Base Pack PowerPack v2.1 and greater) and edit the input parameters to include the credential ID from step 3 and the Configuration field value from step 4.
-
For a Restorepoint integration, follow the steps in the section
-
Finally, do one of the following:
-
Permanently enable the
-
Temporarily enable the
-
Creating a SOAP/XML Credential for PowerFlow
To create a SOAP/XML credential to connect SL1 with PowerFlow:
- Follow the steps in the section
- After saving the credential, make note of the credential ID. This number can be found at the top of the Edit SOAP/XML Credential modal or in the ID column on the Credentials page (Manage > Credentials) or Credential Management page (System > Manage > Credentials).
Syncing SL1 Devices with ServiceNow
To sync SL1 devices with ServiceNow:
- Follow the steps in the section
- In the Configuration pane of the "Sync Devices from SL1 to ServiceNow" application, make note of the value in the Configuration field.
Editing the Run Book Action (ServiceNow Integrations only)
To edit the input parameters in the "ServiceNow: Send Change Request Event to PowerFlow" Run Book Action:
- Go to the PowerPack Manager page (System > Manage > PowerPacks).
- Locate the Business Services Base Pack PowerPack and click its wrench icon (
 ). The Editing PowerPack modal appears.
 - In the Editing PowerPack modal, click Run Book Actions in the left Navbar. The Embedded Run Book Actions page appears in the modal.
- Click the wrench icon () for the "ServiceNow: Send Change Request Event to PowerFlow" Run Book Action. The Policy Editor modal appears.
- In the Policy Editor modal, make the following edits to the Input Parameters field:
- Replace <sl1 credential id for powerflow> with the credential ID of the SOAP/XML credential you created for PowerFlow.
- Replace <pf config id> with the Configuration field value from the "Sync Devices from SL1 to ServiceNow" application in PowerFlow.
- Click , then exit the Policy Editor modal.
- Exit the Editing PowerPack modal.
Syncing SL1 Devices with Restorepoint
To sync SL1 devices with Restorepoint:
- Follow the steps in the section
- In PowerFlow, open the Configuration pane for the "Restorepoint: Sync Devices" application and select Enable for the restorepoint_config field to allow device change detection.
- Make a note of the restorepoint_id value on the Configuration pane for the "Restorepoint: Sync Devices" application.
- In SL1, make sure that the same restorepoint_id value was added to the Values column on the tab on the Device Investigator page for the devices synced from Restorepoint.
Permanently Enabling the Widget
To permanently enable the Changes widget using the NextUI configuration file, run the following steps on all appliances, including the Administration Portal, the Data Collector, the Database Server, the Data Engine, and the All-In-One Appliance.
To permanently enable the Changes widget:
-
Start an SSH session into one of the SL1 appliances.
-
Using vi or another text editor, edit the /opt/em7/nextui/nextui.conf file. To do so, enter the following at the shell prompt:
sudo vi /opt/em7/nextui/nextui.conf
-
Add the following line at the bottom of the NextUI configuration file:
BUSINESS_SERVICES_CHANGE_EVENTS_TAB=enabled
-
Save your changes, and then restart the NextUI service by running the following command:
sudo systemctl restart nextui
-
Repeat steps 1-4 for the remaining SL1 appliances.
Temporarily Enabling the Widget
To temporarily enable the Changes widget using GraphQL:
-
To access the GraphiQL interface, type the URL or IP address for SL1 in a browser, add /gql to the end of the URL or IP address, and press . The GraphiQL interface appears.
-
In the main query pane, type the following mutation:
mutation updateChangeEventsTab {
	updateFeatureToggle(
		id: "system:BUSINESS_SERVICES_CHANGE_EVENTS_TAB"
		value: "enabled"
	) {
		id
		value
	}
}
Click the button to format the mutation and to add syntax highlighting to make the mutation easier to read. Note that the Prettify process removes the query syntax if only one query is present in the main query pane.
-
Click the (Play) button. The mutation executes, and the results appear in the pane on the right side.
If the
For more information about GraphQL, see the GraphQL documentation. For more information about the GraphiQL user interface, see the GraphiQL user interface documentation.
The Collections Tab
On the tab of the Device Investigator, you can view a list of the Dynamic Applications associated with the device.

For more information about this tab, see the section on Managing the Dynamic Applications Associated with a Device.
The Configs Tab
On the tab of the Device Investigator, you can view configuration information that has been collected from the device by Dynamic Applications.
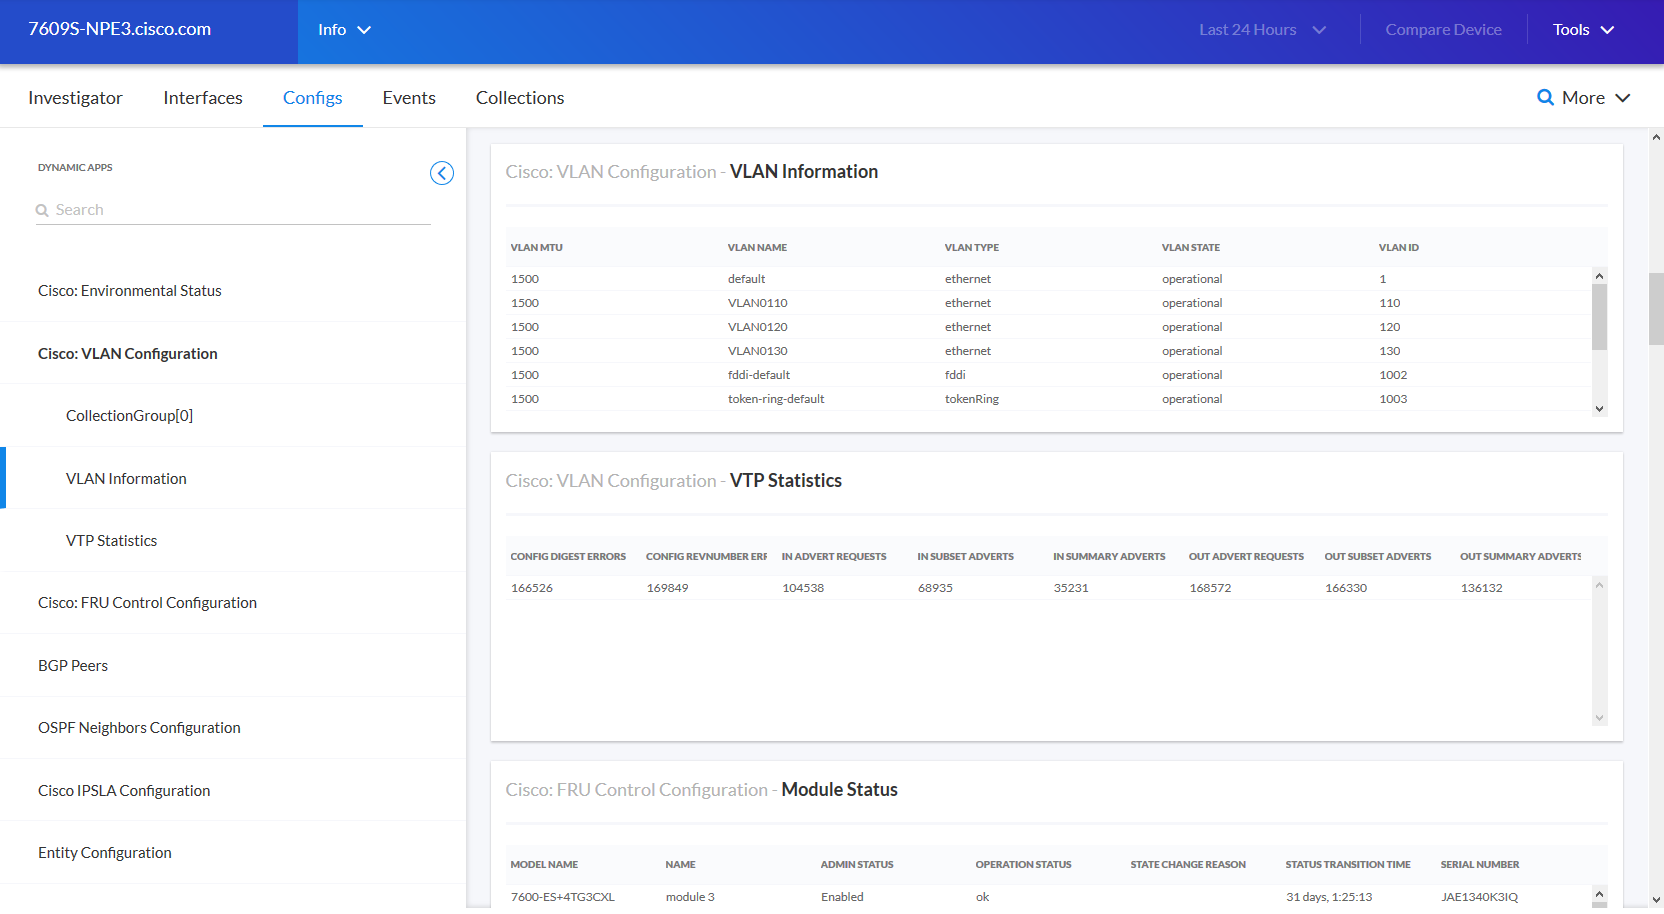
All objects of type "config" are included on the tab. Usually, "config" objects contain static information about hardware and configuration settings, such as serial numbers, version numbers, and hardware status.
For more information about this tab, see
The Events Tab
On the tab of the Device Investigator, you can view a list of events associated with the device.

For more information about this tab, see
The Interfaces Tab
On the tab of the Device Investigator, you can view information about the various interfaces used by the device, including Port, Hardware Description, MAC Address, Connection Speed, and other details for each interface.

For more information about this tab, see
The Journals Tab
On the tab of the Device Investigator, you can view journal entry information that has been collected from the device by journal Dynamic Applications:

For more information about this tab, see
The Logs Tab
You can view logs and messages for a device in the tab of the Device Investigator page. This is the same set of logs that display on the tab for this device.
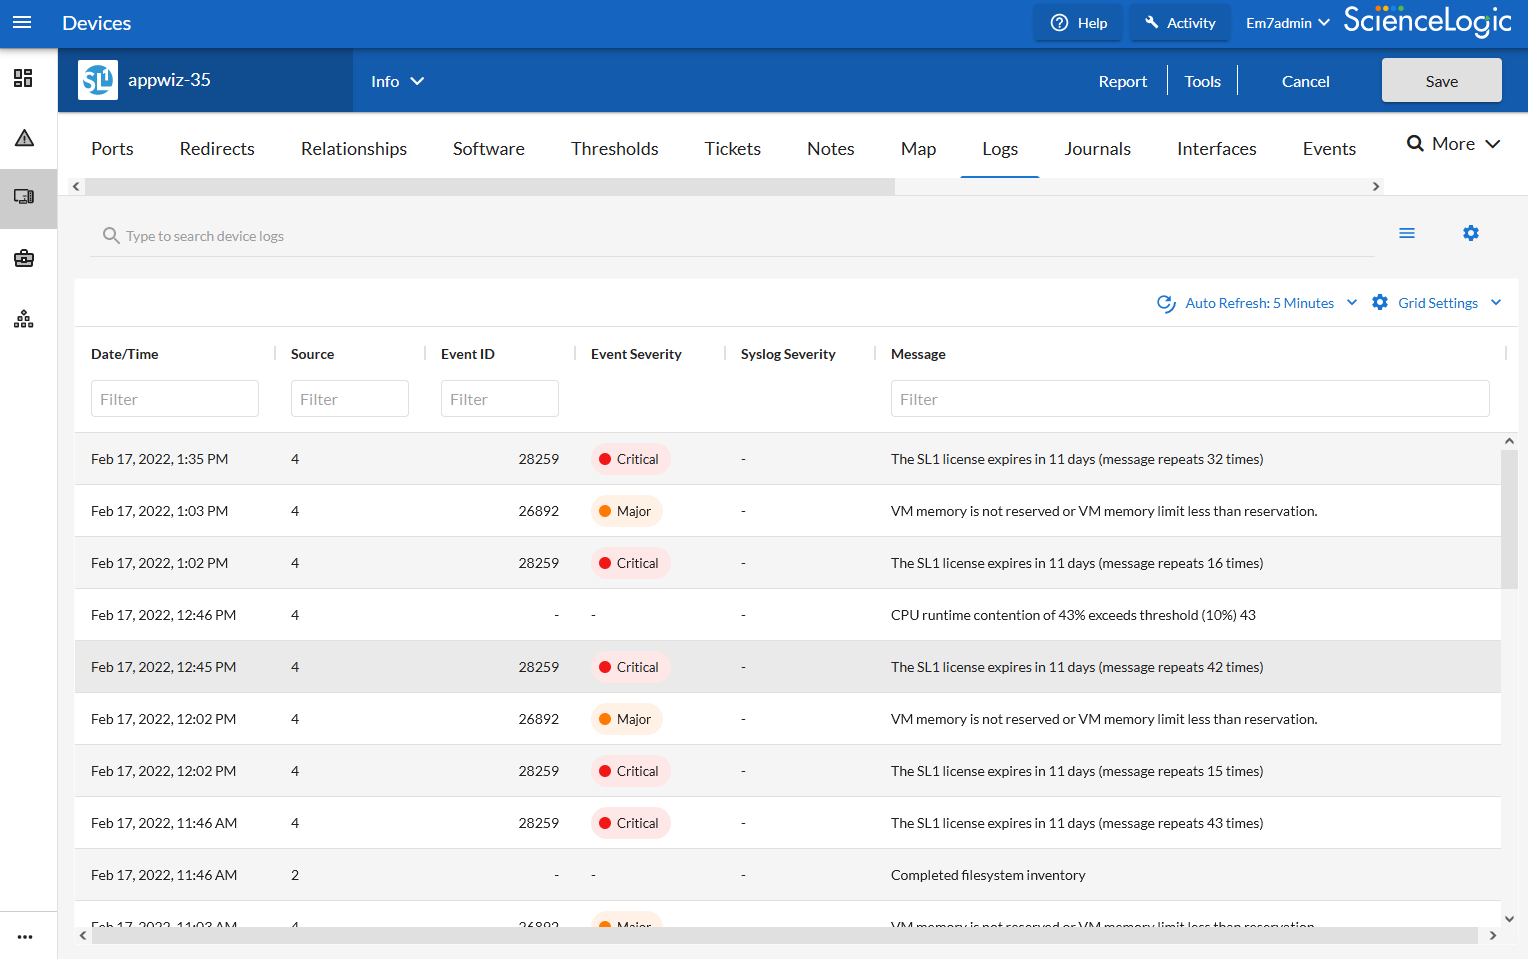
The Logs tab displays all of the messages SL1 and the SL1 Agent, if applicable, have collected from the device. You might find it helpful to view these log entries during troubleshooting or to manually check on the status of a device.
The Machine Learning Tab
On the tab of the Device Investigator, you can view a list of machine learning metrics that are enabled for the device:

For more information about machine learning and anomaly detection, see
The Map Tab
On the tab in the Device Investigator, you can view a map of the selected device and all of the devices with which the device has relationships.

For more information about this tab, see the section on Viewing Device Topology settings. For more information about maps, see the
The Monitors Tab
On the tab of the Device Investigator, you can define monitoring policies for a device.
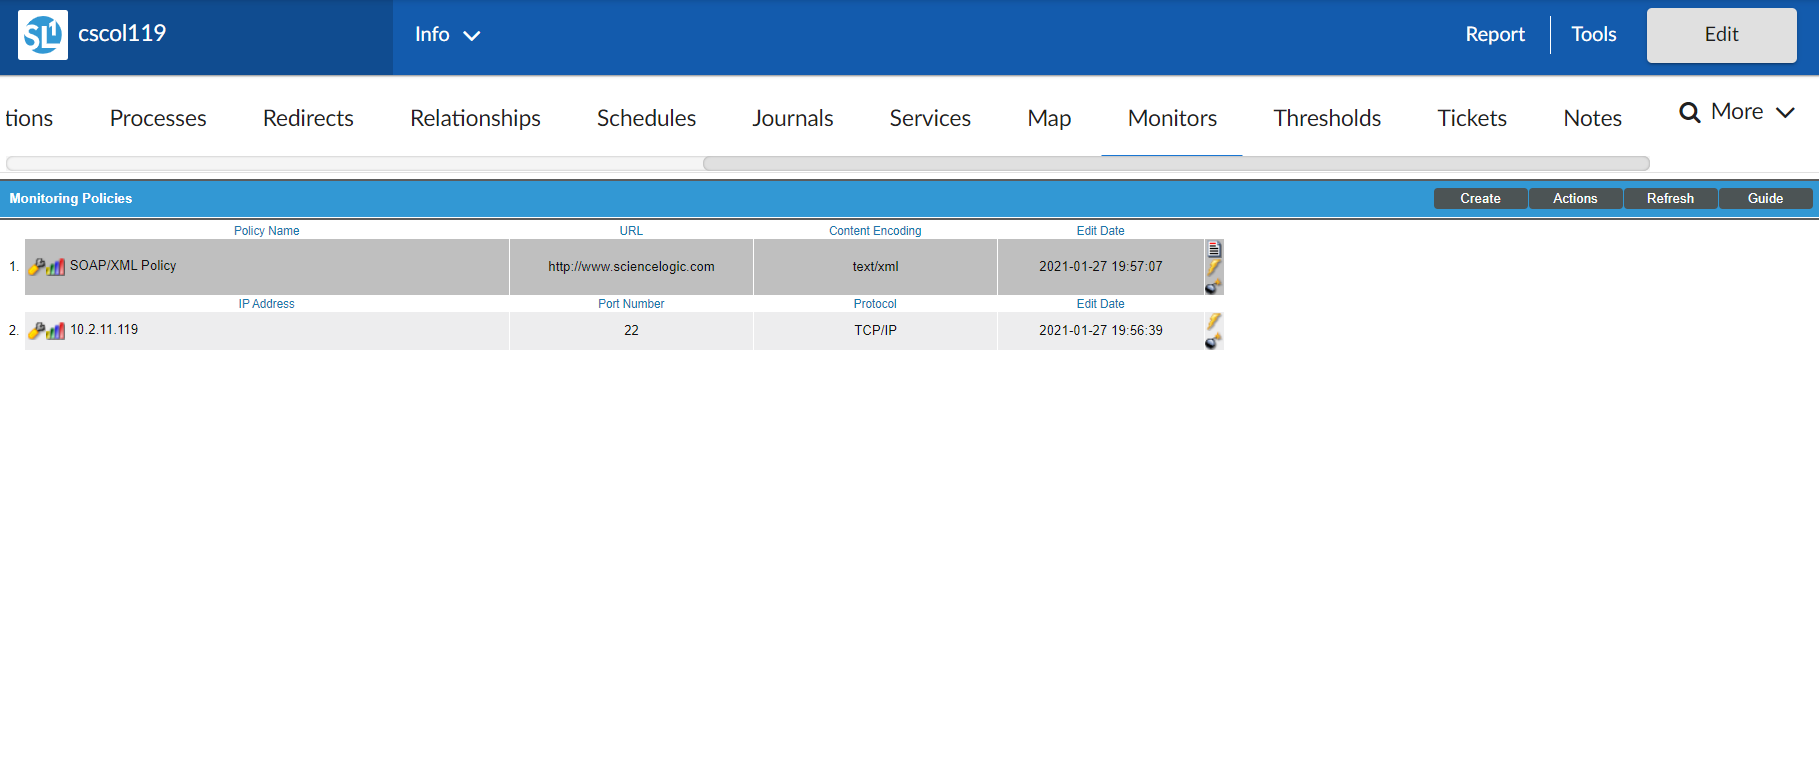
The tab allows you to define policies that monitor:
- System processes. Monitors the device and look for the specified system process.
- Domain-name availability and lookup speed. Monitors the availability and lookup time for a specific domain-name server and a specific record on a domain name server.
- Email round-trip speed. Monitor the amount of time it takes to send an email message from SL1 to an external mail server and then back to SL1.
- SOAP and XML transaction speeds. Monitors any server-to-server transactions that use HTTP and can post files or forms. (for example, SOAP/XML or email). Periodically, SL1 sends a request and some data and then examines the result of the transaction and compares it to a specified expression match.
- TCP/IP port availability. Monitors ports for availability every 5 minutes. If a port is not available, SL1 creates an event. The data gathered by the port policy is used to create port-availability reports.
- Web-content availability. Monitors a website for specific content. SL1 will periodically check the website for specified content. If the content cannot be found on the website, SL1 will generate an event.
- Windows services. Monitors the device and look for the specified service.
NOTE: All of these monitoring policies can generate events. SL1 uses the data collected by these policies to create performance reports and graphs.
The Notes Tab
On the tab of the Device Investigator, you can add and view notes and other attachments associated with the device.

To add a note to a device:
- Go to the tab of the Device Investigator.
- Click the button and then select Notepad Editor. The Notepad Editor modal page appears.
- In the Notepad Editor modal page , you can enter notes or comments about the device.
- You can format the text and include links, images, and videos in the note.
- You can also include a document template (System > Customize > Document Templates) in the field.
- When you are finished adding content to the note, click . The note will appear in the tab, along with any other notes about the device. Each note includes the username, date and time, and text of the comment. You can perform the following on each note entry:
- To view a note's attachment, click the paperclip icon (
 ).
). - To edit the content of a note, click the wrench icon (
 ). The Notepad Editor modal page appears. You can update the note; format the text; insert content from a saved template; and add an attachment, image, or video to the note. Click the button to save your changes.
 - To delete a note, click its bomb icon (
 ).
).
For information about adding a note to a device in the classic SL1 user interface, see the section on Adding a Note in the Device Administration Panel.
The Ports Tab
On the tab of the Device Investigator, you can view a list of all open ports on a device:

Every night, SL1 scans all the ports of each managed device. If any new ports are opened, SL1 adds the port to the list on the tab.
For more information about this tab, see
The Processes Tab
A process is a program that is currently running on a monitored device or has been run in the past and is currently idle. Sometimes a process is called a task.
On the tab of the Device Investigator, you can view information about the processes running on the device. The tab displays a combined list of processes collected via SNMP and the agent, where applicable.
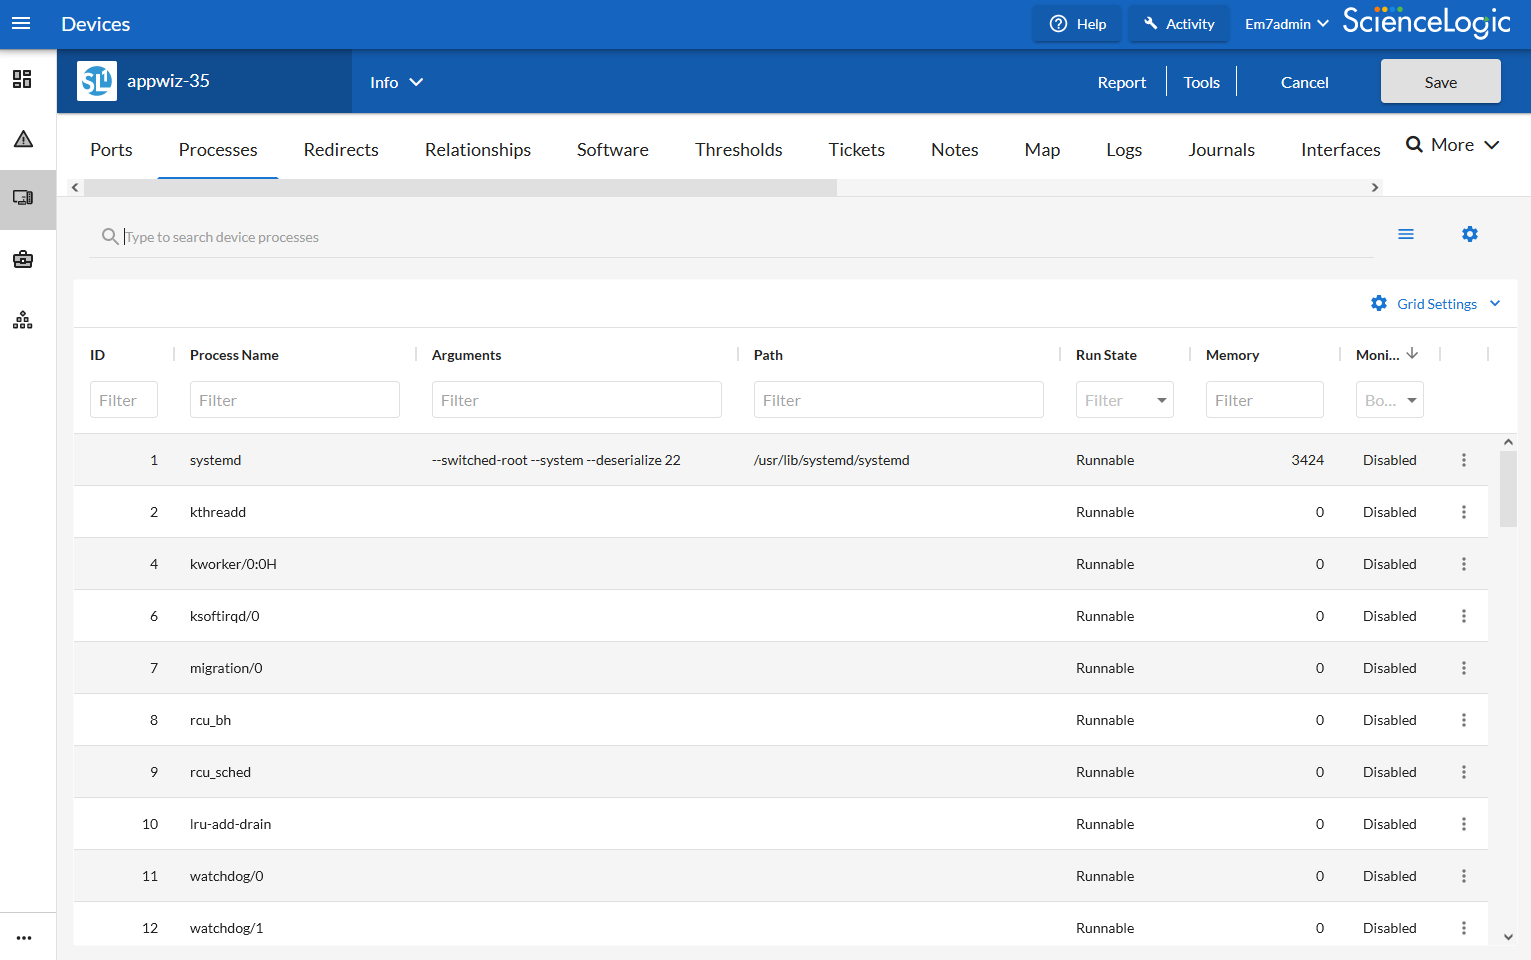
For more information about this tab, see
The Redirects Tab
On the tab of the Device Investigator, you can redirect log entries from one IP-based device to another IP-based device, or from an IP-based device to a virtual device.

For more information about this tab, see
The Relationships Tab
On the tab of the Device Investigator, you can view information about parent-child relationships between the selected device and other devices.

For more information about this tab, see the section on Viewing Relationships for a Single Device.
The Schedules Tab
On the tab of the Device Investigator, you can manage all the scheduled process you have defined in your system. You can define scheduled tasks for a number of things, such as backup management, dashboards, devices, and Run Book Automation policies.

For more information about this tab, see the section on Scheduling Maintenance for a Single Device.
The Software Tab
On the tab of the Device Investigator, you can view a list of all the software installed on the device.


For each installed software title, the tab displays the following information:
- Name. Name of the software.
- Install Date. Date and time the software was installed on the device.
For more information about this tab, see
The Thresholds Tab
On the tab of the Device Investigator, you can define usage and performance thresholds and data retention thresholds for a device:

When performance thresholds are exceeded, SL1 will generate an event for the device. When space thresholds are exceeded, SL1 will remove the oldest data from the database. For each of these thresholds, SL1 defines a default value. You can edit the thresholds to meet your needs.
For more information about this tab, see the section on Device Thresholds.
The Tickets Tab
On the tab of the Device Investigator, you can view all tickets associated with the device and create new tickets to associate with the device:

The tab displays critical information about each ticket. If you require more detail, you can access the Ticket Editor from this page by clicking on the ticketing icon (![]() ) for that ticket.
) for that ticket.
You can also create a new ticket from this page.
To create a new ticket for a device:
- Go to the tab of the Device Investigator.
- Click the button and then select Create a Ticket. The Ticket Editor page appears.
- On the Ticket Editor page that appears, define the basic parameters for the ticket.
The Description and Element fields are automatically populated with information about the device.
- When you are finished, click .