![]()
This ![]() ).
).
You can also access additional dashboards created in the classic Skylar One user interface on the Classic Dashboards page (Dashboards > Classic Dashboards).
For more information, see the Classic Dashboards manual.
If you are looking for a very specific set of dashboards, click the gear icon (![]() ) to the right of the Search field and select Advanced. In this mode you can create an advanced search using "AND" or "OR" for multiple search criteria. For more information, see Performing an Advanced Search.
) to the right of the Search field and select Advanced. In this mode you can create an advanced search using "AND" or "OR" for multiple search criteria. For more information, see Performing an Advanced Search.
Use the following menu options to navigate the Skylar One user interface:
- To view a pop-out list of menu options, click the menu icon (
 ).
). - To view a page containing all of the menu options, click the Advanced menu icon (
 ).
).
What is a Dashboard?
A dashboard is a page that displays one or more graphical reports, called widgets. These widgets appear in their own pane, and display charts, tables, and text.
Access to dashboards is based on your login credentials, so you can view only dashboard data for which you have access. Also, some dashboards might be private instead of public.
To define a widget, you first select from a list of pre-defined widget definitions, and then customize what will be displayed by the selected widget by supplying values in the option fields provided by that widget.
If an animated blue line appears under a widget name, the widget is in the process of updating its data. When the line disappears, the widget is done updating. If an item name displays as a hyperlink in a dashboard, you can click that link to go to the relevant detail page for an item, or to go to an Investigator page for devices, events, and services.
Favorite a Dashboard
In Skylar One, you can select one or more dashboards so that they always display at the top of the list on the page. This process is called favoriting dashboards or favorite dashboard.
For example, on the page pictured below, click the Favorite Dashboard star icon (![]() ) to add or remove the dashboard from your favorites list. Click the icon (
) to add or remove the dashboard from your favorites list. Click the icon (![]() ) again to remove the favorite status.
) again to remove the favorite status.
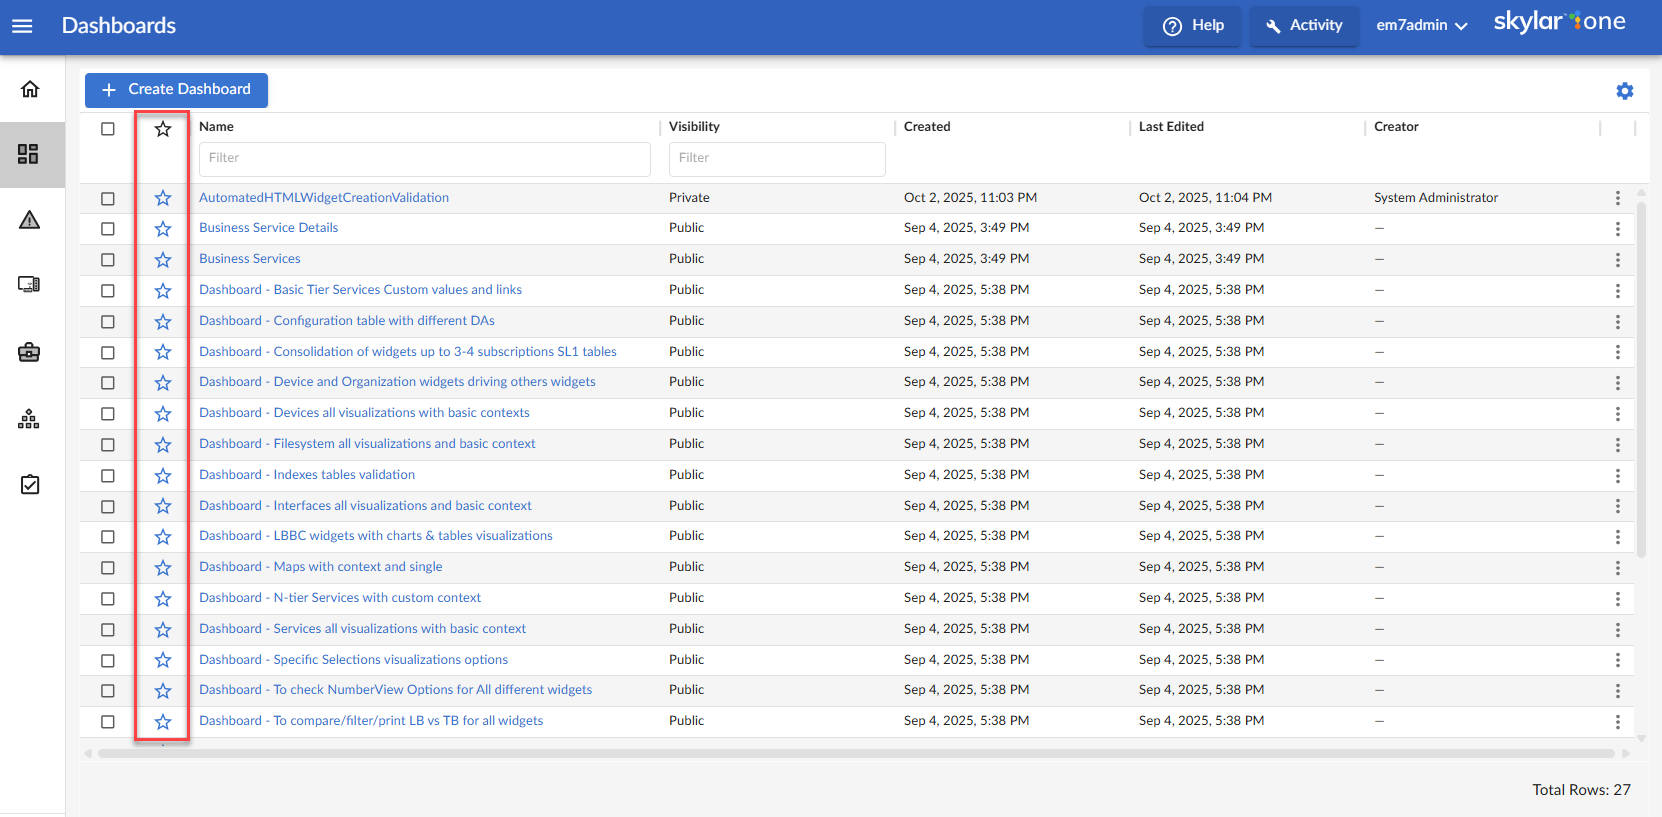
You can then sort your dashboards by their favorite status.
With favorite dashboards, you can:
- View your favorite dashboard at the top of the Dashboards page by default.
- Include favorites in the multi-sort function.
- Filter dashboards by favorite.
Leaderboard Widgets and Driving Context
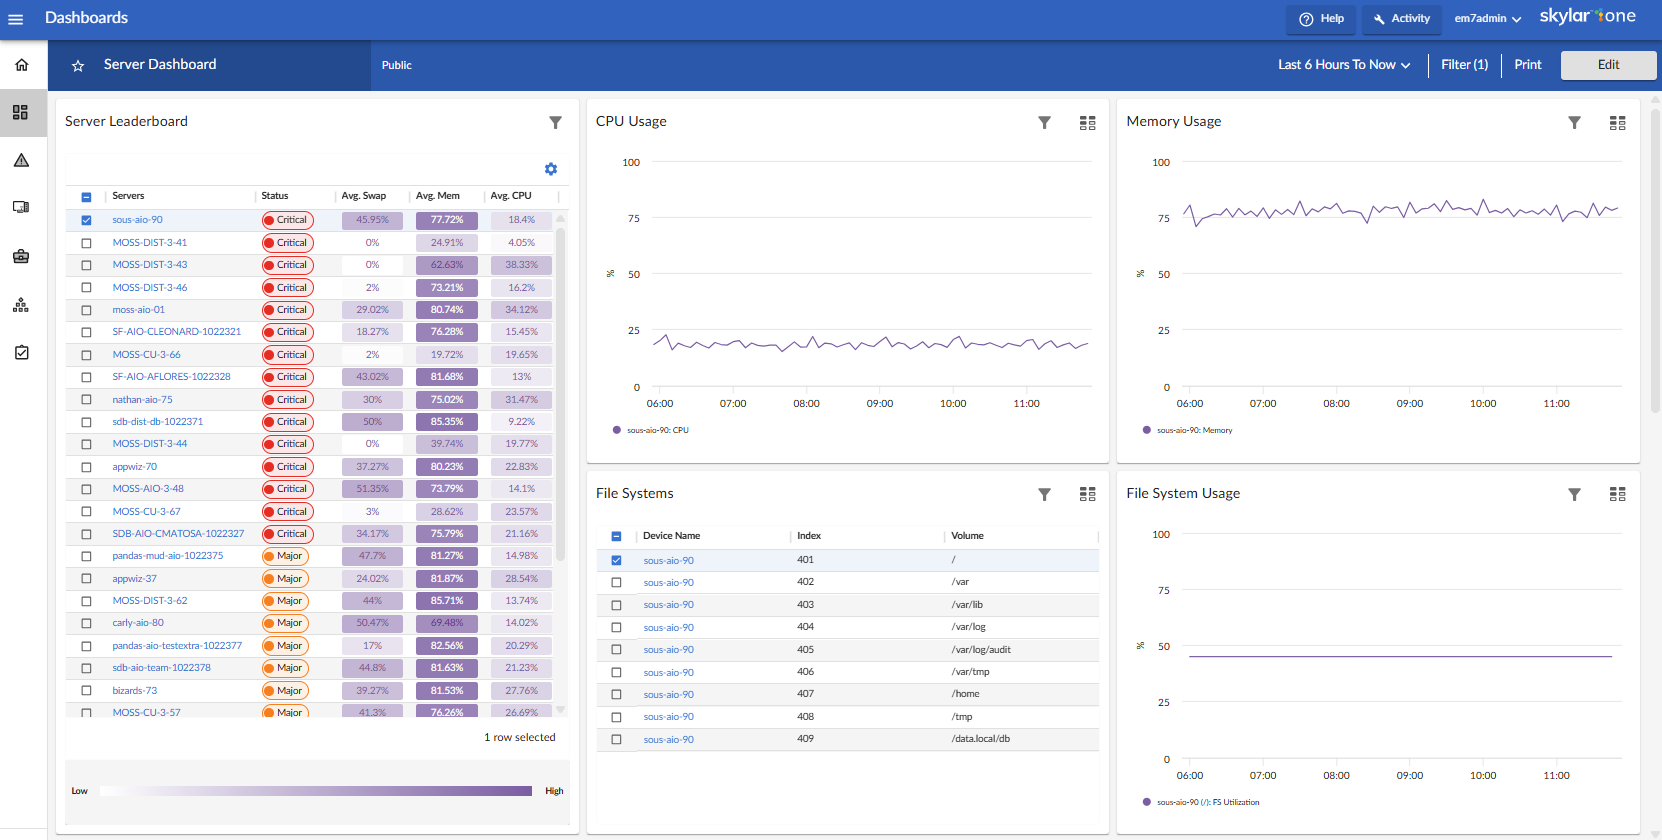
A leaderboard widget lets a dashboard user select specific items in a widget so that data about only those items displays in other widgets in the dashboard:
In Skylar One, this feature is called driving data or driving the context of a dashboard widget. For example, in the Server leaderboard widget pictured above, if you select one or more servers on the leaderboard widget, the other widgets in the dashboard will display data about just the servers you selected. The other widgets receive the context from the "driving" widget, which in this example is the leaderboard widget.
You can use the Display zeroes toggle when editing a Top-N or Bottom-N widget to enable the widget to show or hide zero results.
To use a leaderboard widget:
- On the Dashboards page, select an existing dashboard or create a new dashboard with a leaderboard.
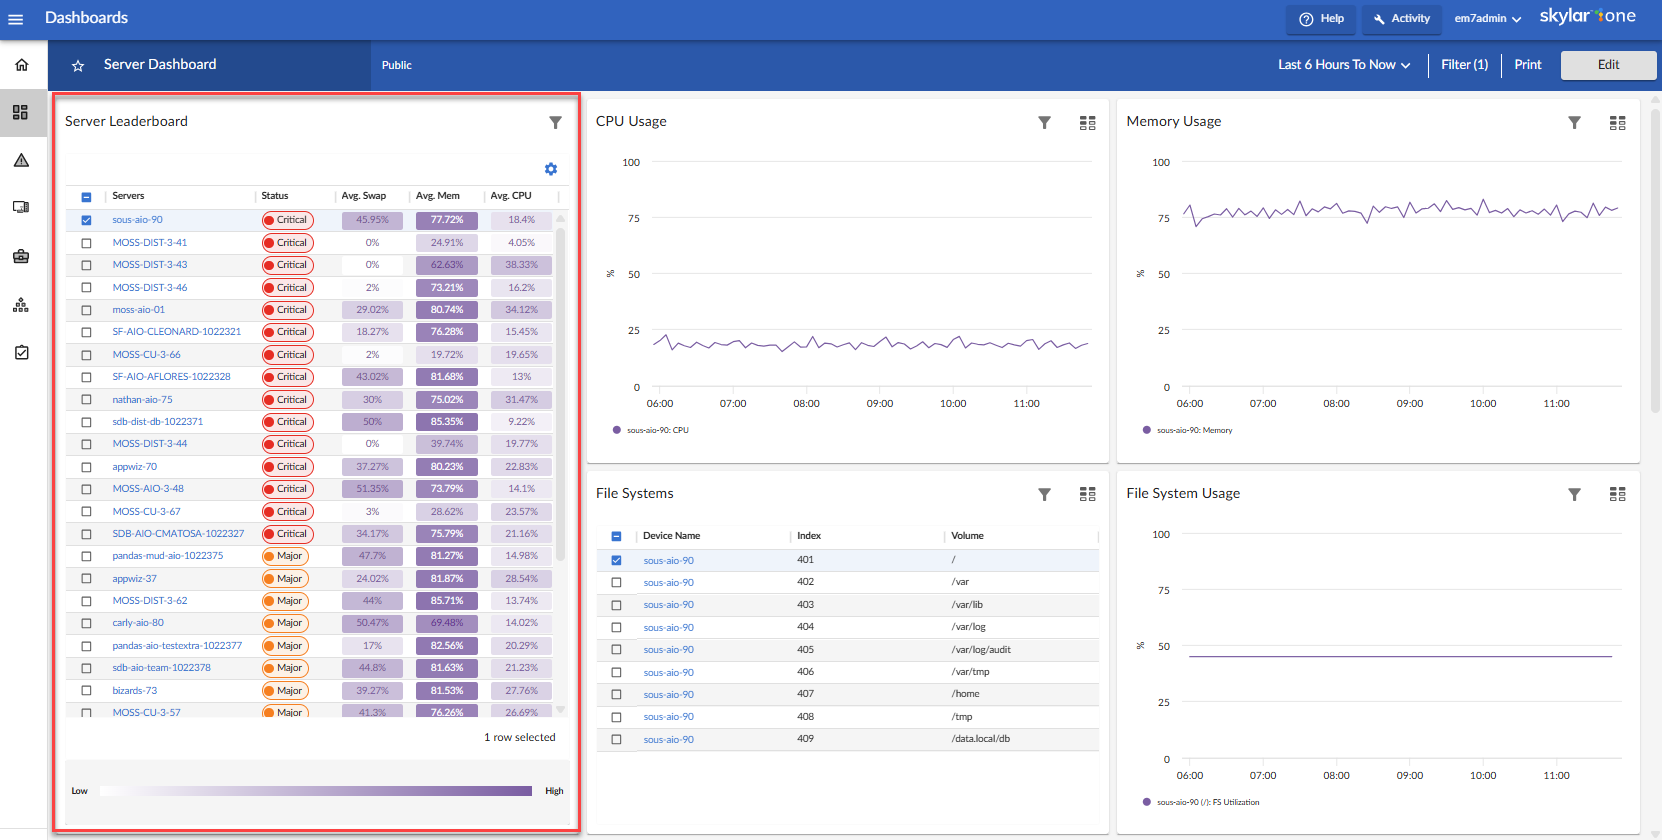
- Select one or more items on the leaderboard widget. The other widgets in the dashboard update with data only for the selected item or items.
Widget Legends
The items you select in a leaderboard on the Dashboards page also appear at the bottom of each widgets that contain line charts and bar charts, arranged by line color and name:

You can click an item name in the legend to toggle the display of data from that item in that widget. The line next to the item name turns gray, and the data remains hidden until you click the item name again.

You can also view more information about a specific point in time for an item by hovering over a line in a graph:

The Helper Icon
After you select one or more items in a Leaderboard widget on the Dashboards page, the widgets to the right of the Leaderboard display data relevant to your selections. The widgets also contain a small icon at the top right of each widget called a Helper icon (![]() ).
).
When you click the Helper icon, you can view a list of all of the widgets that drive data or provide context to that widget. In the example below, the Capacity Forecast (2 Weeks) widget receives data from both the Storage Leaderboard widget and the Capacity Forecast List widget:

Filtering Dashboard Data
On the Dashboards page, you can control the display of a widget, such as changing the time span of data displayed in all the widgets, or zooming in or out on widget data.
You can also use the button to narrow down the data displayed in all widgets. The variable X is the number of filters applied to the dashboard.
Widgets on the Dashboards page have header text that indicates the number of filters applied.
Using the Time Span Filter
You can use the Time span filter on the Dashboards page to adjust the time span of data that appears in all the widgets on a dashboard. The default time span is Last 6 Hours to Now, but you can update the time span of data reflected in a dashboard by clicking the time span button and doing one of the following:
- Selecting an absolute time range from the list, such as Yesterday or This week so far. When you do so, Skylar One automatically updates the From and To fields with the corresponding dates and times.
- Selecting a relative time span from the list, ranging from Last Hour up to Last 2 Years. When you do so, Skylar One automatically updates the From and To fields with the corresponding dates and times.
- Clicking the calendar icons in the From and To fields to select the exact historical range of data that you want to display in the dashboard.
Optionally, you can also select one or both of the following options in addition to your time span selection:
- Select the Specify Time checkbox to specify the exact times (in addition to dates) that you want to display in the dashboard.
- Select the Live Data checkbox to set the To field to Now, so that every time the dashboard is refreshed, it will display the most recently polled data. If this checkbox is not selected, the To field is set to an absolute date and time for the dashboard. The dashboard automatically refreshes every five minutes.
After selecting a time span, click to update the dashboard.

The time span filter does not impact the list of events that appears in Events table widgets.
If you select an historical time span, single-value widgets and tables will display the latest data point from the specified time span.
If you see a gap in a line on a graph, that means that Skylar One did not collect any data during that time frame.
Zooming in on a Time Span
You can edit the time span of a line chart widget on the Dashboards page by clicking and dragging to "zoom in" on a specific time span.
To zoom in on the time span of a widget:
- If needed, adjust the amount of time showing on all widgets by selecting a new value from the Time Span filter. The default time frame is the last 24 hours.
- On the widget, click the start time you want to view, and then drag the cursor to the left or right to create a gray rectangle.

- Drag the gray rectangle to the end time you want to view, and then release the mouse button. A more detailed time span displays in the widget.

- To return to the original graph setting, click the button.
Using the Filter (X) Button
The button lets you filter the data in a dashboard on the Dashboards page by Organization, Device, and Service. The search process for the button works just like the Search feature works on other pages. The variable X is the number of filters applied to the dashboard.
To filter dashboard data with the button:
- On any of the dashboards, to temporarily filter the dashboard, click the button in the top right-hand corner of the Dashboards page. If you want to save the filters you apply, click the button and then click . The Default Data window appears.
- Click in one of the fields and type your filter text. As you type, Skylar One provides potential matching values in a drop-down menu. For example, if you type switches in the By Device filter field, a drop-down menu appears with a list of columns that might contain that word.
- You can select a column from the suggestions in the menu, or you can type more filter text.
- If you do not select a column from the drop-down menu, your search is labeled "ANY". Search looks through all available columns for matches to your search text.
To use an advanced filter, click the Advanced link to the right of the filter field and use custom search commands to filter the data. For more information, see Using Advanced Search.
- To clear a filter, click the button (
 ) at the end of that filter field.
 - To specify the widget that drives data (or "context") to other widgets in the dashboard, select that widget from the In Driving Widget drop-down list.
- Click the button to apply your filters and settings.
- If you are in Edit mode, click to save your filters. When the applied filters are saved, every user viewing it from that point on will view the dashboard with that filter and can adjust it temporarily.
Focusing on One Device in a Dashboard
You can use a leaderboard or table widget to focus on just one device in a dashboard on the Dashboards page. This feature is useful if you want to view charts and other widgets only for a specific device, or if you want to use the Print feature to generate a PDF of this dashboard for this device.
To focus on one device in a dashboard:
- From the Dashboards page, select a dashboard with a device leaderboard, such as Server Dashboard.
- In the leaderboard or table widget, take note of the ID for that device.
- If you don't have ID enabled as a Device Property in the table, hover over the link for the device you want to view. In the Status Bar of your browser, take note of the number at the end of the URL for that link. For example, https://em7.sciencelogic.com/inventory/devices/detail/23.
- Click the button and enter the device ID into the By Device field. When the search options appear, select id<device ID>, then click the button. When the page refreshes, only the specified device appears in the dashboard:

- Alternatively, you can add ?deviceId=<device ID> to the existing URL for the Server Dashboard, where <device ID> is the number you found in step 2. For example, if the original URL for the Server Dashboard is https://em7.sciencelogic.com/dashboards/server-dashboard, you would update that URL to the following: https://em7.sciencelogic.com/dashboards/server-dashboard?deviceId=23 and press . When the page refreshes, only the specified device appears in the dashboard.
- To return to the default view for the dashboard, clear the By Device field in the menu or delete the ?deviceId=<device ID> from the URL.
Printing a Dashboard
You can create a printable version of a dashboard in PDF format.
To create a PDF of a dashboard:
- Go to the Dashboards page and click the name of the dashboard you want to print. The dashboard page appears.
- Click the button on the main navigation bar. A Print dialog appears:

- Complete the following fields:
- Page Orientation. Select from Portrait or Landscape orientation for the output. The default is Landscape.
- Page Alignment. Select from Left, Centered, or Right justification for the output.
- Page Margin. Specify the margins in the output, in pixels. The default is 25 pixels (about .4 inches).
- Significant Figure Precision. Specify the maximum number of numerals that you want to appear after the decimal point when data is presented in the output. The default is 4.
- Include Title. Select this toggle if you want to include the title of each widget in the output.
- Include Dashboard. Select this toggle if you want to display the current view of the entire dashboard in the output.
- Include Widgets. Select this toggle if you want to display all of the individual widgets in the output.
- Include Data Table. Select this toggle if you want to display all of the current data in tables in the output.
- Click the button. Skylar One generates a PDF version of the dashboard.