![]()
Use the following menu options to navigate the Skylar One user interface:
- To view a pop-out list of menu options, click the menu icon (
 ).
). - To view a page containing all of the menu options, click the Advanced menu icon (
 ).
).
What is an Event?
One of the quickest ways to monitor the health of your network is to look at events. You can view events on the Events page in Skylar One.
Events are alerts that are triggered when a specific condition is met. For example, an event can signal if a server has gone down, if a device is exceeding CPU or disk-space thresholds, or if communication with a device has failed. Alternately, an event can simply display the status of a managed element.
An alert defines a formula that Skylar One evaluates each time data is collected. If the formula evaluates to true during data collection, Skylar One generates an alert. Not every alert will trigger an event. An alert must have an event policy in Skylar One that defines the conditions for the event, and when an alert meets the conditions in the event policy, Skylar One generates an event.
Skylar One generates log messages from incoming trap and syslog data, and also when Skylar One executes user-defined policies. Skylar One then uses these log messages to generate events. Skylar One examines each log message and compares it to each event definition. If a log message matches an event's definition, Skylar One generates an event instance and displays the event on the Events page.
Each event includes a description of the problem, where the problem occurred (device, network hardware, software, policy violation), a pre-defined severity, the time of first occurrence, the time of most recent occurrence, and the age of the event. You can find more information on the Event Investigator page for an event.
Skylar One includes pre-defined events for the most commonly encountered conditions in the most common environments. You can also create custom events for your specific environment or edit the pre-defined events to better fit your specific environment.
How Are Events Triggered?
Skylar One examines log messages to generate instances of events. When Skylar One monitors a system, Skylar One generates log messages when the collected data meets user-defined thresholds. Additionally, a monitored system can send log messages to Skylar One asynchronously. Skylar One examines each log message and compares it to each existing event definition. If a log message matches an event's definition, Skylar One generates an event instance and displays the event on the Events page.
Skylar One includes logic that correlates and groups (rolls-up) related logs and messages into a single event. Skylar One includes pre-defined events for many syslog, internal, trap, and dynamic messages.
Skylar One generates events by collecting log messages from the following sources:
- Syslog. Message is generated by the syslog protocol. Syslogs can be sent by devices and proxy devices such as managers of managers (MoM). A syslog is an unsolicited message from a device to Skylar One. Syslog is a standard log format supported by most networking and UNIX-based devices and applications. Windows log files can be converted to syslog format using conversion tools. For more information on syslogs,
- Internal. Message is generated by a ScienceLogic process. The message is about the Skylar One system itself, instead of the devices that the Skylar One system monitors.
- Trap. Message is generated by an SNMP trap. SNMP traps can be sent by devices and proxy devices like MoMs. An SNMP trap is an unsolicited message from a device to Skylar One. A trap indicates that an emergency condition or a condition that merits immediate attention has occurred on the device. For more information on traps,
- Dynamic. Message is generated by a Dynamic Application alert. Dynamic Applications are customizable policies that tell Skylar One how to monitor applications and devices. You can define alerts in Dynamic Applications. An alert can trigger events based on the data collected by the Dynamic Application. Alerts allow you to examine and manipulate values retrieved by Dynamic Applications. When an alert evaluates to TRUE, the alert inserts a message in the associated device's device log. Skylar One examines each new message in the device log and determines if the message matches an event definition. If the message matches an event definition, Skylar One generates an instance of that event. For example, an alert might be defined to evaluate to TRUE if the temperature of a chassis exceeds 100 degrees Fahrenheit. If the chassis temperature exceeds 100 degrees at some point in the future, Skylar One inserts a message in the associated device's log files. Skylar One then matches that message with an existing event, and then triggers the event.
- Email. Message is generated by an email message sent to Skylar One.
- API. Message is generated by inserting a message into the main database. These messages can be inserted by a snippet automation action, a snippet Dynamic Application, or by a request to the ScienceLogic API. For more information on snippet automation actions,
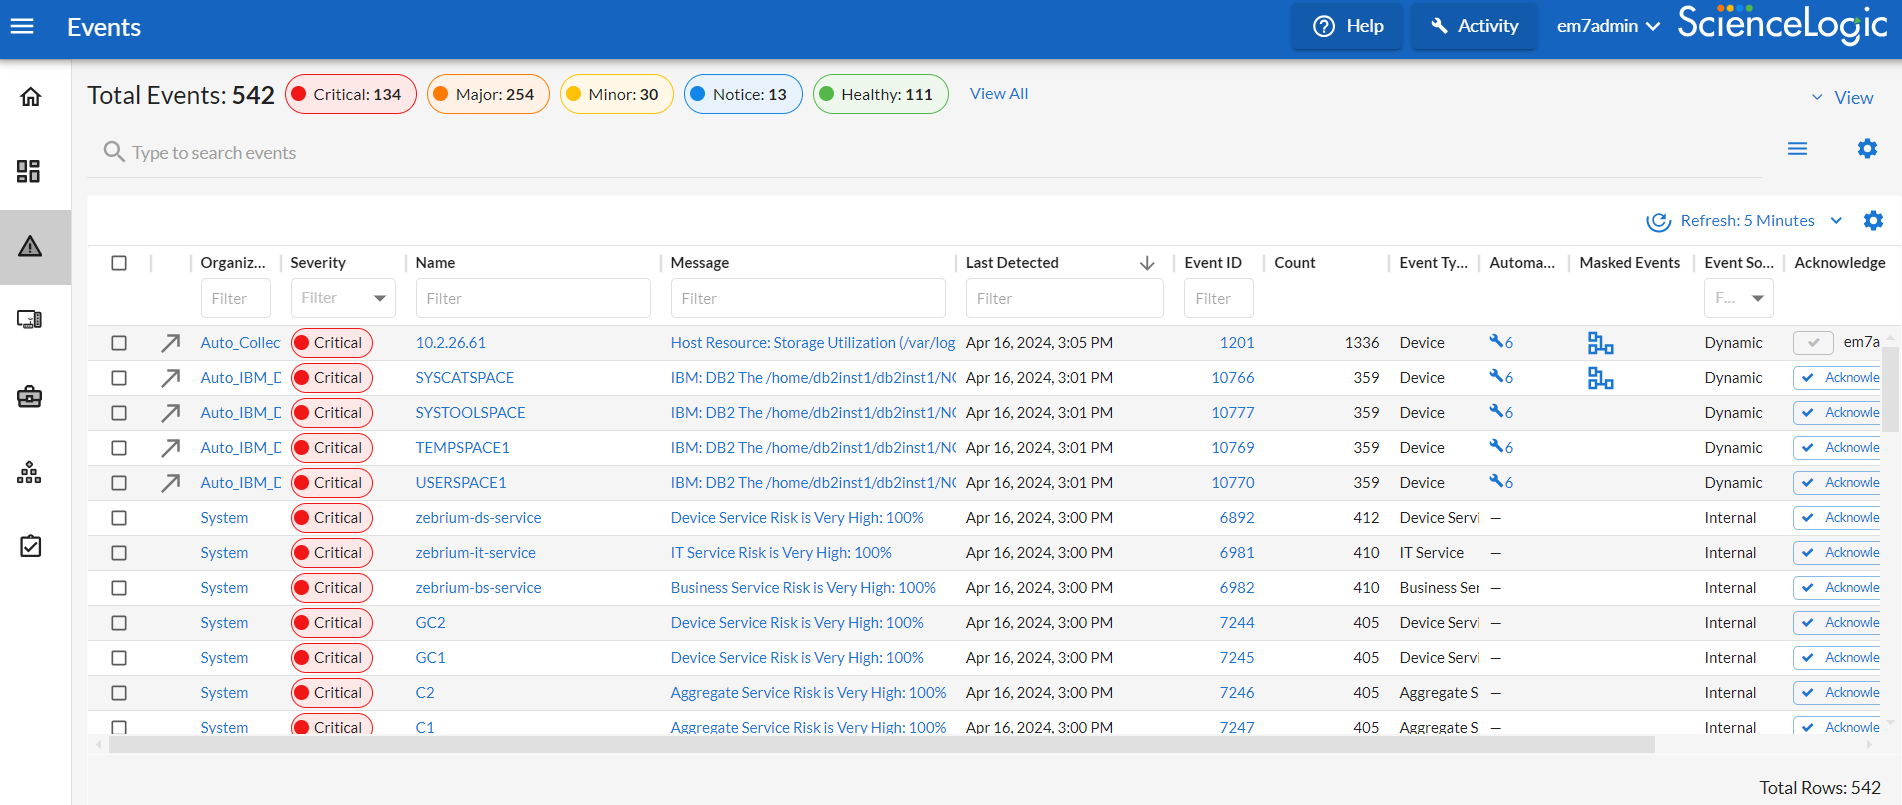
Viewing Events
The Events page displays a list of currently active events, from critical to healthy. From this tab you can acknowledge, clear, and view more information about an event. You can also view events by organization to focus on only the events that are relevant to you. For more information about using the Events page, see the section on Viewing the List of Events.
You can search for one or more related events by typing search criteria in the Search field at the top of the Events page. After you create a search, you can save that search to use later. For more information,
You can filter the list of events that display on this page by typing text in the Filter field at the top of a column. As you type, Skylar One starts to filter the list to include only those elements that include your search terms. For more information,
In addition, you can also use the or tabs in the Device Investigator or run a device report to view a list of events for a single device. For more information, see
You can also use the Organization Administration panel and the Organizational Events page to view a list of events for a single organization. For more information,
If you select one or more checkboxes next to an event, you can perform bulk actions on those events, including the following actions:
Viewing Events in the Classic Skylar One User Interface
The Event Console page in the classic Skylar One user interface also displays a list of all currently active events that you are allowed to view. From this page, you can view, acknowledge, clear, suppress, or disable an event. Depending on your configuration, you can also create an event-based ticket in Skylar One or a third-party ticketing system. For more information, see the section on Viewing Events from the Event Console in the Classic Skylar One User Interface.
You can view the "classic" list of all currently active events that you are allowed to view from the Classic Events page (Events > Classic Events). For more information, see Viewing Classic Events in the Skylar One User Interface.
You can use the Device Administration panel and the Device Reports panel to view a list of events for a single device. The events are displayed in a page that is similar to the Event Console page, but displays only events that occurred on the selected device. For more information, see
You can also use the Organization Administration panel and the Organizational Events page to view a list of events for a single organization. For more information,
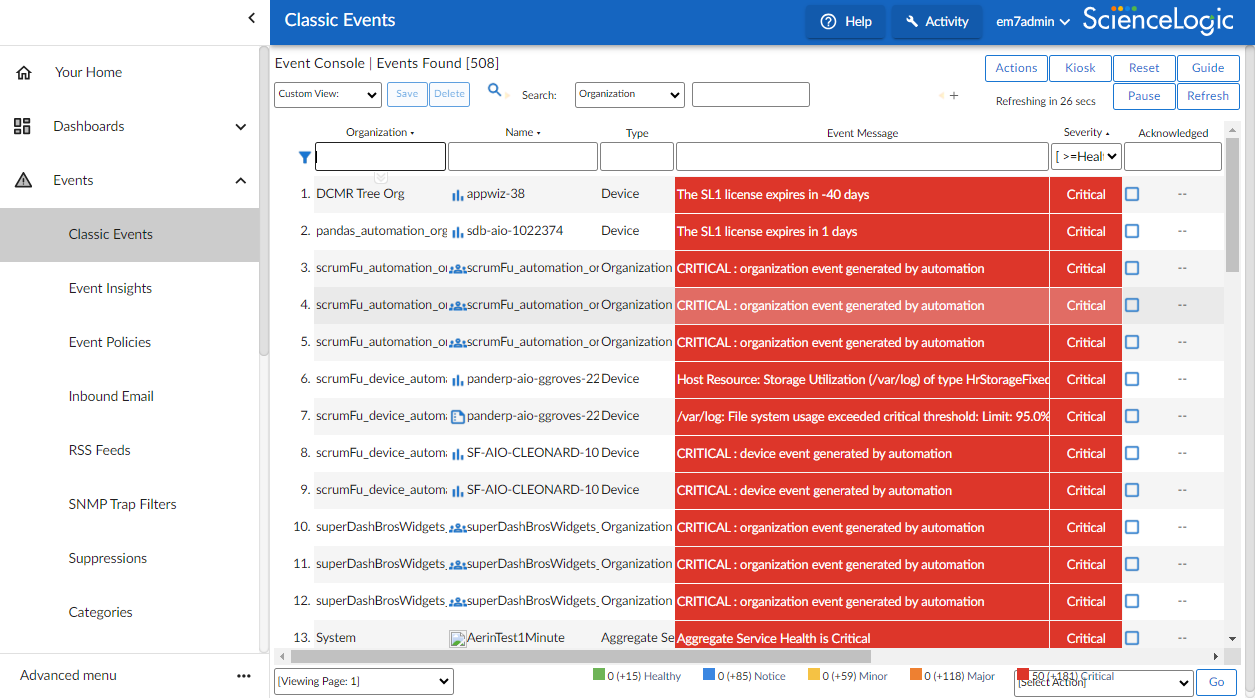
Viewing Classic Events in the Skylar One User Interface
The "classic" list of all currently active events that you are allowed to view are also available in the current Skylar One user interface. From the Classic Events page (Events > Classic Events), you can view, acknowledge, clear, suppress, or disable an event. Depending on your configuration, you can also create an event-based ticket in or a third-party ticketing system. For more information, see the section on Viewing Events from the Event Console in the Classic Skylar One User Interface.
Event Correlation
In Skylar One, event correlation means the ability to build parent-child relationships between devices and between events. When events are correlated, only the parent event is displayed on the Events page. The child events are rolled up under the parent event and are not displayed on the Events page. For the parent event, the value in the Count column will be incremented to indicate the number of correlated child events. In addition to creating parent-child relationships between devices and between events, you can define event categories that allow Skylar One to more efficiently align events.
Skylar One performs some event correlation automatically. You can also manually configure devices and events so that Skylar One treats specified events as parent events and specified events as child events. For more details, see the section on event correlation.
Defining Events
The Event Policies page (Events > Event Policies) displays a list of all event policies in Skylar One. This page also allows you to define new event definitions and edit existing event definitions.

Skylar One includes pre-defined events for the most commonly encountered conditions on the most common platforms. Skylar One allows you to customize these events and also to define new events. You do this in the Event Policies page.
If your organization requires Skylar One to monitor a condition for which Skylar One does not already include an event policy, you can define a custom event policy to meet your needs.
For more details, see the section on defining and editing event policies.
Event States
Although not displayed on the Events page, events have four distinct states:
- Active. Skylar One has created an event record. The event might appear on the Events page, or it might be masked or nested as a topology event, and therefore not appear on the Events page.
- Masked. The event record is active and appears on the Events page as a masked event. On the Events page, masked events can be caused by event masks or topology events. Masked events are nested under the event with the highest severity or under the parent event. You can click the masked events icon (
 ) to view details about the masked events.
 - Cleared. The event has been removed from the Events page. When you clear an event, you remove only a single instance of the event from the current display on the Events page. If the event occurs again on the same entity, it will reappear on the Events page.
- Prepending. An alert triggered the event, but additional criteria must be met before Skylar One creates an event record. Prepending events are grayed out in device logs.