
This  ). From there, you can select a service from the list to view detailed data on the Service Investigator page for that service.
Viewing the Global List of Business Services
The Business Services page displays a list of the business, IT, and device services that you have access to, as well as some basic info and the health, availability, and risk metrics for each service.
To go to the Business Services page, click the Business Services icon (), then click the name of the business service you would like to view details about.

The button on the Business Services page is toggled on by default to display a list of business, IT, and device services across all of the stacks in your Global Manager system. You cannot toggle the button off for business services.
For each service, the Business Services page displays the following information:
- Name. The name of the service.
- Description. A description of the service.
- Service Type. Indicates the service type. Values include Business Service, IT Service, Device Service, or a custom service page.
- Organization. The organization that owns the service.
- Contact User. The user who should be contacted with any questions about the service.
- Availability. The service's current availability value.
- Health. The service's current health value.
- Risk. The service's current risk value.
- Policy. The policy associated with the service.
- Stack ID. The numeric ID of the stack on which the service was discovered.
- Stack Name. The name of the stack on which the service was discovered.
- Last Updated By. The username of the user who last updated the service.
- Date Updated. The date and time at which the service was last updated.
- RCA Options. Indicates whether Root Cause Analysis is enabled or disabled for the service.
- Contact Organization. The organization that should be contacted with any questions about the service.
You can use the Search field to look for specific items in the list using either a basic or advanced search. For more information, see the topics Using Basic Search and Performing an Advanced Search.
If you do not see one of these columns, click the gear icon ( ) and then select Column Preferences to add or remove columns. You can also drag columns to different locations on the page or click on a column heading to sort the list by the values in that column. Skylar One retains any changes you make to the columns that appear on the page and will automatically recall those changes the next time you visit the page. For more information, see the section on Editing the Settings for an Inventory Page in the Introduction to Skylar One manual.
You can sort the list by a column's values by clicking on its column heading. You can also filter the items on the page by typing or selecting filter options in one or more of the filters found above the columns. For more information, see the topic on Filtering Inventory Pages.
You can adjust the size of the rows and the size of the row text on this inventory page. For more information, see the topic on Adjusting the Row Density.
Favoriting Business Services
In Skylar One, you can select one or more services so that they always display at the top of the list on the Business Services page. This process is called favoriting services.
For example, on the Business Services page pictured below, click the star icon ( ) to add or remove the service from your favorites list. Click the icon (
 ) again to remove the favorite status.

You can then sort your business services by their favorite status.
With favorite services, you can:
- View your favorite services at the top of the Business Services page by default.
- Include favorites in the multi-sort function.
- Filter services by favorite.
Using the Service Investigator
You can view detailed data about a specific service by clicking the service name on the Business Services page to open the Service Investigator page.
The Service Investigator page contains the following tabs:
Each of these tabs is described in the following sections.
The Overview Tab
The tab provides a single-page view of your services. This tab enables users to determine the behavioral correlation between a service's health, availability, and risk values and the events, anomalies, or other causes that might be impacting those values. This behavioral correlation feature provides users with a "big picture" view of the service and enables them to determine the root cause of any problems the service might be experiencing and then troubleshoot those problems.
The tab consists of the following widgets:
Each of these widgets is described in the following sections.
Sunburst Widget

The top dashboard widget of the tab displays either a Sunburst chart view or a Map view of your services. Use the drop-down menu in the top left corner of the widget to select which view you want to appear.
When you select the Sunburst view:
- The left pane includes a sunburst chart that displays the current Health, Availability, and Risk values for the service, as well as for any constituent IT services or device services that belong to that top-level service. For device services, the sunburst includes the device name and Health values for any devices that belong to the service. Additionally, this pane indicates the maximum number of constituent services or devices that are used for computing health, availability, and risk.
- The right panel includes a list of constituent services or devices. Each service in this panel includes icons that represent that service's Availability, Health, and Risk metrics; devices include icons that represent each device's Health value. The right panel also includes a search bar at the top of the panel that enables you to search for specific constituent services or devices.
In the sunburst chart, the center circle represents the selected service, which drives the context for the page title and Info drawer, as well as all the other panels and widgets on the tab.
You can navigate through services on the widget in the following ways:
- In the left panel, you can click any of the constituent IT services or device services in the sunburst to select that service. To return to the parent IT service or business service, click the center circle or click the button.
- In the right panel, you can click the service name of any of the constituent IT services or device services to select that service. To return to the parent IT service or business service, click the breadcrumb links that appear in the top-left corner of the widget.
By default, the sunburst displays the Health value for the selected service and its constituent services or devices. To view the current Availability or Risk value for the selected service, click the drop-down button in the lower-right corner of the left pane and select Availability or Risk.
To collapse the sunburst widget, click the up arrow icon ( ) in the top-right corner of the widget. To reopen it, click the down arrow icon (
 ).
).
Health, Availability, and Risk Widgets

The Health, Availability, and Risk widgets display a time series chart with the historical values of those metrics for the selected service from each polling cycle over the previous 24 hours.
From these widgets, you can do the following:
- Hover your mouse over the chart to view the value for each polling cycle from the previous 24 hours.
- Click and drag your mouse over a series of bars in the chart to zoom in on that specific timespan. To return to the 24-hour view, click .
- Click a specific polling cycle to view the historical Health, Availability, and Risk values for that polling cycle.
If the RCA Options field is enabled, you can also view Root Cause Analysis (RCA) information for the service to help you troubleshoot the root cause of a particular Health, Availability, or Risk value for a specific polling cycle. To view Root Cause Analysis information, click one of the polling cycles in the time series chart.
For more information about Health, Availability, and Risk, see the section Understanding Health, Availability, and Risk.
Changes Widget
The Changes widget is available to customers who have purchased Configuration and Change Management as part of their Skylar One Standard or Premium subscription. This widget displays a list of events that are created when Skylar Automation pulls change data from ServiceNow or Skylar Compliance, including both active and cleared change events.
The Changes widget appears only if it has been properly configured and enabled.
The Changes widget tile displays the number of active change events that are impacting the service. Events on the widget automatically clear after 30 minutes.
From the Changes widget, you can do the following:
- Use the drop-down menu to choose which type of change events display in the widget: Active Events or Cleared Events. Active Events are events that are currently active and whose most recent detection occurred within the selected time range. Cleared Events are events that were cleared within the selected time range, up to a maximum of 12 hours.
- Filter and search for events by date: 5, 7, 14, 30, or more than 30 days.
- Use the Search field to search for specific change events.
- For active events that are aligned to devices, click the arrow icon (
 ) next to the event to display the following information:
- Tools. A set of network diagnostic tools or user-initiated actions that you can run on the device associated with the event. Click the search bar to search for a tool or action to run, or click one of the default tools or actions that are available based on the device type and your user permissions.
- Vitals. A widget displaying the past 24 hours of CPU and memory usage for the device related to the event. You can zoom in on a shorter time frame by clicking and dragging, and you can go back to the original timespan by clicking the button.
- Logs. A list of the log entries from the device's log file, sorted from newest to oldest by default.
- View the Organizational Summary page for the organization aligned with an active event by clicking the link in the Organization column.
- View the Service Investigator or Device Investigator page for the service or device aligned with an active event by clicking the link in the Name column.
- View the Event Investigator page for an active event by clicking the link in the Message column or the Event ID column.
- For ServiceNow integrations, view the ServiceNow ticket associated with an event by clicking the link in the External Ticket column.
- Acknowledge an active event by clicking the button. When you acknowledge an event, you let other users know that you are aware of that event, and you are working on a response.
- Clear an active event by clicking the button. When you clear an event, you let other users know that the event has been addressed.
- Create a ticket from an active event.
- Align an event to an existing ticket.
- View the event policy for an active event.
- Select multiple active events for action using the check boxes next to the events.
Events Widget

The Events widget displays a list of events for the selected service. This widget has much of the same functionality as the Events page.
The Events widget tile displays the number of events of each severity type, after masking, that are currently impacting the service. When opened, the Events widget lists all events impacting the service, including masked events. Therefore, the number of events that appear in the widget tile might be smaller than the number of events that appear in the opened widget.
From the Events widget, you can do the following:
- Use the search field to search for specific events.
- For events that are aligned to devices, click the down-arrow icon (
 ) next to the event to open the Event Drawer panel, which displays the following panes:
- Vitals. A widget displaying the past 24 hours of CPU and memory usage for the device related to the event. You can zoom in on a shorter time frame by clicking and dragging, and you can go back to the original timespan by clicking the button.
- Tools. A set of network diagnostic tools or user-initiated actions that you can run on the device associated with the event. Click the search bar to search for a tool or action to run, or click one of the default tools or actions that are available based on the device type and your user permissions.
- Logs. A list of the log entries from the device's log file, sorted from newest to oldest by default.
- View the Organizational Summary page for the organization aligned with the event by clicking the link in the Organization column.
- View the Service Investigator or Device Investigator page for the service or device aligned with the event by clicking the link in the Name column.
- View the Event Investigator page for the event by clicking the link in the Message column.
- View or edit event notes by clicking the note icon (
 ) in the Event Note column or by clicking the actions icon (
 ) and selecting Edit Event Note. Event notes contain event definitions, probable causes, and resolutions for the event, along with a text field where you can add more information about the event or the service or device you are monitoring.
 - View more information about masked events by clicking the masked events icon (
 ) in the Masked Events column. Masked events are related events that occur in quick succession on a single device or service that are rolled up and posted together under one event description, with only the highest severity event displayed.
 - Acknowledge the event by clicking the button. When you acknowledge an event, you let other users know that you are aware of that event, and you are working on a response.
- Clear the event by clicking the button. When you clear an event, you let other users know that the event has been addressed.
- Create a ticket from the event.
- View the event policy.
- View a log of automations that have occurred for the event by clicking the actions icon () and selecting View Automation Actions.
- Select multiple events for action using the checkboxes next to the events.
For more information on masked events, see Viewing Events.
For more information about events, see the section on Events.
The Services/Devices Tab
For business services and IT services, the tab displays the services currently being used; for device services, the tab displays devices included in the service.
You can edit the query at the top of the tab to control which services or devices appear on the page when you click .
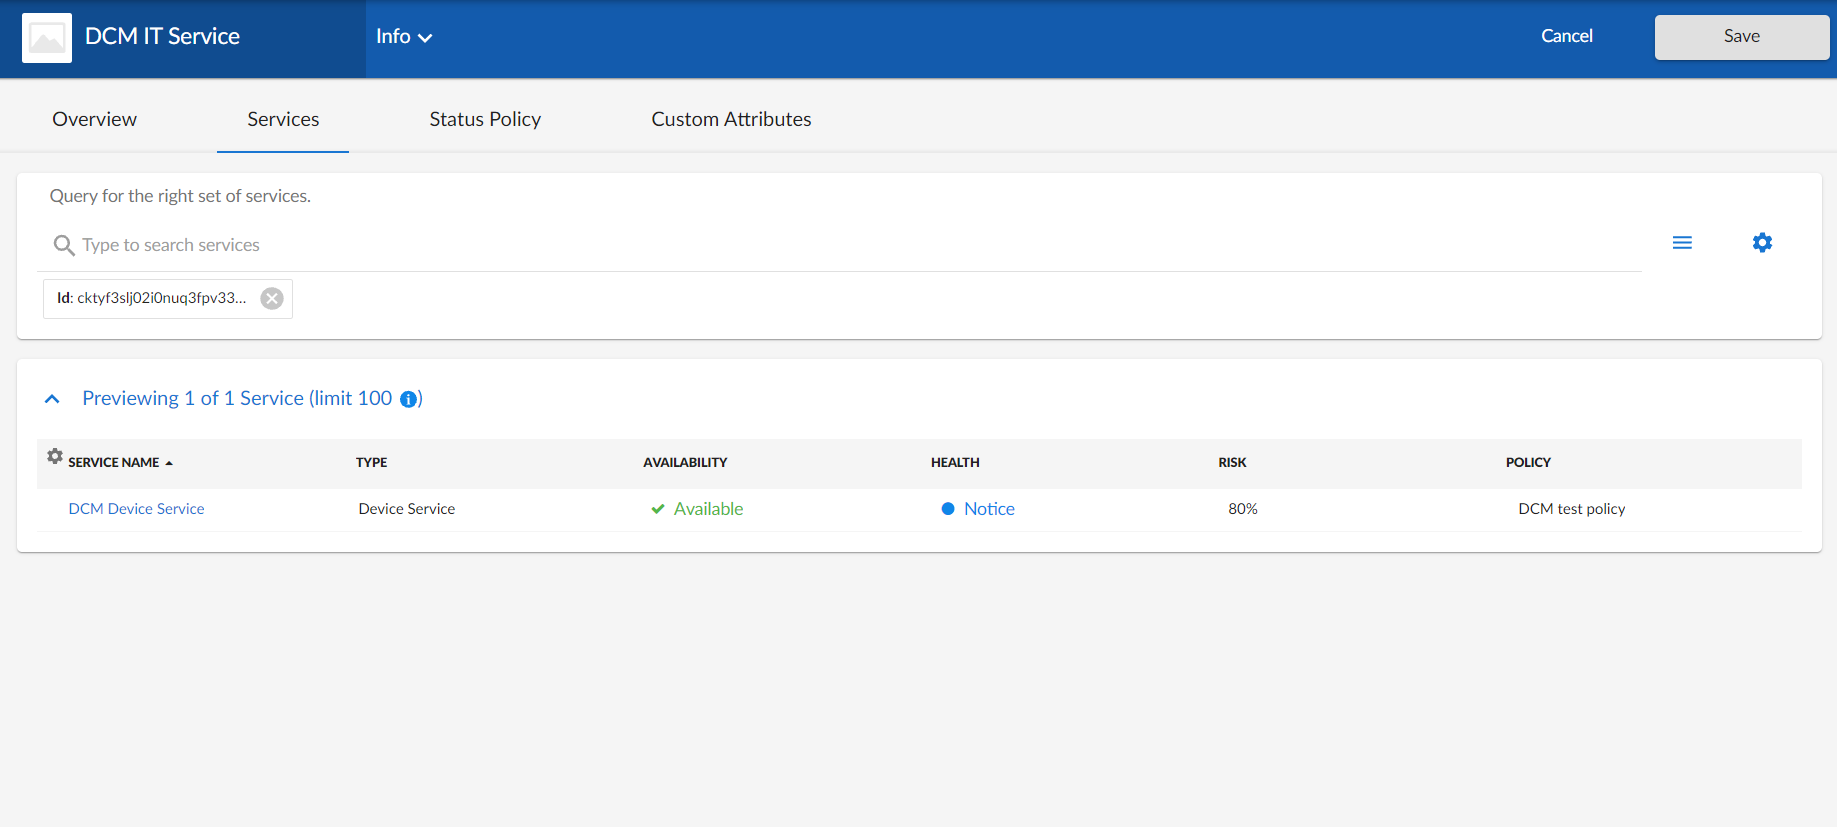
The "ANY" search option is disabled on the or tab.
For more information about the or tab for business services, IT services, and device services, see the section on Creating Business, IT, or Device Services.
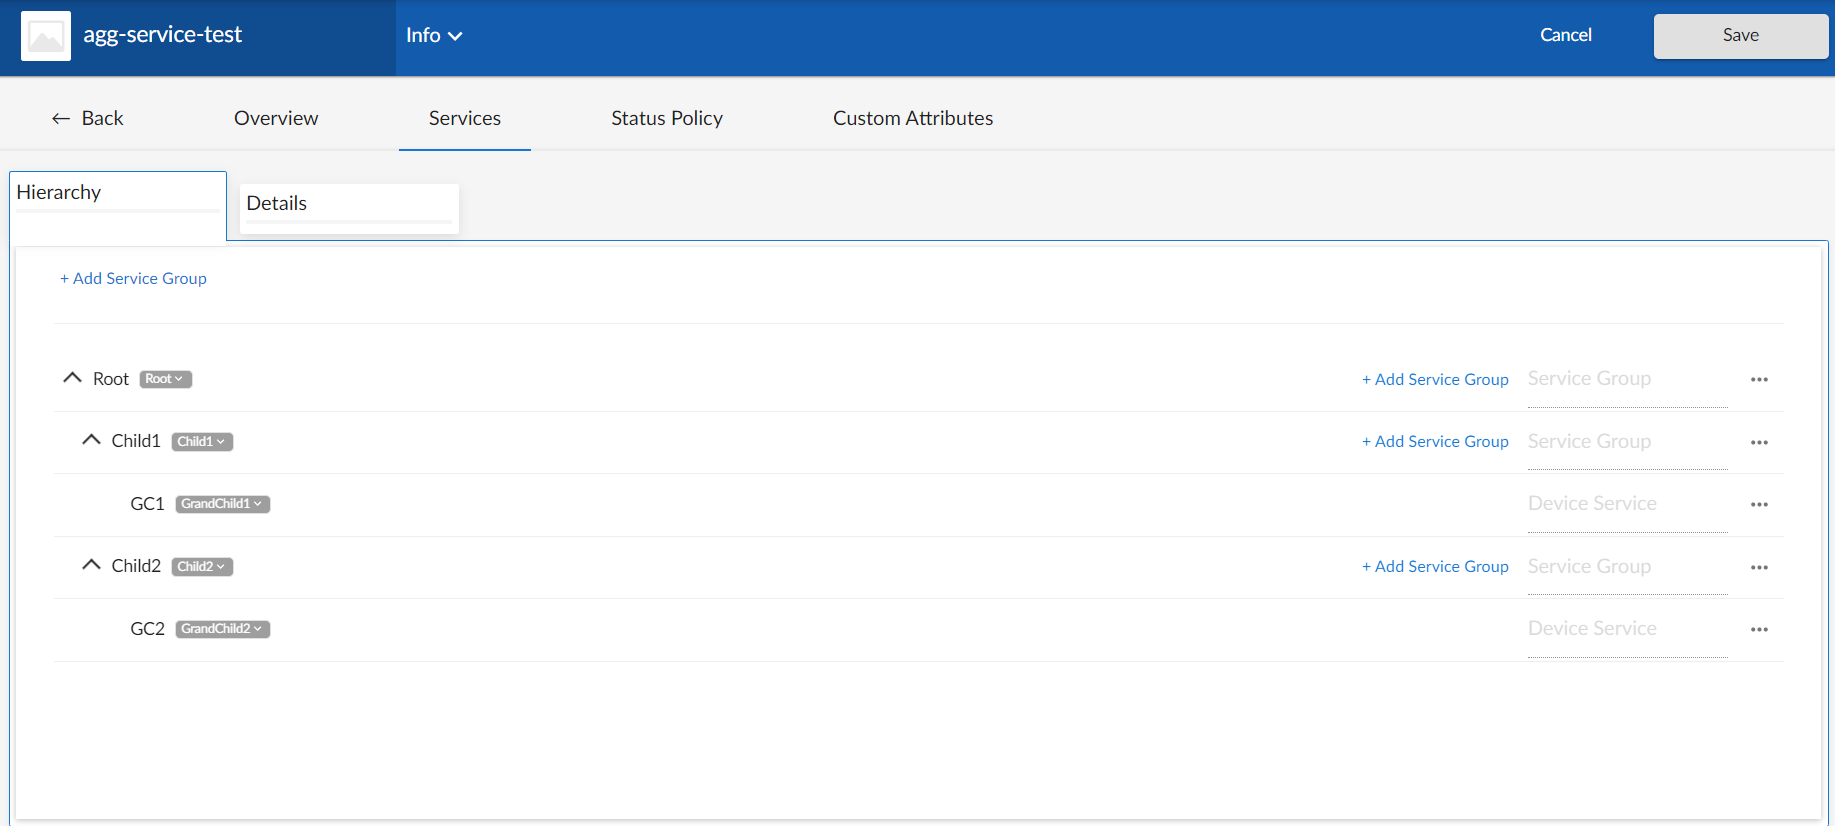
For Custom Service Models, the tab displays two tabs:
- Hierarchy. Enables you to edit your service hierarchy by adding, moving, or deleting service groups.
- Details. Includes two sub-tabs:
- Overview. Enables you to update the managing organization and visible organizations for the individual levels within your service model hierarchy.
- Status Policy. Enables you to create a new status policy or apply an existing status policy for the individual levels within your service model hierarchy.
You cannot make changes to Business Services in Global Manager. For more information about the tab for service models, see the section on Creating a Custom Service Model.
The Status Policy Tab
The tab displays a list of all the policies of that service type that are currently in the system and that can be chosen to associate with the service being viewed.

Global Manager is read-only. For more information about selecting or changing a service policy, see the section on Selecting a Service Policy. For more information about creating a new service policy, see the section on Creating a Service Policy.
Depending on the thresholds you configured on the Business Services Thresholds page (Business Services > Thresholds), Skylar One generates an alert message if a threshold is crossed.
For more information about thresholds, see the section on Managing Service Thresholds.
The Custom Attributes Tab
The tab displays a list of all of the custom attributes that are aligned with your service.

Custom Attributes are customized name-value pairs. You can use custom attributes when importing services from an integrated system to handle incoming properties that are not defined in Skylar One.
There are two categories of custom attributes:
- Base Custom Attributes. Base custom attributes for services are aligned to all services. Therefore, all base custom attributes in your Skylar One system that have a Service Resource Type appear on the tab for all services. You can edit the value of a base custom attribute for a particular service, but you cannot unalign a base custom attribute from a service.
- Extended Custom Attributes. Extended custom attributes that have a Service Resource Type can be aligned individually to one or more services. For example, you could align an extended custom attribute only to those services to which the custom field applies. You can also edit an extended attribute value for a particular service or unalign an extended custom attribute from a service.
Business services cannot use custom attributes in dashboards.
For more information about custom attributes, see the section on Custom Attributes.
Using the Info Drawer on the Service Investigator Page
The Info drawer at the top of the Service Investigator page displays the following.

The Info drawer is read-only in Global Manager.
- Owner. The organization that owns the service.
- Contact Organization. The organization that should be contacted with any questions about the service.
Visible Organizations. A list of organizations from which you can select devices to use in Device Services or IT Services. For example, if you selected Acme for this field, then any service that is aligned with Acme can access devices in the Acme organization. This implies the devices can be included in IT Services. There are two uses for Visible Organizations:
- Device Services. Allow the inclusion of devices from the owning organization, as well as the visible organizations.
- IT Services. Allow the inclusion of Device Services from the owning organization, as well as the visible organizations.
- Contact User. The user who should be contacted with any questions about the service.
- RCA Options. Allows you to enable or disable the Root Cause Analysis feature, an advanced feature for troubleshooting.
- Refresh Interval (minutes). Allows users with edit permissions to edit the Health-Availability-Risk (HAR) Provider's Poll Frequency time. The value allows a minimum of 1 minute and a maximum of 1,440 minutes (24 hours). The default minute value is 15 minutes.
- Description. A description of the service. You can use this field as a metadata tagging field that can be used in the search by a parent service. For example, if a collection of Device Services all have a description of "Shared Infrastructure", then an IT Service can search to include every Device Service in the same organization that has a description of "Shared Infrastructure". As you add more "Shared Infrastructure" device services, the IT Service automatically expands to include them. This makes building service trees quick and self-maintaining, without resorting to rigid service names.
- Include devices from visible organizations. Allows you to include devices from other organizations in a Device Service. Turn the toggle on (blue) to include other organizations' devices; turn it off (gray) to exclude other organizations' devices. This option appears only on the Service Investigator page for Device Services.