
You can view a list of all events in Skylar One or view a list of events for a single device. This section describes how to perform both tasks.
Viewing the List of Events
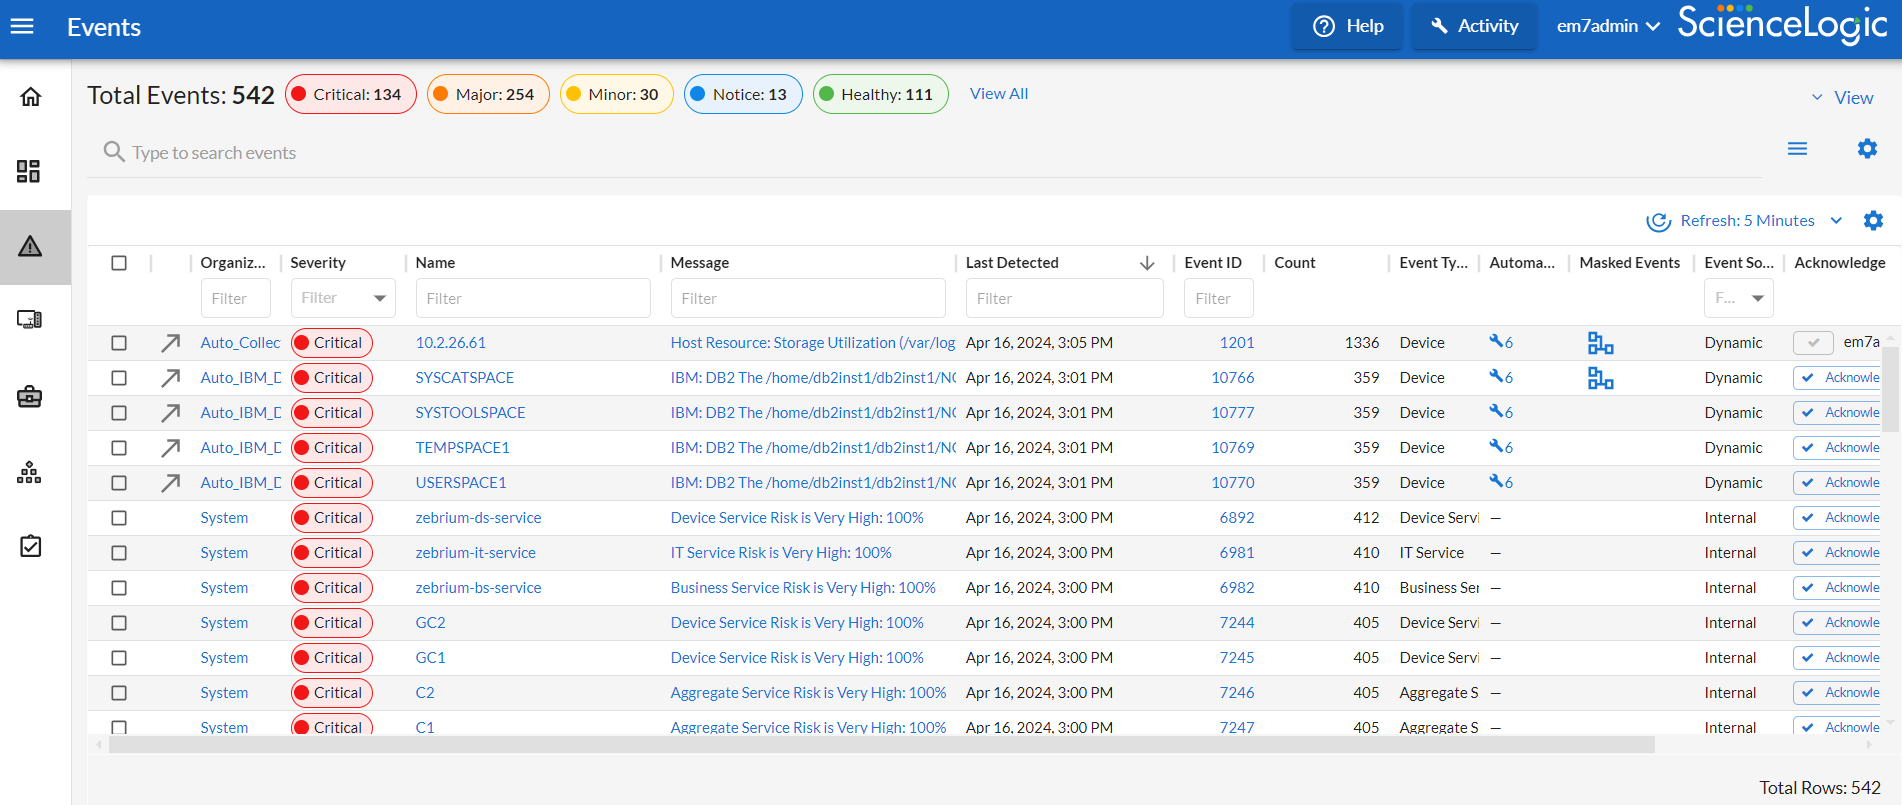
The Events page displays a list of currently active events, from critical to healthy. From this page, you can acknowledge, clear, and view more information about an event. You can also view events by organization to focus on only the events that are relevant to you.
By default, the events listed on the Events page are sorted by severity, highest to lowest, and then secondarily sorted by the events' last occurrences, most recent to least recent. This ensures that the most severe and most recent events appear at the top of the page. If you prefer, you can change the sorting preferences, and Skylar One recalls those changes the next time you return to the Events page.
To navigate to the Events inventory page, click the Events icon ( ).
).
You can use the Search field to look for specific items in the list using either a basic or advanced search. For more information, see the topics Using Basic Search and Performing an Advanced Search.
You can sort the list by a column's values by clicking on its column heading. You can also filter the items on the page by typing or selecting filter options in one or more of the filters found above the columns. For more information, see the topic on Filtering Inventory Pages.
You can rearrange the columns in the list by clicking and dragging the column to a new location. You can adjust a column's width by clicking and dragging the right edge of the column. For more information about editing and adding columns, see the topic on Editing the Settings for an Inventory Page.
You can adjust the size of the rows and the size of the row text on this inventory page. For more information, see the topic on Adjusting the Row Density.
For each event, the Events page displays the following information:
- Organization. The organization with which the event is associated. Click the organization hyperlink to view more information about the organization.
- Severity. The severity of the event.
-
Name. The name of the entity associated with the event. Click the name hyperlink to view more information about the entity.
-
Message. The message generated for the event. Click the message hyperlink to go to the Event Investigator, where you can view more information about the event, including a description, its probable cause, and possible resolutions, among other details. You can also view the Event Investigator page by clicking the actions icon (
 ) for the event and selecting View Event.
 -
Last Detected. The date and time at which the event last occurred on the entity.
-
Age. The number of days, hours, and minutes since the first occurrence of the event. This is also the time since the event occurred without the event having been cleared.
-
Ticket ID. The ticket ID of the ticket that has been created for the event, if applicable.
-
Count. The number of times the event has occurred.
-
Event Note. Click the note icon (
 ) to view any existing user-defined notes about the event or to create or edit a note about the event. When you do so, the Edit Event Note modal page appears, where you can create or edit a note and save your changes.
 You can also view, create, or edit event notes by clicking the actions icon (
) for the event and selecting Edit Event Note. -
Masked Events. If the event has occurred multiple times on the same device that uses the event mask setting, click the masked events icon (
 ) to go to the Masked Events Overview modal, where you can view details about the masked events.
 -
Automated Actions. The number of times the event has triggered the execution of an automation policy. If the event has triggered one or more automated actions, click the number hyperlink to go to the Event Actions Log, where you can view a log of all automated actions that have occurred for the event.
You can also view the Event Actions Log modal page by clicking the actions icon (
) for the event and selecting View Automation Actions. - Event ID. The unique ID for the event, generated by Skylar One. Click the ID hyperlink to go to the Event Investigator.
- Event Source. The system or application that generated this event.
- Event Type. The type of entity associated with the event.
- Aggregate Services
- Assets
- Business Services
- Device Services
- Devices
- Interfaces
- IP networks
- IT Services
- Organizations
- User Accounts
- Vendors
- Virtual Interfaces
-
External Ticket. The numeric ID associated with a ticket from an external ticketing system outside of Skylar One. Click the ticket reference value to view the external ticket in a new window. You can display up to three External Ticket columns.
To link an external ticket to an event, you must create a custom run book automation policy and a custom run book action or use the ScienceLogic APIs. For help with these tasks, contact ScienceLogic Customer Support.
- Acknowledge. If the event has not been acknowledged, this column displays an button; click the button to acknowledge the event. If the event has been acknowledged, this column displays a check-mark character and specifies the user who acknowledged the event.
- Clear. Click the button to clear the event. When you do so, the event is removed from the Events page.
If you have defined any base or extended custom attributes, you can also add those custom attributes as columns that appear on the Events page.
Events That Do Not Appear on the Events Page
In Skylar One, there are four types of events that might not appear on the Events page (or the Event Console page):
- Rolled-up events
- Suppressed events
- Topology events
- Event masks
For more information about these event types, see the section on Event Correlation.
Understanding Event Severity
Each event in Skylar One is color-coded to make it easy for you to determine its severity:
| Color | Severity | Description |
|---|---|---|
| Red | Critical | Indicates a condition that can seriously impair or curtail service and requires immediate attention (for example, service or system outages). |
| Orange | Major | Indicates a condition that impacts service and requires immediate investigation. |
| Yellow | Minor | Indicates a condition that does not currently impair service, but the condition needs to be corrected before it becomes more severe. |
| Blue | Notice | Indicates a condition that users should be aware of but does not affect service. |
| Green | Healthy | Indicates that a device or condition has returned to a healthy state. Frequently, a healthy event is generated after a problem has been fixed. |
Searching and Filtering the List of Events
This section explains how to filter the list of events so you can quickly locate and address any potential issues in your environment.
Filtering Events by Organization and Service
You can view events from all organizations or services, or filter down to just the organizations or services you want to monitor for events.
To view events by organization or service:
- On the Events page, click the View menu.
-
Select the Group by organization and/or the Group by business service toggle. The relevant panel appears on the left with a list of events sorted by severity for each organization and/or service.
-
On the left panel, click the check mark icon (
 ) to filter the list of events based on the organization or service you selected.
In the right-hand panel, click the name of a service to go to the Service Investigator page for that service. Click the name of an organization to go to the Organizational Summary page for that organization.
- To hide the Organizations or Business Services panels, click the left arrow icon (
 ). Click the right arrow icon (
 ) to expand the panel again.
Filtering Events by Severity
The Events page displays a list of currently active events, which can be sorted by any column, such as severity from critical to healthy. You can filter the list of events by severity by clicking one or more of the five colored buttons near the top of the Events page.
When you click a severity button, the list displays only events with the severity you selected. The severity button you clicked remains in color, while the other buttons turn gray.
For more information about severity values, see the section Understanding Event Severity.
To clear a severity filter, click the View All link next to the severity buttons.
To add color-coded highlights to rows on the events inventory table that correspond to the severity color of the event, click the grid settings ( ) icon, select Event Table Preferences, and then toggle on Row Severity Highlighting.
Filtering for Masked Events
When a device uses the event mask setting, events that occur on a single device within a specified span of time are grouped together, and only the event with the highest severity is displayed on the Events page. This allows related events that occur in quick succession on a single device to be rolled up and posted together under one event description. For example, if a device cannot connect to the network, multiple other services on the device raise events. Skylar One displays the event with the highest severity and rolls up all the other events.
On the Events page, any event that contains masked events includes a masked events icon () in the Masked Events column:
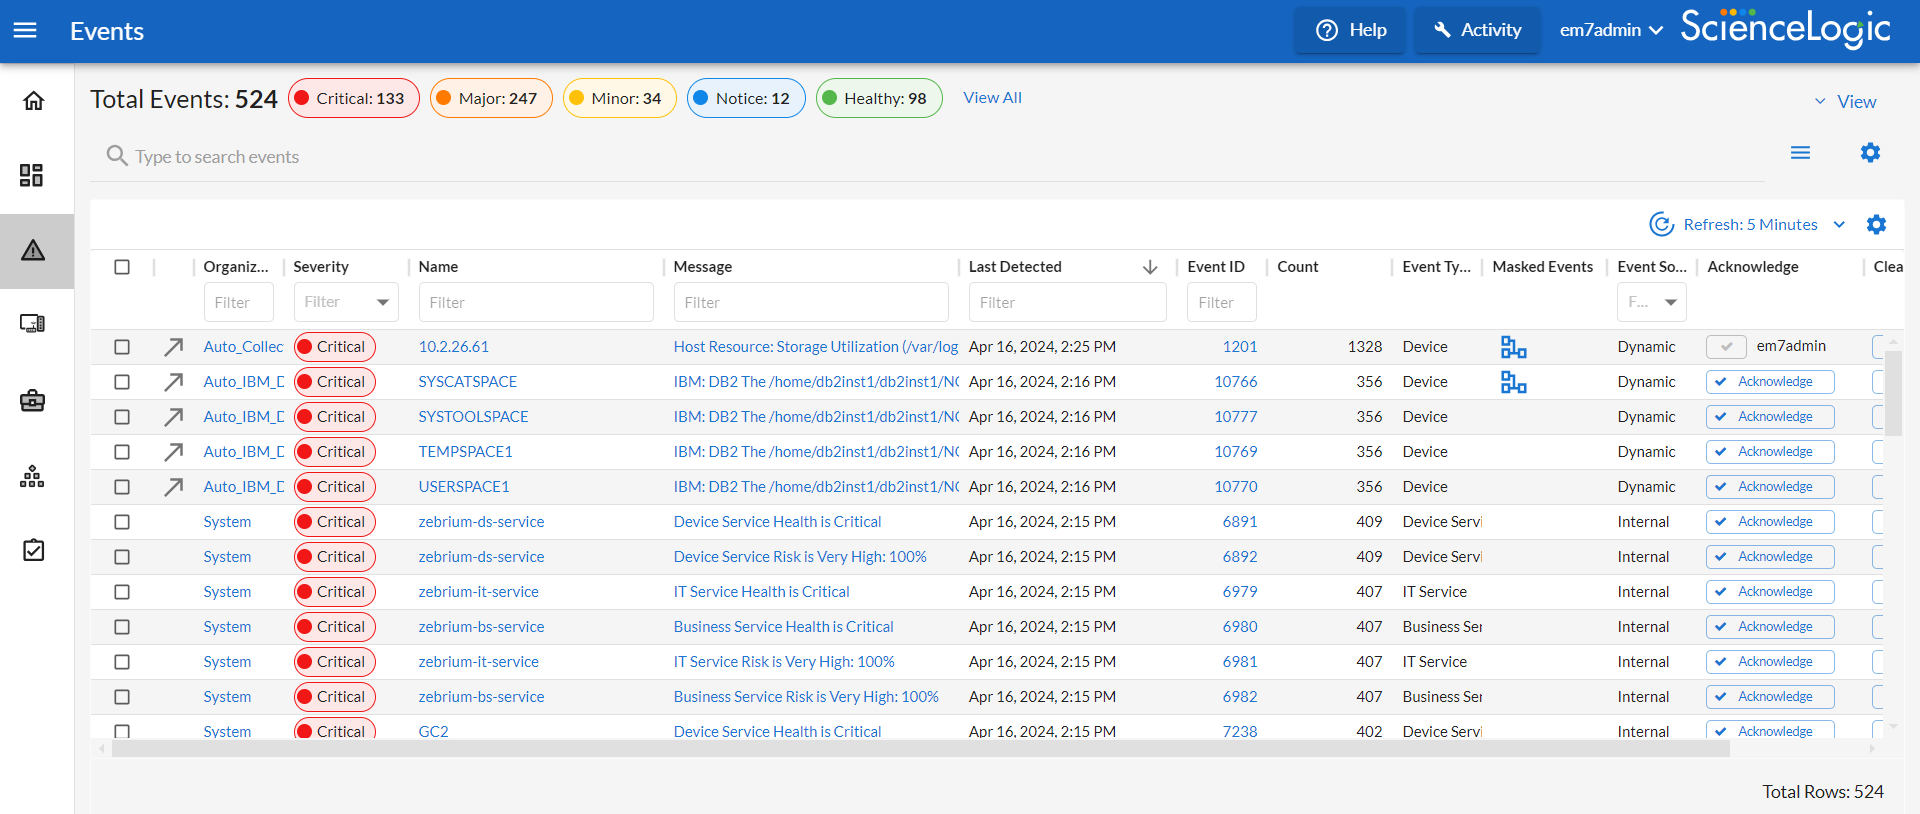
To add the Masked Events column from the table on the Events page, click the grid settings () icon, select Event Table Preferences, and then toggle on View Event Masking. To remove the Masked Events column, toggle off View Event Masking. If you remove the Masked Events column, any events that would have appeared on this table appear in the main event console instead.
To view more information about masked events:
- On the Events page, click the masked events icon () in the Masked Events column for the relevant event. The Masked Events Overview modal for that event appears.
- The Masked Events Overview modal includes the following details about the masking and masked events:
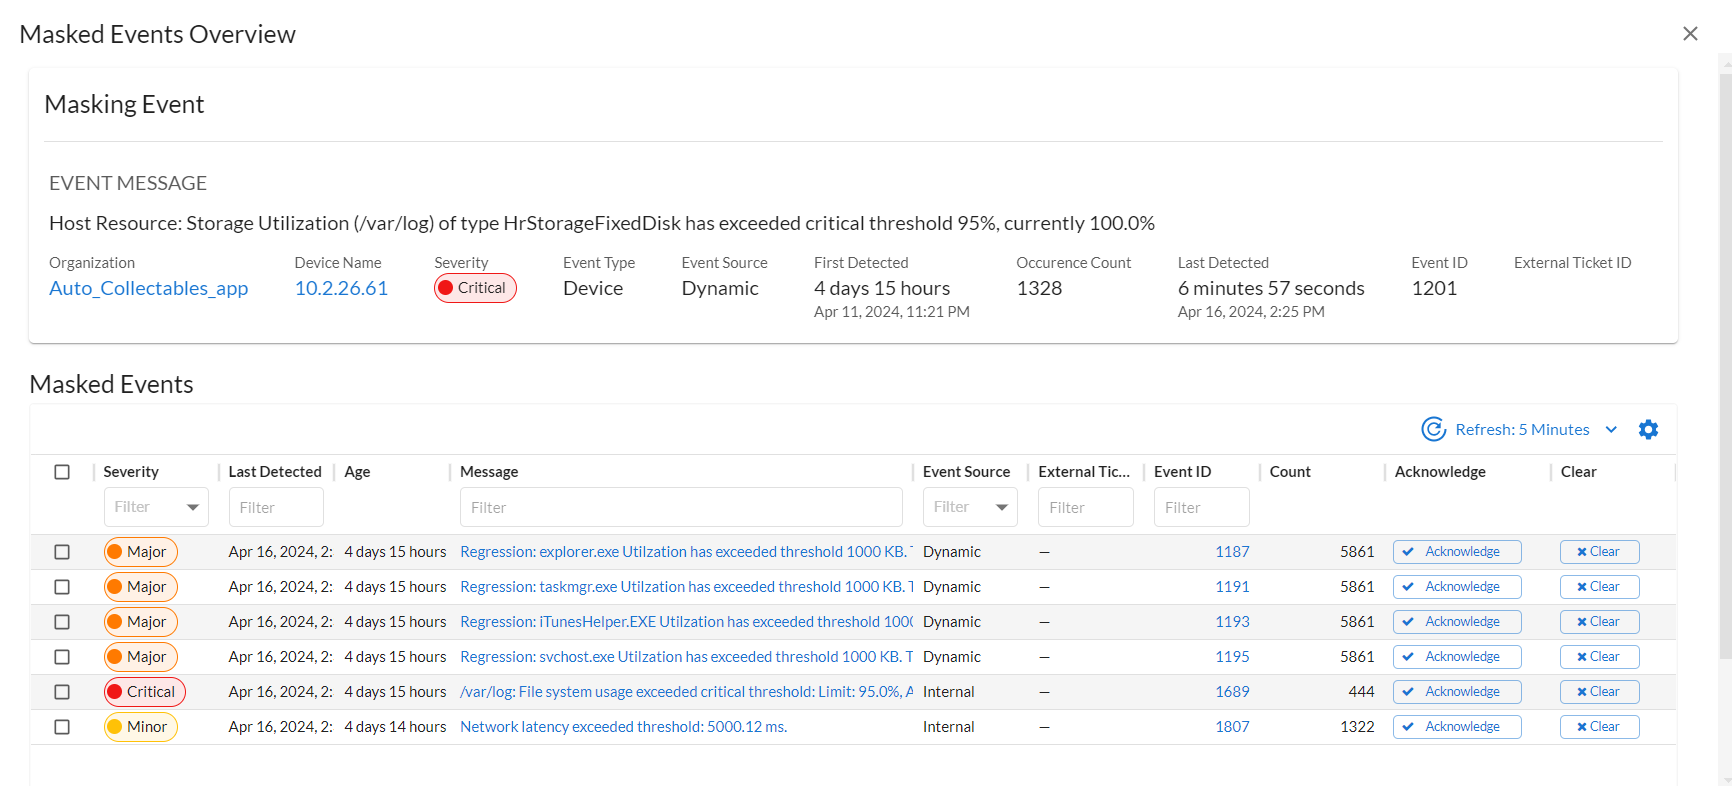
- Masking Event. This section includes information about the masking event, which is the event that appears on the Events page.
- Masked Events. This section includes information about the masked events, which are related events that are configured to be maskable and grouped together under the masking event if they occur within a specified period of time.
Viewing Additional Data about an Event
On the Events page and the Devices page, you can click the open icon ( ) next to an event or device to open a Device Summary modal:
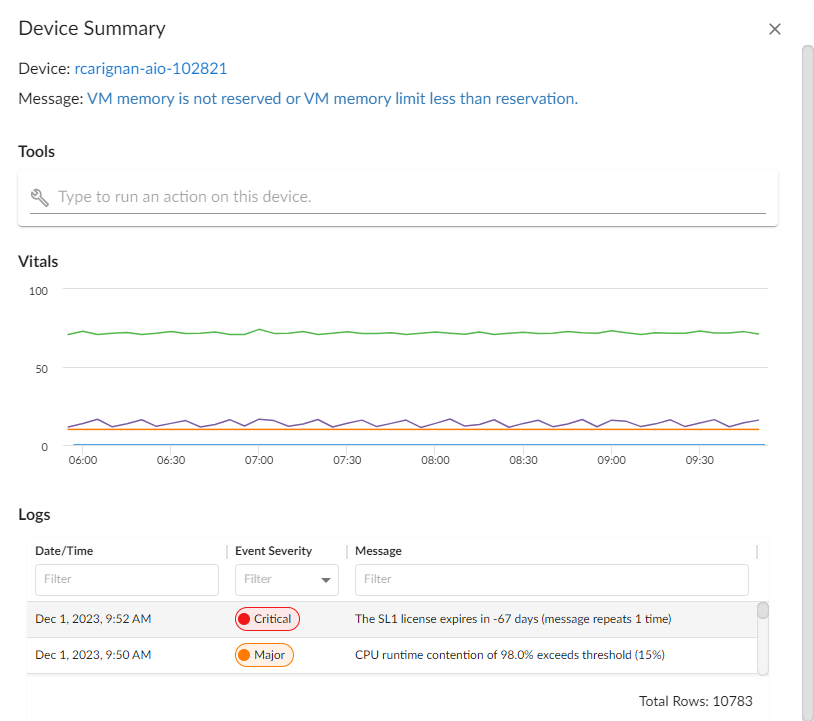
On the Events page, the Device Summary modal displays only for events that are aligned with devices.
The detail window for that device contains the Tools pane, the Vitals pane, and the Logs pane:
- The Tools pane enables you to run a set of diagnostic tools or user-initiated actions in the Activity Center, or to click on custom links that will open in a separate browser window. Click the search bar to search for tools, actions, or custom links that are available for the device.
- The Vitals pane displays graph data for the past four hours of CPU usage, memory usage, and latency for that device, where relevant. You can zoom in on a shorter time frame in the Vitals graph by clicking and dragging, and you can go back to the original time span by clicking the button.
- The Logs pane displays a list of events associated with that device.
To open the detail or Investigator page for an item, click the link for the item name at the top of the detail window.
Viewing Automation Actions
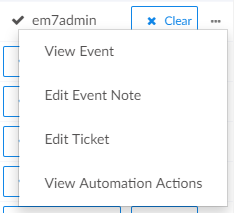
To view a log of automated actions that have occurred for an event, on the Events page, click the actions icon () for the event and select View Automation Actions. When you do so, the Event Actions Log modal appears.
You can also view the Event Actions Log modal by clicking the hyperlink in the Automated Actions column for a particular event on the Events page.
The Event Actions Log displays a history of all automation actions that Skylar One executed in response to the event.
Each entry in the Event Actions Log modal includes:
- The date and time when the action was executed
- The automation policy that triggered the action
- The name of the action policy
- The result of the action
Using the Event Investigator
The Event Investigator page provides details about the event as well as the device associated with the event, where relevant.
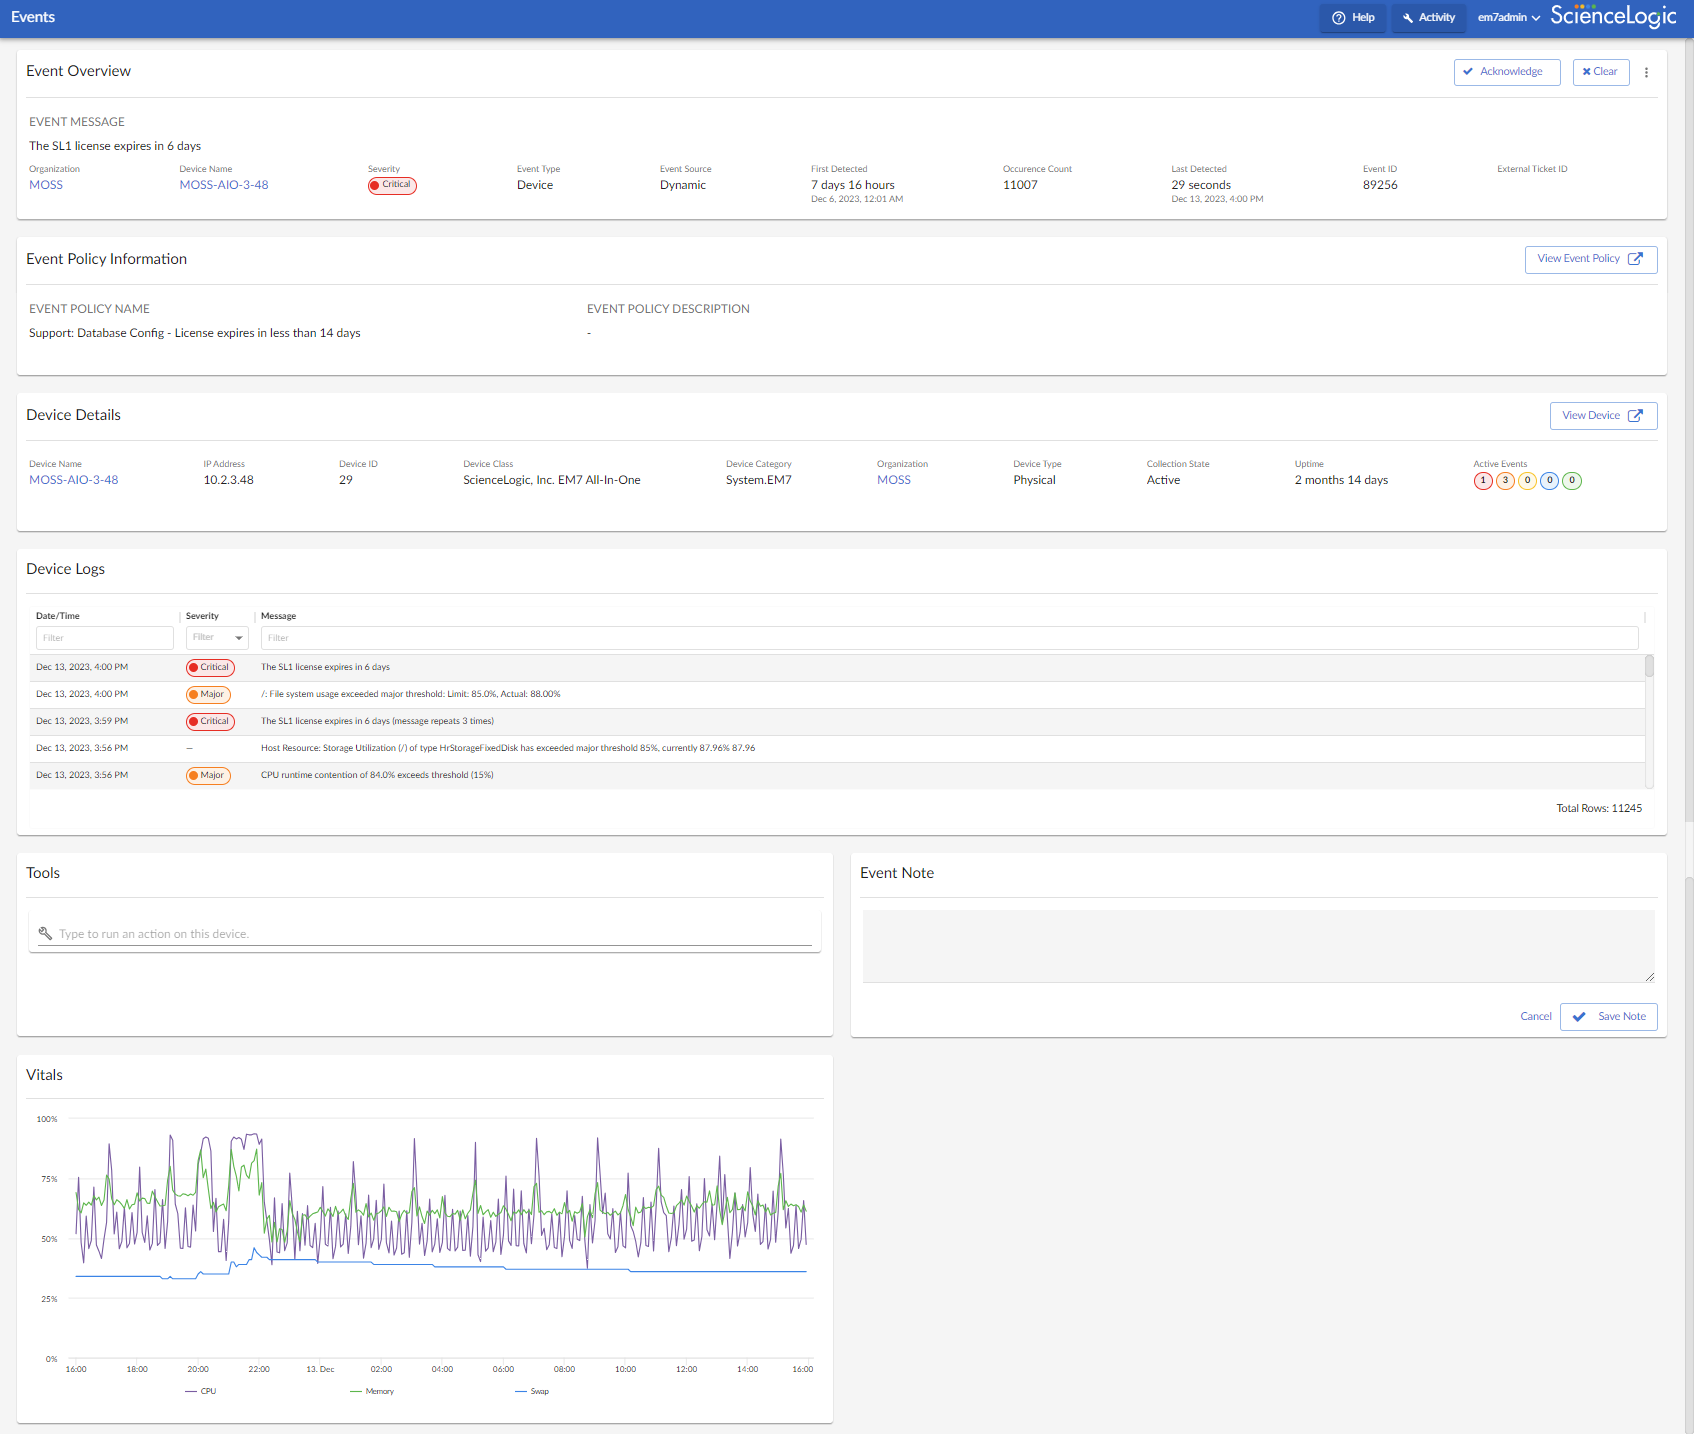
To get to the Event Investigator page, click the linked text in the Message column of the Events page, or click the actions icon () for the event and select View Event. Alternatively, you can click the ID associated with the event in the Event ID column.
The top pane of the Event Investigator page contains basic event details. From this pane, you can also acknowledge the event, clear the event, or click the actions icon () and select Create Ticket to create a ticket for that event. If an event was acknowledged by another user and you have the relevant permissions, you can click the button to acknowledge that event.
On the Event Investigator page, click the name of an aligned device or service to go to the Investigator page for that device or service. When you do so, information about the event appears in a panel at the top of the page. This panel gives you the option to view conflicts and resolutions for that event.
The Event Investigator page includes the following widgets:
- Event Overview. Displays additional information about the event, such as details about the type of event, the source of the event, the time and date the event was first detected, the number of concurrences, and more.
- Masked events. A list of all masked events for the device, where relevant. When a device uses the event mask setting, events that occur on a single device within a specified span of time are grouped together, and only the event with the highest severity is displayed in the Events page.
- Event Policy Information. Displays information about the event policy and any descriptions associated with the event.
- Device Details. A Consolidated widget that displays information about the device, such as the class and category the device belongs to, the type of device, the number of active events for each severity level, and more.
- Device Logs. A list of log entries from the device's log, sorted from newest to oldest by default.
- Tools. A set of network diagnostic tools or user-initiated actions that you can run on the device associated with the event. Click the search bar to search for a tool or action to run, or click one of the default tools or actions that are available based on the device type and your user permissions.
- Event Note. A text field where you can add new text and edit existing text related to the event and the device associated with the event.
- Vitals. A widget that displays the past 24 hours of CPU and memory usage for the device related to the event.
- Skylar Analytics Summary. Displays a graph of data from Skylar AI-sourced events corresponding with the event ID.
Using the Action Runner
You can access the Action Runner from either the Events page or the Event Investigator page. The Action Runner enables you to run a set of diagnostic tools or user-initiated actions, or to click on custom links that will open related records in external systems in a separate browser window.
The tools and actions that are available in the Action Runner are based on the device type and your user permissions, as determined by your organization assignment and access hooks. For example, if a device does not have an IP address, only the Availability tool will be available.
For more information about user-initiated actions, see the section on User-Initiated Automations.
To use the Action Runner:
- Access the Action Runner for events in one of the following ways:
- On the Action Runner page, open the Event Drawer for a particular event. Click the search bar in the Tools pane.
- On the Action Runner page, click the search bar in the Tools pane.
- Click the button in the top navigation bar of any page in Skylar One. Click the search bar.
- When you click the search bar, a list displays the default tools, actions, or custom links that are available for the selected device. Click one of these tools, actions, or custom links, or use the search bar to search for a tool or action that is not listed. The following default tools are available in the Action Runner:
-
Availability. Displays the results of an availability check of the device, using the port and protocol specified in the Availability Port and Availability Protocol fields on the tab for this device.
-
Ping. Displays statistics returned by the ping tool. The ping tool sends a packet to the device's IP address (the one used by Skylar One to communicate with the device) and waits for a reply. Skylar One then displays the number of seconds it took to receive a reply from the device and the number of bytes returned from the device. If the device has an IPv6 address, Skylar One uses the appropriate IPv6 ping command.
-
Who Is. Displays information about the device's IP, including the organization that registered the IP and contacts within that organization.
-
Port Scan. Displays a list of all open ports on the device at the time of the scan.
-
Deep Port Scan. Displays a list of all open ports and as much detail about each open port as the deep port scanner can retrieve.
-
ARP Lookup. Displays a list of IP addresses for the device and the resolved Ethernet physical address (MAC address) for each IP address.
-
ARP Ping. Displays the results from the ARP Ping tool. The ARP Ping tool is similar in function to ping, but it uses the ARP protocol instead of ICMP. The ARP Ping tool can be used only on the local network.
-
Trace Route. Displays the network route between Skylar One and the device. The tool provides details on each hop to the endpoint. If the device has an IPv6 address, Skylar One uses the appropriate IPv6 traceroute command.
The tools found in the Action Runner can also be found in the Device Toolbox in the classic Skylar One user interface.
- If you clicked a custom link, the link opens in a new browser window or tab. If you clicked on a tool or action, then its progress and results appear in a log in the Activity Center page as it runs.
- After the tool or action has run, if you want to run it again, click the button. This button appears only for activities completed during your current session.
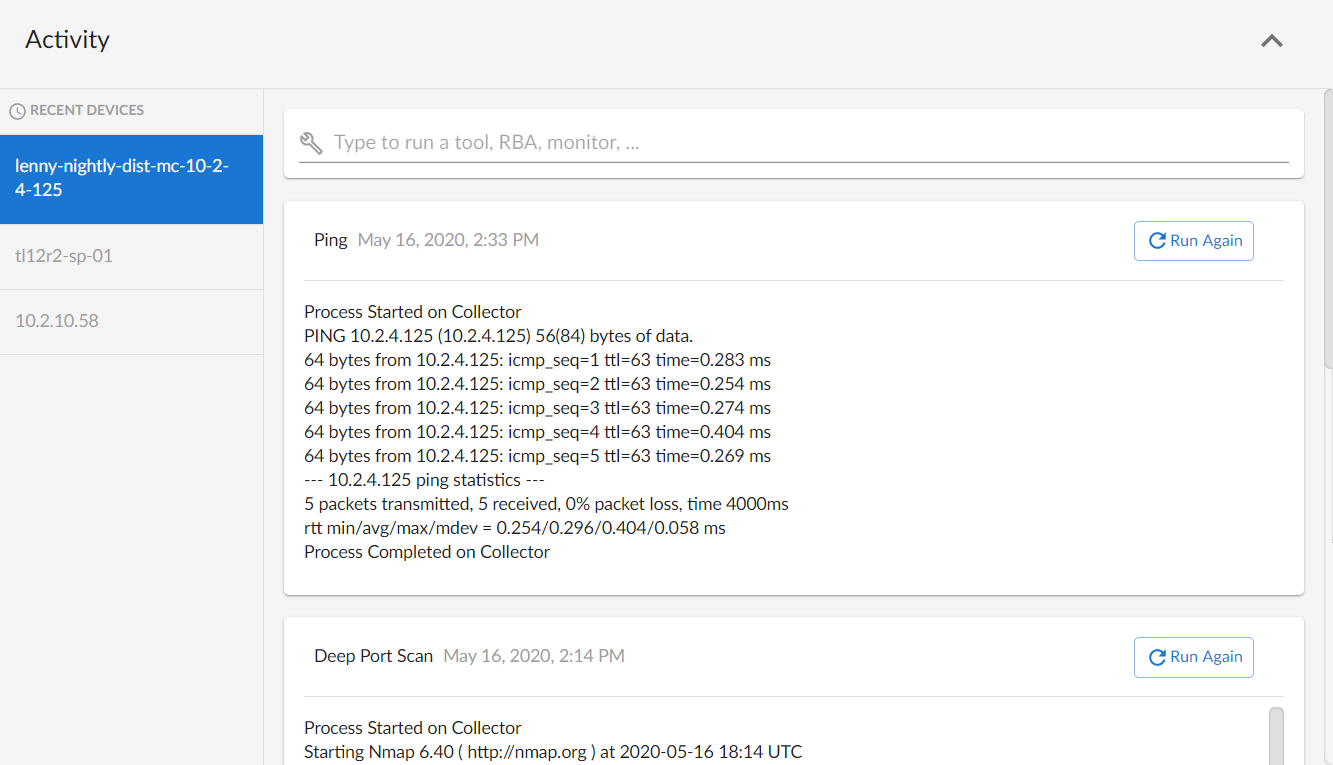
The left pane of the Activity Center page displays a list of devices for which you have most recently used the Action Runner, with the current device at the top of the list. To use the Action Runner for any of the other recently used devices, or to view historical logs for the tools or actions that have been run on those devices, click on the device name.
Viewing Events for a Single Device
On the tab of the Device Investigator, you can view a list of events associated with the device.
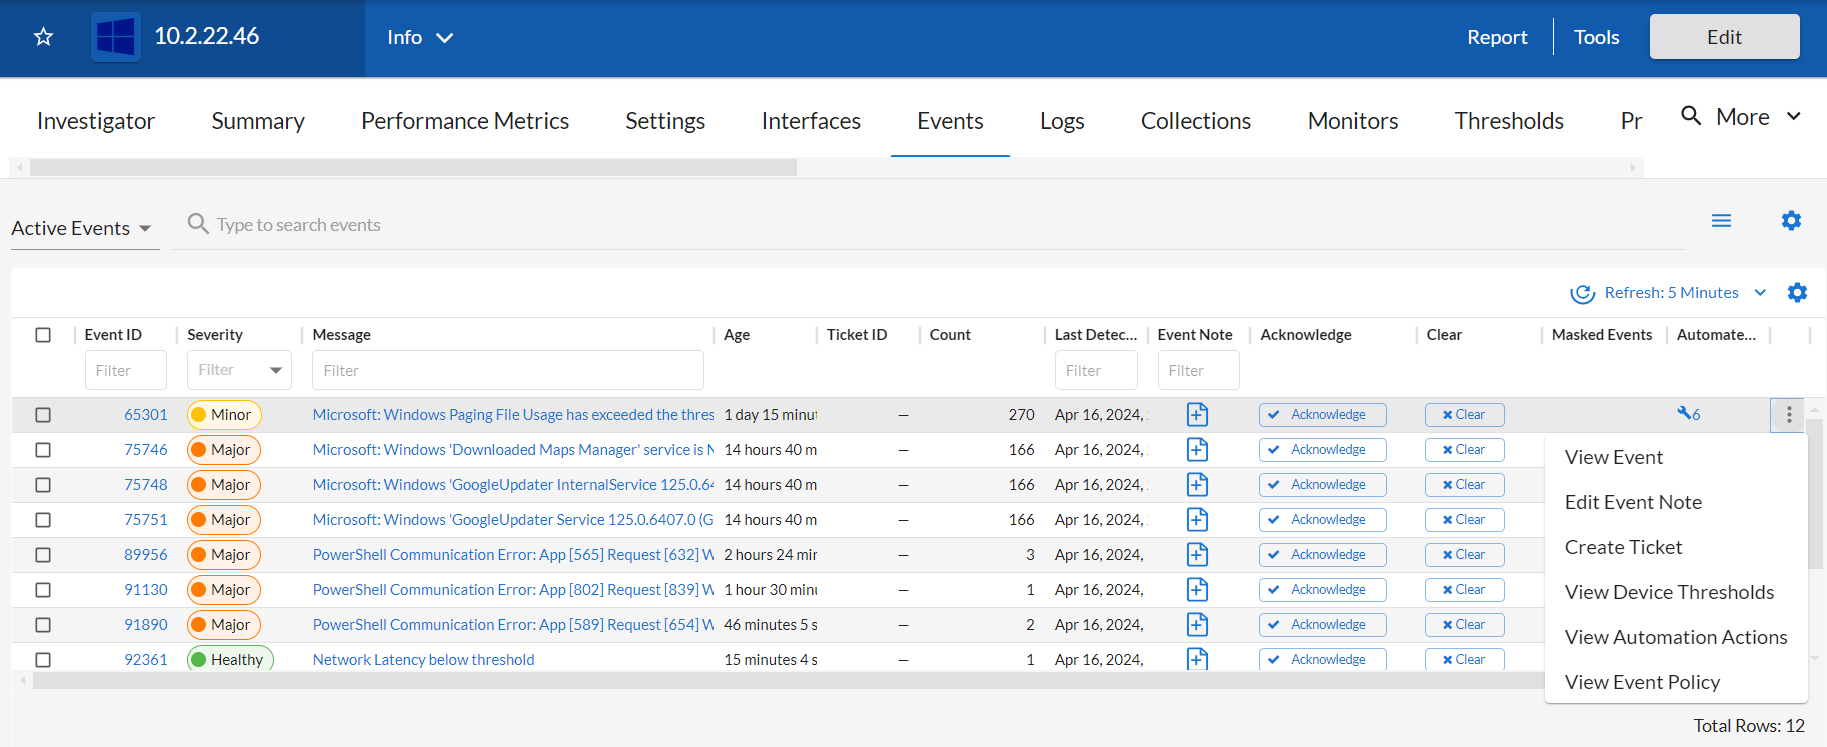
You can rearrange the columns in the list by clicking and dragging the column to a new location. You can adjust a column's width by clicking and dragging the right edge of the column. For more information about editing and adding columns, see the topic on Editing the Settings for an Inventory Page.
You can adjust the size of the rows and the size of the row text on this inventory page. For more information, see the topic on Adjusting the Row Density.
You can toggle between Active events and Cleared events by using the drop-down to the left of the Search field. On this tab, you can also acknowledge and clear an event if you have permission for those actions.
For each event, the tab displays the following information:
-
Event ID. The unique ID for the event, generated by Skylar One. The ID appears as a hyperlink. To view the Event Investigator page for the event, click the ID hyperlink. For more information about the Event Investigator page, see the section on Using the Event Investigator.
-
Severity. The severity of the event. For more information about severity values, see the section Understanding Event Severity.
-
Message. The message generated for the event. The message appears as a hyperlink. To view the Event Investigator page for the event, click the Message hyperlink. For more information about the Event Investigator page, see the section on Using the Event Investigator.
-
Age. The amount of time (in days, hours, and minutes) since the event first occurred or since its last occurrence without having been cleared.
-
Ticket ID. If a ticket has been created for the event, this column displays the ticket ID of that ticket.
-
Count. The number of times this event has occurred, the number of child events associated with the event, or the number of masked events associated with the event.
-
Last Detected. The date and time at which the event last occurred on the device.
-
External Ticket. The numeric ID associated with a ticket from an external ticketing system (that is, a ticket that was not created in Skylar One). If this field displays a value, you can click on that value to spawn a new window and view the external ticket. You can display up to three External Ticket columns.
To link an external ticket to an event, you must create a custom run book automation policy and a custom run book action or use the ScienceLogic APIs. For help with these tasks, contact ScienceLogic Customer Support.
- Event Note. A user-defined note to accompany the event. To create or edit a note, click the note icon (). The Edit Event Note modal appears, where you can create or edit a note and save your changes.
- Acknowledge. If the event has been acknowledged, this column displays a check mark and the username of the user who acknowledged the event. If the event has not yet been acknowledged, this column displays an button; click the button to acknowledge the event. When you acknowledge an event, you let other users know that you are aware of that event and are working on a response.
- Clear. Click the button to clear the event. When you clear an event, you let other users know that this event has been addressed. Clearing an event removes a single instance of the event from the tab. If the same event occurs again on the same device, it will reappear in the tab, even if you have previously cleared that event.
- Event Source. The system or application that generated this event. For more information, see the section on Event Sources.
- Masked Events. If the event has occurred multiple times on the same device that uses the event mask setting, click the masked events icon () to open the Masked Events Overview modal. In this modal, you can view details about the masked events. For more information, see the section Filtering for Masked Events.
- Automated Actions. The number of times the event has triggered the execution of an automation policy. If the event has triggered one or more automated actions, click the number hyperlink to go to the Event Actions Log, where you can view a log of all automated actions that have occurred for the event. For more information, see the section Viewing Automation Actions.
You can also view the Event Actions Log modal by clicking the actions icon () for the event and selecting View Automation Actions.
Clicking the actions icon () next to an event gives you the following options, based on your permissions:
- View Event. Navigates to the Event Investigator page for that event.
- Edit Event Note. Lets you update the Note associated with this event.
- Create Ticket. Opens a new ticket in the Skylar One Ticket Editor, if you are using Skylar One for your ticketing.
- Edit Ticket. Opens an existing ticket in the Skylar One Ticket Editor, if you are using Skylar One for your ticketing.
- Create External Ticket. Creates a new ticket for the event if you are using an external ticketing system instead of Skylar One.
- View Event Policy. Opens the Event Policy Editor page for the policy aligned with this event.
- View Device Thresholds. Opens the Device Thresholds page for the device on which the event occurred.
- Suppress Event for this Device. Suppresses the current event on the current device. When you suppress an event, you are specifying that, if this event occurs again in the future on the same device, the event does not appear again in the Events page or the tab for the device.
- View Automation Actions. Displays a log of automations that have occurred for that event. This option is hidden if the event does not have any automation actions aligned to it.
Event Throttling
When Skylar One detects syslog messages or traps coming from a single device at a rate greater than 25 messages per second, Skylar One throttles the messages.
When Skylar One throttles messages from a single IP address, those messages are deleted from the ScienceLogic database. The messages are not passed to the event engine, are not logged, and are not processed as events.
When Skylar One throttles messages, Skylar One also triggers events:
- Event with a Severity of Critical and the message "Inbound Message Flood". This event is triggered when a single IP exceeds the threshold of syslog messages or trap messages at least once per minute for the last 10 minutes. The default threshold is 25 messages per second.
- Event with a Severity of Notice and the message "Inbound Message Spikes". This event is triggered when a single IP exceeds the threshold of syslog messages or trap messages. The default threshold is 25 messages per second.
Message throttling is enabled by default. To disable message throttling, contact ScienceLogic Customer Support.
To adjust the threshold for message throttling, contact ScienceLogic Customer Support.
To whitelist an IP address so that message throttling does not apply to that IP, contact ScienceLogic Customer Support.
Skylar One does not support message throttling on IPv6 devices monitored by CentOS5 Data Collectors.
Viewing Events from the Event Console
To view a list of all active events on the Event Console page, go to Events > Classic Events, or the Events tab in the classic user interface.
To view the Event Console page, non-administrator user accounts must be granted one or more access keys that include the following access hook: Events/Event:View. Non-administrator user accounts can then view events that have the same organization as the user. For more information on Access Keys, see the section on Access Keys.
Each event is color-coded to make it easy for you to determine severity. For more information about severity values, see the section Understanding Event Severity.
Events in the Event Console are rolled up. This means that if the same event occurs multiple times on a single device, you see only one entry in the Event Console, and the value in the Count column indicates the number of times the event has occurred.
On the Event Console page, you can use the following tools for searching and filtering the list of events that displays in the page:
- The Global Search drop-down list and field, which can filter the entire list of events by one of the columns or by device group ID or device group name. You can save the results of a Global Search as a Custom View.
- The filter-while-you-type fields, which can filter the list of events by one or more of the event parameters.
- The Advanced Filter Tool, where you can enter more complex filters, based on your current Skylar One configuration.
The settings in the Account Preferences page (Preferences > Account > Preferences) and in the Event Console Preferences page (Events > Actions > Console Preferences) affect the scope of the filter-while-you-type fields and the Advanced Filter Tool. If you select the Group by Organization checkbox in the Account Preferences page or the Event Console Preferences page, events in the Event Console are grouped by organization. The filter-while-you-type fields and the advanced filter tool appear for each organization grouping and act only on the events in that organization grouping. You cannot apply a single filter to events in multiple organizations. For more details on the Account Preferences page and the Event Console Preferences page, see the section on Customizing the Display in the Event Console.
The Event Console displays a legend, showing the number of events of each severity.
- If you select the Group by Organization checkbox in the Account Preferences page (Preferences > Account > Preferences) or in the Event Console Preferences page (Events > Actions > Console Preferences), the Event Console displays the legend for each organization.
- If you do not select the Group by Organization checkbox, the Event Console displays the legend for all events in all organizations (that you are allowed to view).
- For each severity, the legend indicates the number of events displayed on the current page. The second number, in parentheses, indicates the additional number of events with the same severity that are not displayed in the current page. These additional events either display on a subsequent page or do not display because of the current filters applied to the page or because of the setting in the Default Severity Filter field in the Account Preferences page (Preferences > Account > Preferences) and in the Event Console Preferences page. For example, "3 (+7) Healthy" means that the current page displays three events with a severity of "Healthy" and that seven more events with a severity of "Healthy" exist but are not displayed in the current page.
Events That Are Not Displayed in the Event Console
In Skylar One, there are four types of events that might not appear on the Events page (or the Event Console page):
- Rolled-up events
- Suppressed events
- Topology events
- Event masks
For more information about these event types, see the section on Event Correlation.
Information about Each Event Displayed in the Event Console
For each event, the Event Console can display the following information:
To sort the list, click on a column heading. The list will be sorted by the column value, in ascending order. To sort the list in descending order, click the column heading again. You can also filter the items on this inventory page by typing filter text or selecting filter options in one or more of the filters found above the columns on the page. For more information, see Filtering the Items on a Classic Page in the Introduction to Skylar One manual.
- Organization. Specifies the organization that the event is associated with. If you want to group all events based on their organizations, select the Organizational Grouping Events checkbox in the Account Preferences page (Preferences > Account > Preferences) or the Group by Organization checkbox in the Event Console Preferences page (Events > Actions > Console Preferences).
- Contact Information. If you have grouped events by organization, this column displays the contact information for each organization.
- Severity Counts. If you have grouped the events by organization, this column displays the number of events for each severity that are associated with the organization.
- Report Icon. Icon that leads you to more information about the element or policy associated with the event.
- Name. Name of the entity associated with the event.
- Type. Type of entity associated with the event. The possible options are:
- Aggregate Services
- Assets
- Business Services
- Device Services
- Devices
- Interfaces
- IP networks
- IT Services
- Organizations
- User Accounts
- Vendors
- Virtual Interfaces
- Event Message. Message generated for the event.
- Severity. Severity of the event. For more information about severity values, see the section Understanding Event Severity.
- Acknowledged. If the event has been acknowledged, this column displays a red check-mark character and specifies the user who acknowledged the event. If the event has not been acknowledged, this field displays a gray check-mark character. To acknowledge an event, click in this column.
- Note. User-defined note to accompany the event. To create or edit a note, select the wrench icon (
 ) in this column. The Add a Note modal page appears, where you can create or edit a note and save your changes.
 - Ticket. If a ticket has been created for the event, this column displays the ticket ID of that ticket.
- External Ticket. The numeric ID associated with a ticket from an external ticketing system (that is, a ticket that was not created in Skylar One). If this field displays a value, you can click on that value to open a new window and view the external ticket.
- Age/Elapsed . Number of days, hours, and minutes since the first occurrence of the event. This is also the time since the event occurred without the event having been cleared.
- Last Detected. Date and time the event last occurred on this entity.
- EID. Unique ID for the event, generated by Skylar One.
To link an external ticket to an event, you must create a custom run book automation policy and a custom run book action or use the ScienceLogic APIs. For help with these tasks, contact ScienceLogic Customer Support.
- Source. System or application that generated this event. For more information, see the section on Event Sources.
- Count. Number of times this event has occurred or number of child events associated with the event or number of masked events associated with the event.
- Notify. Number of times the event has triggered the execution of an Automation Policy.
- Information icon (
 ). Displays the Event Information page, where you can view an overview of the selected event, suppress the selected event, or edit the definition of the selected event.
 - View Notifications icon (
 ). Leads to the Event Actions Log, where you can view details about each automation policy that has triggered for the event.
 - Ticket icon (
 ). Depending upon the setting Ticket Life Ring Button Behavior (found in System > Settings > Behavior), one of the following happens:
- The Ticket Editor page appears. If a ScienceLogic ticket is already aligned with this event, you can view details about the ticket. If a ScienceLogic ticket is not yet aligned with this event, you can define a ticket, and the Skylar One system automatically associates the new ticket with the selected event.
- If an external ticket is aligned with an event, when you select the life-ring icon () for that event (from the Event Console), Skylar One opens a new window and displays the external ticket (as specified in the force_ticket_uri field). If an external ticket is not yet aligned with an event, when you select the life-ring icon () for that event, Skylar One sets a "request" flag for the ticket and displays an acknowledgment that a new ticket has been requested. You can then use the "request" in run book logic to create the ticket on the external system.
Global Search Field
You can use the Global Search field in the upper left of the page to filter the entire list of displayed events by a single parameter. Skylar One updates the Event Console and displays only events that have a matching parameter.
To use the Global Search field, enter values in the Search drop-down list and the Text field:
- Search. You can select one of the following search parameters:
- Organization. Appears only if you have not selected the Group by Organization checkbox in the Account Preferences page (Preferences > Account > Preferences) or in the Event Console Preferences page (Events > Actions > Console Preferences). Name of the organization associated with the event.
- Name. Name of the entity associated with the event.
- Type. Type of entity associated with the event.
- Event Message. Message generated for the event.
- Severity. Severity of the event. For more information about severity values, see the section Understanding Event Severity.
- Acknowledged. If the event has been acknowledged, search for the user who acknowledged the event.
- Note. User-defined note associated with the event.
- Ticket. If a ticket has been created for the event, this parameter searches by the ticket ID of that ticket.
- External Ticket. The numeric ID associated with a ticket from an external ticketing system (that is, a ticket that was not created in Skylar One).
- Age/Elapsed. You can enter time in seconds, and the Event Console page displays only events that last occurred within that number of seconds or less.
- Event ID. Unique ID for the event, generated by Skylar One.
- Source. System or application that generated this event. For more information, see the section on Event Sources.
- Count. Number of times this event has occurred.
- Notify. Number of times the event has triggered the execution of an Automation Policy.
- Device Group ID. Unique ID for the device group associated with the event.
- Device Group Name. Name of the device group associated with the event.
- Text. For each search parameter, you must enter text to match. Skylar One searches for events that match the text, including partial matches. Text matches are not case-sensitive. You can use special characters in each filter.
To perform another search on the results of the previous search:
- Click the plus-sign (+) to the left of the Refresh Timer.
- This adds another Search field and Text field to the top of the page. This second search searches only the results from the first search.
- You can add as many Search and Text fields as you need.
You can save the results of a Global Search as a custom view.
Advanced Filter
On the Event Console page, you can specify one or more parameters to filter the list of events. Only events that meet all the filter criteria are displayed.
In some fields, you can use the Advanced Filter Tool to make selections instead of manually typing in a string to use as a filter.
The settings in the Account Preferences page (Preferences > Account > Preferences) and in the Event Console Preferences page (Events > Actions > Console Preferences) affect the scope of the Advanced Filter Tool. If you select the Group by Organization checkbox in the Account Preferences page or the Event Console Preferences page:
- Events on the Event Console page are grouped by organization.
- The Advanced Filter Tool appears for each organization grouping and acts only on the events in that organization grouping. You cannot apply a single advanced filter to events in multiple organizations.
- You cannot filter by organization using the Advanced Filter Tool.
- The possible filter options are pre-filtered by each organization.
To select multiple entries in the Advanced Filter Tool, hold down the Ctrl key and left-click the entries.
To reset each field to empty and apply no filters, click the button.
For each filter except Severity and Last Detected, you must enter text to match against. Skylar One searches for events that match the text, including partial matches. For the Type and Source filters, you can enter text to match against or you can select from the list of possible values. Text matches are not case-sensitive. You can use special characters in each filter.
To access the Advanced Filter Tool:
-
Go to the Event Console page (Events > Classic Events, or the Events tab in the classic user interface).
-
Click on the funnel icon (
 ).
). -
The Advanced Filter Tool displays advanced filters for each column in your default display. To change the columns that are displayed on the Event Console page, see the section Customizing the Display in the Event Console.
Unlike the "filter while you type" feature, the Advanced Filter Tool is not applied to the list of events until you select the button.
- In the Advanced Filter Tool, filter by one or more of the available filters.
- Click to apply the advanced filters. Click to clear the advanced filters and start again.
- Click for the Event Console page to return to the default list of events.
You can perform an advanced filter and then perform a second advanced filter on the results of the first advanced filter. You can perform an advanced filter multiple times, to perform multiple filters.
Custom View
You can save a filtered list of events created with the Global Search tool. When you do so, you create a custom view. You can then return to the page at any time and display the custom view, without having to filter the list again.
To save a custom view:
- Go to the Event Console page (Events > Classic Events, or the Events tab in the classic user interface).
- Using the Global Search tool, filter the list of events.
- In the Custom View drop-down field, select new custom view.
- Click the button.
- Skylar One prompts you to enter a name for the new custom view.
- The new custom view now appears in the Custom View drop-down list.
- To edit the custom view, select it from the Custom View drop-down list, make changes with the Global Search tool, and then click the button for the custom view to save your changes.
- To display the custom view, select it from the Custom View drop-down list.
- To delete the custom view, select it from the Custom View drop-down field and then click the button. The custom view no longer appears in the Custom View drop-down list.
Viewing Events for a Single Device in the Classic Skylar One User Interface
To view a list of events for a single device in the classic user interface, you can go to the Viewing Active Events page in the Device Reports panel.
To view the Viewing Active Events page, non-administrator user accounts must be granted one or more access keys that include all the following access hooks: Registry, Registry>Devices>Device Manager, Dev:Events Summary, Dev:View Summary, and Event:View (From Dev Properties). For more information on Access Keys, see the section on Access Keys.
To view a list of events for a single device:
- Go to the Device Manager page (Devices > Classic Devices, or Registry > Devices > Device Manager in the classic user interface).
- Find the device that you want to view events for and select its bar graph icon (
 ).
). - In the Device Reports panel, select the tab.
- The Viewing Active Events page appears.
This page displays all of the currently active events for the device. For each event, the page displays:
- Event Message | Severity. Message generated by event, as defined in the Event Policy Editor page (Registry > Events > Event Manager > create or edit). The message is color-coded for severity. For more information about severity values, see the section Understanding Event Severity.
- Acknowledged. Specifies whether a ScienceLogic user has acknowledged this event.
- Age/Elapsed. Number of days, hours, and minutes since the first occurrence of the event.
- Ticket. Ticket ID associated with this event, if applicable.
- Last Detected. Date and time of last occurrence of the event.
- EID. Unique ID for the event, generated by Skylar One.
- Source. Source of the log message that triggers the event, as defined in the Event Policy Editor page (Registry > Events > Event Manager > create or edit). For more information, see the section on Event Sources.
- Count. Number of times this event has occurred.
- View Notifications icon (). Leads to the Event Actions Log, where you can view details about each automation policy that has triggered for the event.
- Statistics icon (
 ). Displays the Event Statistics page, where you can view historical statistics for the selected event.
 - Information icon (). Displays the Event Information page, where you can view an overview of the selected event, suppress the selected event, or edit the definition of the selected event.
To view a list of all cleared events for the device, select the button. To return to the list of active events, select the button.
Viewing Events for a Single Organization
One of the easiest ways to monitor the health of your network is to look at events. Events are messages that are triggered when a specific condition is met. For example, an event can signal that a server has gone down, that a device's hard drives are getting too full, or simply display the status of a device.
Each instance of an event in Skylar One is associated with an organization. Each occurrence of an event is grouped by organization (the organization associated with the device where the event occurred or the organization associated with the policy that generated the event).
In the Organizational Administration panel, you can view a list of events associated with a specific organization.
To view a list of events associated with a specific organization:
- Go to the Organizational Account Administration page (Registry > Accounts > Organizations).
- In the Organizational Account Administration page, find the organization with associated events that you want to view.
- If a value appears in the Events column, click the event icon (
 ).
). - The Organizational Events page appears for the organization.
This page displays a list of all active events associated with the organization or the organization's elements. For each event, the page displays:
- Name. Name of the element associated with the event.
- Event Message | Severity. Message generated by event, as defined in the Event Policy Editor page (Registry > Events > Event Manager > create or edit). The message is color-coded for severity.
- Acknowledged. Specifies whether a ScienceLogic user has acknowledged this event.
- Age/Elapsed. Number of days, hours, and minutes since the first occurrence of the event.
- Ticket. Ticket ID associated with this event, if applicable.
- Last Detected. Date and time of last occurrence of the event.
- EID. Unique ID for the event, generated by Skylar One.
- Source. Source of the log message that triggers the event, as defined in the Event Policy Editor page (Registry > Events > Event Manager > create or edit). For more information, see the section on Event Sources.
- Count. Number of times this event has occurred.
- View Notifications icon (). Leads to the Event Actions Log, where you can view details about each automation policy that has triggered for the event.
- Statistics icon (). Displays the Event Statistics page, where you can view historical statistics for the selected event.
- Information icon (). Displays the Event Information page, where you can view an overview of the selected event, suppress the selected event, or edit the definition of the selected event.
To view a list of all cleared events for the organization, click the menu and select View Cleared Events. To return to the list of active events, click the menu and select View Active Events.
Viewing Event Details in the Event Console
In the classic Skylar One user interface, you can view details about an event, suppress an event, and access the event policy from the Event Information page.
To view the Event Information page, non-administrator user accounts must be granted one or more access keys that include the following access hook: Events/Event:View. Non-administrator user accounts can then view details for all events in the same organization as the user.
To access the Event Information page:
-
Go to the Event Console page (Events > Classic Events, or the Events tab in the classic user interface).
-
Find the event you are interested in and select its information icon (
). The Event Information page appears:
The Event Information page displays the following details about the event:
- Event ID. Unique ID for the event, generated by Skylar One.
- Event Message. Message generated by the event, as defined in the Event Policy Editor page (Registry > Events > Event Manager > create or edit).
- Severity. Severity of the event. For more information about severity values, see the section Understanding Event Severity.
- For Element. Name of the element associated with the event.
- First Occurrence. Number of days and hours since the first occurrence of the event, and date and time of first occurrence of the event.
- Last Occurrence. Number of days and hours since the last occurrence of the event, and date and time of last occurrence of the event.
- Occurrence Count. Number of times this event has occurred on this entity.
- Acknowledged On. Date and time the event was acknowledged.
- Acknowledged By. Username of user who acknowledged the event.
- Policy Name/ID. Name of the event policy, as defined in the Event Policy Editor page (Registry > Events > Event Manager > create or edit) and policy ID.
- Policy Type. Source of the log message that triggers the event, as defined in the Event Policy Editor page (Registry > Events > Event Manager > create or edit). For more information, see the section on Event Sources.
- Ticket Description. Description field from the associated ticket, if applicable.
- Probable Cause & Resolution Text. This pane displays additional information about the event, as defined in the Event Policy Editorpage (Registry > Events > Event Manager > create or edit).
- Correlation Reason. This field displays the user-defined notes about event categories and event correlation. You can enter up to 256 characters in this field. To save your changes, select the button.
- Note. This field displays the user-defined note associated with the event. To add or edit a note, enter text in this field and then select the [Save Note] button.
Depending on your Access Keys, the menu displays one or more of the following entries:
- Create a Ticket. Leads to the Ticket Editor page, where you can define a new ticket based on the event.
- Edit Aligned Ticket. Leads to the Ticket Editor page, where you can edit an existing ticket that is based on the event.
- Edit Aligned Event Policy. Leads to the Event Policy Editor page (Registry > Events > Event Manager > create or edit), where you can edit the properties of the event definition.
- Edit Device Thresholds. Leads to the Device Thresholds page, where you can define and edit storage and performance thresholds for a device.
- Suppress Event for This Device. Suppresses the current event on the current device. When you suppress an event, you are specifying that in the future, if this event occurs again on the same device, the event does not appear in the Event Console or the Viewing Events page.
- Refresh This Page. Updates the page with the latest information.
- View Device Summary. Leads to the Device Summary page for the device, where you can view overview information on the health of the device, a list of events and tickets associated with the device, a list of elements associated with the device, a list of monitoring policies for the device, and hardware and bandwidth usage for the device.
Customizing the Display in the Event Console
You can customize the appearance of the Event Console page in the classic Skylar One user interface from two places:
- The Account Preferences page. In this page, you can select the columns that display on the Event Console page.
- The menu in the Event Console page. When you select the Console Preferences entry, Skylar One displays the Preferences modal page, where you can define the appearance and behavior of the Event Console page.
Account Preferences
On the Account Preferences page, you can change your password and customize some of the behavior and appearance of Skylar One. The customizations that you choose appear each time you log in to Skylar One. They do not affect how Skylar One appears to other users.
In the Account Preferences page, you can customize how the Event Console page appears.
To access the Account Preferences page, non-administrator user accounts must be granted one or more access keys that include the following access hook: MyPreferences. Non-administrator user accounts can then view and edit the settings in the Account Preferences page. For more information on Access Keys, see the section on Access Keys.
To access the Account Preferences page:
-
Go to the Account Preferences page (Preferences > Account > Preferences).
-
In the Account Preferences page, you can edit one or more of the fields described below.
-
You can use the Change Password pane to change your password. Passwords must be between seven and 64 characters in length. The following fields appear:
- Existing Password. Type your current password.
- New PasswordNew Password. Type your new password.
- Confirm PasswordConfirm Password. Retype your new password.
- . Select this button to save changes in the Change Password pane.
- You can define the appearance and behavior of some pages in Skylar One from the Interface Settings pane, which contains the following fields:
- Default Page. Select the page that automatically appears by default when you log in to Skylar One. Options include:
- None. Skylar One displays the ScienceLogic logo when you log in.
- Event Console. Skylar One displays the Event Console when you log in.
- Ticket Console. Skylar One displays the Ticket Console when you log in.
- Device Views. Skylar One displays the Device Group Map page (Classic Maps > Device Maps > Device Groups) when you log in.
- Dashboard. Skylar One displays the selected Dashboard when you log in.
- Theme. Select the backgrounds, colors, and graphics that appear when you log in. Theme entries are defined on the Themes page (Settings > Themes).
- Page Refresh Rate. Select how often the Events, Tickets, and Views pages in Skylar One are refreshed. Options range from 10 seconds to 60 minutes.
- Page Result Count. Select the number of results you want to display on each page that contains lists of entities. Options range from 25 to 500.
- Table Row Height. Affects the row height of all pages that display a table in the main content pane. You can also change this setting in the Event Console Preferences page, the Ticket Console Preferences page, and the user Account Preferences page. Changing the setting for row height in the current page, the Event Console Preferences page, the Ticket Console Preferences page, or the user Account Preferences page affects the row height in all pages that display a table in the main content pane. Choices are:
- Small. Sets row height to 17 px and font size to 11 px.
- Medium. Sets row height to 27 px and font size to 12 px.
- Large. Sets row height to 35 px and font size to 13 px.
- Default Severity Filter. Select the minimum event severity that you want to display in the Event Console page. Only events of the selected severity and greater appear in the page. Options include:
- Healthy. Displays all events, including events with a severity of Healthy.
- Notice. Displays all events with a severity of Notice, Minor, Major, and Critical.
- Minor. Displays all events with a severity of Minor, Major, and Critical.
- Major. Displays all events with a severity of Major and Critical.
- Critical. Displays all events with a severity of Critical.
- Preferred IF Label. Select how interfaces will be labeled in all pages and reports that reference network interfaces. Options include:
- Interface Alias. Easy-to-remember, human-readable name for the network interface.
- Interface Name. The name of the network interface.
- Default Interface Graph Display. Select the default unit of measure for the Hourly Interface Usage graph in the Device Summary page. Options include:
- Interface Default. The Hourly Interface Usage graph displays the amount of traffic in the unit of measure specified in the Measurement field in the Interface Properties page for the interface.
- % Utilization. The Hourly Interface Usage graph displays utilization in percent.
- Default Date Format. Select the default date format for use throughout Skylar One.
- Date Format String. Select the date format for use throughout Skylar One. If defined, this date format overrides the default date format. You can use any date variables supported by the PHP date function in this field.
- Use the Checkboxes pane to configure features that are toggled on or off:
- Disable NavBar Auto-hide. If you select this checkbox, the NavBar pane persists after you select a link. This option is selected by default.
- View Assigned Tickets Only. If you select this checkbox, by default, only tickets assigned to you are displayed in the Ticket Console page.
- Show Masked Events.
If you select this checkbox, all events that have been grouped together with a device's Event Mask setting are displayed in the Event Console page. If you do not select this checkbox, these events are grouped together and rolled-up under the event with the highest severity, and you can click on the magnifying-glass icon (
 ) to view the masked events.
 - Organizational Grouping Events. If you select this checkbox, events are grouped by organization. The filter-while-you-type fields and the Advanced Filter Tool appear for each organization grouping and act only on the events in that organization grouping. You cannot apply a single filter to events in multiple organizations.
- Collapse Organization Events. If you select this checkbox, all organizations with assigned events are displayed but contracted; the Event Console page displays only a list of contracted organizations, which you can expand by clicking the plus sign (+). The default behavior of Skylar One is to expand each organization and display the list of events for each organization.
- Show Severity Badges. If you select this checkbox:
- The value in the Severity column is displayed as a color-coded badge on the Event Console page and the Ticket Console page.
- The value in the Current State column is displayed as a color-coded badge on the Device Manager page.
If you do not select the Show Severity Badges checkbox:
- On the Event Console page, the value in the Event Message column and the value in the Severity column are painted with the severity color.
- On the Ticket Console page, the value in the Description column and the Severity column are painted with the severity color.
- On the Device Manager page, the value in the Device Name column and the value in the Current State column are painted with the severity color.
- Ticket Comment Reverse Sort. If you select this checkbox, the Notes section of a ticket sorts the ticket's notes from newest to oldest. If you do not select this checkbox, ticket notes display from oldest to newest.
- Disabled Ticket Comment Cloaking. If you select this checkbox, then any comments you add to a ticket are viewable to all other users (i.e., not cloaked) by default.
- Scale Percent Graphs to 100%. If you select this checkbox, then any graphs that display percentage on the y-axis display from 0% to 100%, regardless of the highest actual value. If you do not select this checkbox, then the y-axis displays from 0% to the highest actual value.
- Code Highlighting. If you select this checkbox, HTML, PHP, Python, and SQL code that displays in Skylar One is highlighted. You can customize the highlight colors in the Code Highlighting page. If selected, syntax highlighting appears in:
- The Snippet Editor & Registry page for snippet Dynamic Applications (System > Manage > Applications > create/edit > Snippets)
- The Dashboard Widget Editor page (System > Customize > Dashboards > Widgets > create/edit)
- The Database Tool page (System > Tools > DB Tool)
- The Action Policy Editor page for "Snippet" and "SQL Query" type actions (Registry > Run Book > Actions > create/edit)
- The Report Template Editor page (Reports > Management > Report Manager > create/edit)
The Database Tool page is available only in versions of Skylar One prior to 12.2.1 and displays only for users that have sufficient permissions to access the page.
- Hide Empty Networks. If you select this checkbox, the IPv4 Networks page hides networks that do not include any devices or interfaces.
-
In the Event Console Columns pane, select the columns that you want to display by default in the Event Console page.
You can also edit the list of columns to display in the Event Console page from the Event Console Preferences modal page. When you edit the list of columns in the Event Console Preferences modal page, the selected list of columns automatically updates in the Account Preferences page, and vice versa.
-
In the Ticket Console Columns pane, select the columns that you want to display by default in the Ticket Console page.
You can also edit the list of columns to display in the Ticket Console page from the Ticket Console Preferences modal page. When you edit the list of columns in the Ticket Console Preferences modal page, the selected list of columns automatically updates in the Account Preferences page, and vice versa.
-
In the Device Manager Columns pane, select the columns that you want to display by default in the Device Manager page.
You can also edit the list of columns to display in the Device Manager page from the Device Manager Preferences modal page. When you edit the list of columns in the Device Manager Preferences modal page, the selected list of columns automatically updates in the Account Preferences page, and vice versa.
-
Select the button to save your changes.
Event Console Preferences
On the Event Console Preferences page, you can customize the display and behavior of the Event Console page.
To access the Event Console Preferences page, non-administrator user accounts must be granted one or more access keys that include the following access hook: Events/Event:View. Non-administrator user accounts can then view and edit settings in the Event Console Preferences page. For more information on Access Keys, see the section on Access Keys.
To access the Event Console Preferences page:
- Go to the tab.
- In the Event Console page, click the menu and select Console Preferences.
- The Event Console Preferences page appears.
- In the Event Console Preferences page, you can customize the following:
- Console Refresh Rate. Select how often the Event Console page is refreshed. Options range from 10 seconds to 60 minutes.
- Default Severity Filter. Select the minimum event severity that you want to display in the Event Console page. Only events of the selected severity and greater appear in the page. Options include:
- Healthy. Displays all events, including events with a severity of Healthy.
- Notice. Displays all events with a severity of Notice, Minor, Major, and Critical.
- Minor. Displays all events with a severity of Minor, Major, and Critical.
- Major. Displays all events with a severity of Major and Critical.
- Critical. Displays all events with a severity of Critical.
- Table Row Height. Affects the row height of all pages that display a table in the main content pane. You can also change this setting in the Event Console Preferences page, the Ticket Console Preferences page, and the user Account Preferences page. Changing the setting for row height in the current page, the Event Console Preferences page, the Ticket Console Preferences page, or the user Account Preferences page affects the row height in all pages that display a table in the main content pane. Choices are:
- Small. Sets row height to 17 px and font size to 11 px.
- Medium. Sets row height to 27 px and font size to 12 px.
- Large. Sets row height to 35 px and font size to 13 px.
- Group by Organization. If you select this checkbox, events are grouped by organization. The filter-while-you-type fields and the Advanced Filter Tool appear for each organization grouping and act only on the events in that organization grouping. You cannot apply a single filter to events in multiple organizations.
- Show Masked Events.
If you select this checkbox, all events that have been grouped together with a device's Event Mask setting are displayed in the Event Console page. If you do not select this checkbox, these events are grouped together and rolled-up under the event with the highest severity, and you can click on the magnifying-glass icon (
) to view the masked events.
- Show Severity Badges. If you select this checkbox:
- The value in the Severity column is displayed as a color-coded badge on the Event Console page and the Ticket Console page.
- The value in the Current State column is displayed as a color-coded badge on the Device Manager page.
If you do not select the Show Severity Badges checkbox:
- On the Event Console page, the value in the Event Message column and the value in the Severity column are painted with the severity color.
- On the Ticket Console page, the value in the Description column and the Severity column are painted with the severity color.
- On the Device Manager page, the value in the Device Name column and the value in the Current State column are painted with the severity color.
- Collapse All Organizations. If you select this checkbox, all organizations with assigned events are displayed but contracted; the Event Console page displays only a list of contracted organizations, which you can expand by clicking the plus sign (+). The default behavior of Skylar One is to expand each organization and display the list of events for each organization.
- Event Console Columns. In this list, select the columns that you want to display by default in the Event Console page.
You can also edit the list of columns to display in the Event Console page from the Account Preferences page. When you edit the list of columns in the Account Preferences page, the selected list of columns automatically updates in the Event Console Preferencesmodal page, and vice versa.
- Click to save your changes.
Hiding the Header Bar
You can also customize the display of the Event Console by hiding the header bar. To hide the header bar, click on the arrow in the top right of the Event Console.
Event Masks in the Event Console
In the Device Properties page for each device, you can define an Event Mask.
For more information on the Device Properties page, see the section on Device Administration.
When a device uses the Event Mask setting, events that occur on a single device within a specified span of time are grouped together. This allows related events that occur in quick succession on a single device to be rolled up and posted together under one event description.
- By default, when events are masked, the Event Console displays all events that occur on the device within the specified timespan under a single event, the one with the highest severity. The magnifying-glass icon () appears to the left of the event. When you click on the magnifying-glass icon, the Suppression Group modal page appears. This page includes details about all events that are masked under the displayed event.
- If an event has Occurrence Count and Occurrence Time set in its Event Policy Editor page, Skylar One uses the very first logged occurrence of the event to calculate the Event Mask, even if that first occurrence did not appear in the Event Console (due to the Occurrence Count and Occurrence Time fields).
- For example, suppose an event, event_x, has an Occurrence Count of "3" and an Occurrence Time of "10 minutes." This means that the event must occur on the same device at least three times within 10 minutes before the event appears in the Event Console. Suppose the event, event_x, occurs on device_A at 15:51, 15:52, and 15:53. The event appears in the Event Console with a time stamp of "15:53," an age of "2 minutes," and a count of "3."
- Suppose device_A includes an Event Mask of "Group in blocks every 5 minutes." To calculate how to group event_x, the Event Mask uses the time stamp of the first occurrence, 15:51, even though the event did not appear in the Event Console at that time. The Event Mask also uses the time of the first occurrence, 15:51, to calculate the "Age/Elapsed" value for the event in the Suppression Group modal page.
- If you want masked events to appear in the Event Console by default, go to the Event Console Preferences page (Events > Actions > Console Preferences), and enable the Show Masked Events field.