![]()
This
Use the following menu options to navigate the Skylar One user interface:
- To view a pop-out list of menu options, click the menu icon (
 ).
). - To view a page containing all of the menu options, click the Advanced menu icon (
 ).
).
Viewing the Service Investigator
The Sections on the Service Investigator Page
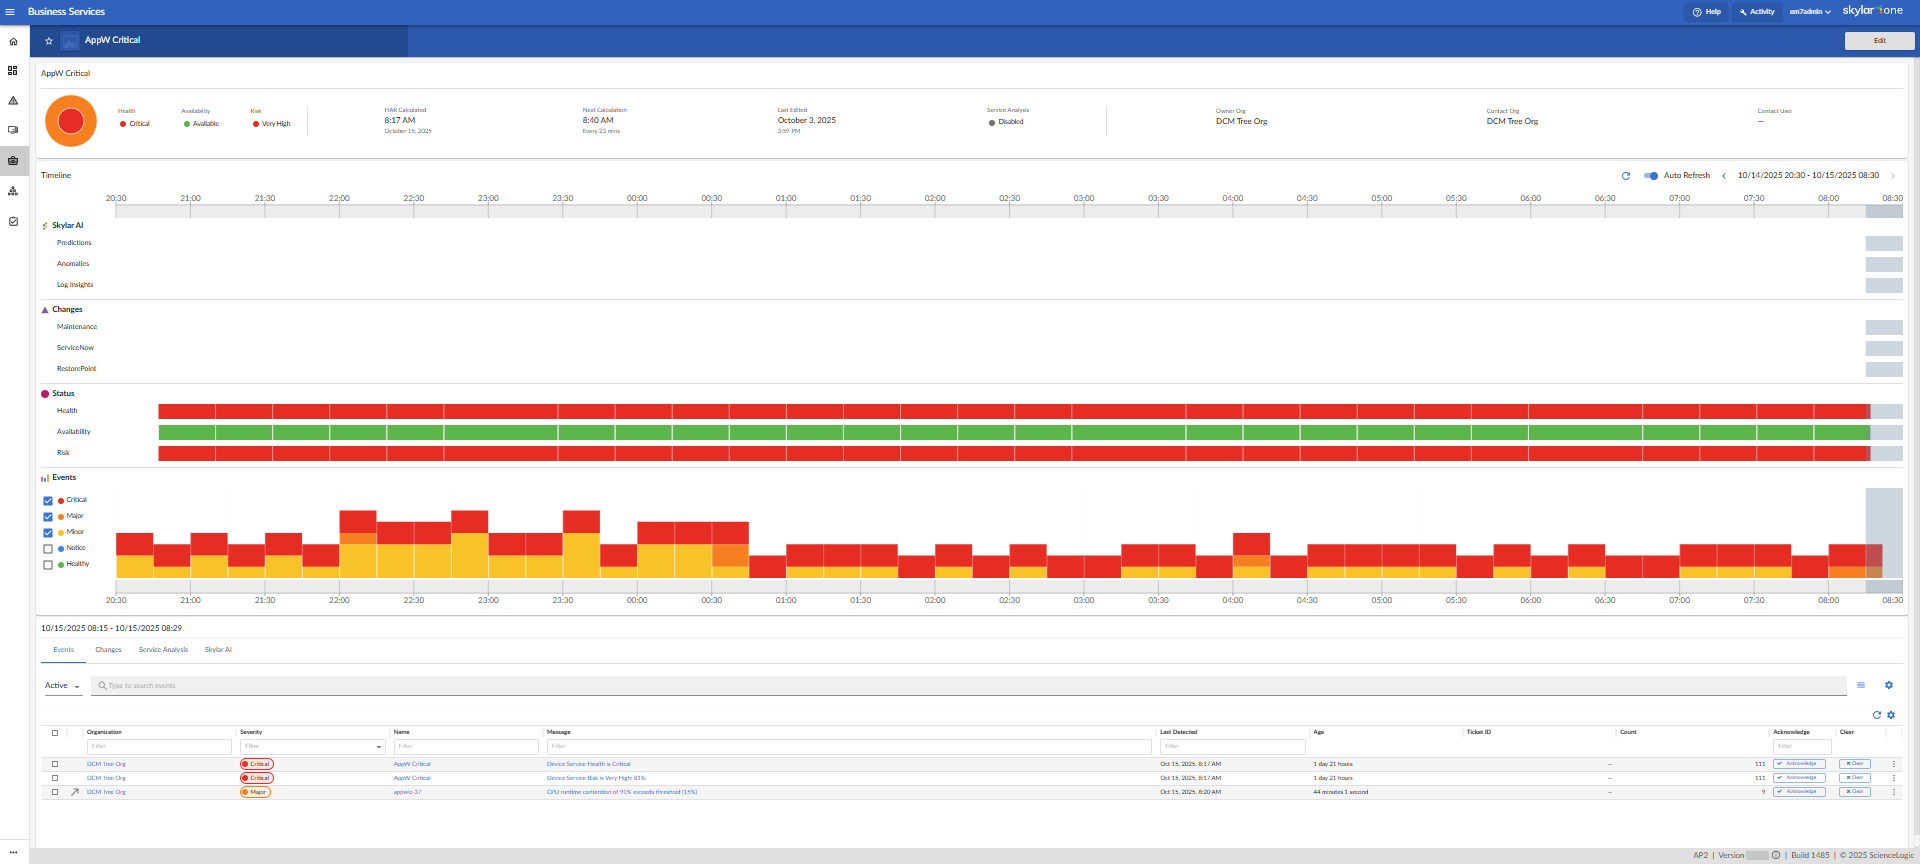
The Service Investigator page contains the following sections:
- Overview. A summary panel at the top of the page that displays organization and system information such as Contact Organization, Visible Organization, and Owner. This information bar also displays a preview of a sunburst chart, which you can click to see a more detailed breakdown of the Health, Availability, and Risk statuses of your devices.
- Timeline. A panel that displays swim lanes and bar graphs to show Historical, Change, Health, Availability, Risk, and Skylar Automated RCA events. Swim lanes are visual flowcharts that show a process from start to finish for an event.
- Events . An interactive pane that displays the Events, Changes, Service Analysis, and Skylar Advisor related to the service you have selected.
Each of these sections are described in the following sections.
The Overview Panel
The overview panel on the Service Investigator page displays the following information:
- The current Health, Availability, and Risk values for the service.
- HAR Calculated. The date and timestamp of the most recent system refresh.
- Next Calculation. The timestamp of the next system refresh and its frequency.
- Last Edited. The date and timestamp of the most recent change made to this service and the username of the last user to edit this service.
- Service Analysis. Indicates whether Service Analysis is enabled or disabled for the service.
- Owner Org. The organization that owns the service.
- Contact Org. The organization that should be contacted with any questions about the service.
- Contact User. The user who should be contacted with any questions about the service.
You can click the sunburst chart to see a more detailed breakdown of the Health, Availability, and Risk statuses of your services. Doing so will open a larger modal that provides different ways to view and filter the statuses of your devices on this particular service.
This diagram window consists of the following viewing options for your services:
Each of these viewing options is described in the following sections.
Sunburst View
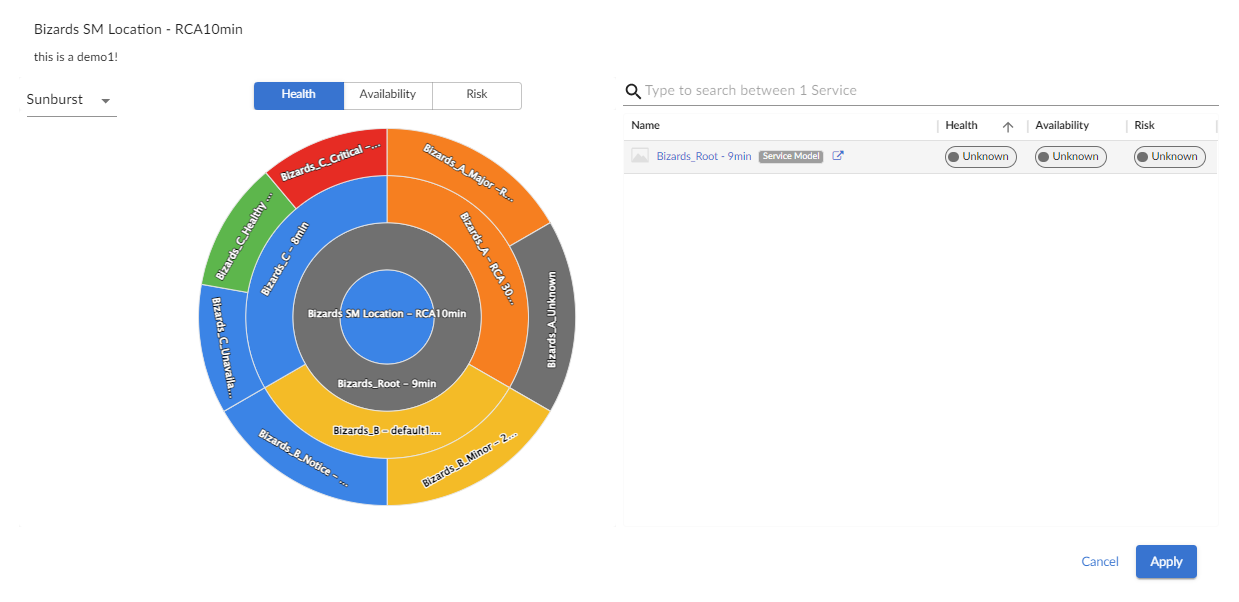
The overview summary panel displays either a Sunburst chart view or a Map view of your services. Use the drop-down menu in the top left corner of the window to select which view you want to use.
When you select the Sunburst view:
- The sunburst chart displays the current Health, Availability, and Risk values for the services, as well as for any constituent services or device services that belong to that top-level service. For device services, the sunburst chart includes the device name and health values for any devices that belong to the service. Additionally, this chart indicates the maximum number of constituent services or devices that will be used for computing health, availability, and risk.
- The right panel includes a list of constituent services or devices. Each service in this panel includes icons that represent that service's Health, Availability, and Risk metrics; devices include icons that represent each device's health value. The right panel also includes a search bar at the top of the panel that enables you to search for specific constituent services or devices.
In the sunburst chart view, the center circle represents the selected service. The selected service drives the context for the page title and Info drawer, as well as all the other panels and widgets in the Overview section. This means that the right panel and other elements on the page will all reflect the metrics for the service in the center circle of the sunburst.
You can navigate through services on the widget in the following ways:
- On the sunburst chart, you can click any constituent IT services or device services in the sunburst to select that service. To return to the parent IT service or business service, click the center circle or click the breadcrumb links that appear in the top-left corner of the window.
- In the right panel, you can click the service name of any of the constituent IT services or device services to select that service. To return to the parent IT service or business service, click the breadcrumb links that appear in the top-left corner of the window.
By default, the sunburst displays the health value for the selected service and its constituent services or devices. To view the current availability or risk value for the selected service, click either the or tab above the sunburst chart.
Map View
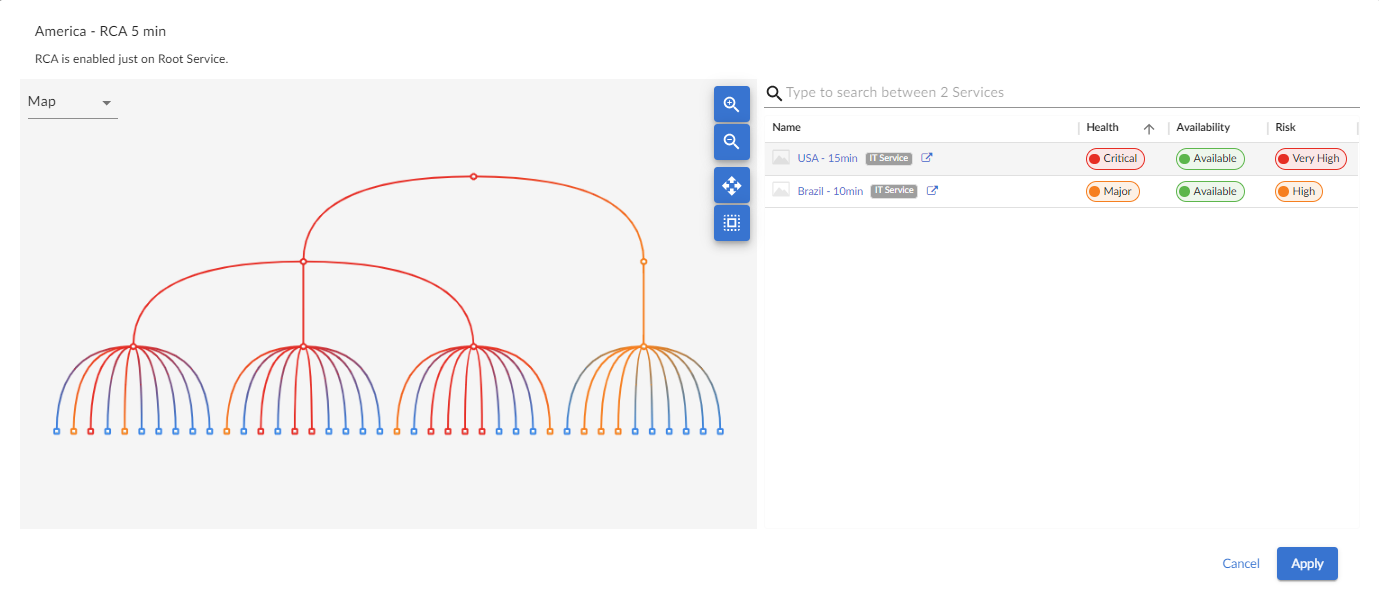
The overview summary panel displays either a Sunburst chart view or a Map view of your services. Use the drop-down menu in the top left corner of the window to select which view you want to use.
When you select the Map view:
- The map view displays a map of the service and any constituent services and devices that belong to that top-level service.
- The right panel includes a list of constituent services or devices. Each service in this panel includes icons that represent that service's Health, Availability, and Risk metrics; devices include icons that represent each device's health value. The right panel also includes a search bar at the top of the panel that enables you to search for specific constituent services or devices.
In the map view, you can click on the top-level service or any of its constituent services or devices. The selected service drives the context for the page title and Info drawer, as well as all the other panels and widgets on the overview summary pane. This means that the right panel, and other elements on the page will all reflect the metrics for the service that you have clicked in the map view.
In the map view, use the following buttons to manipulate the map in the left pane:
![]() : Zoom in on the map.
: Zoom in on the map.
![]() : Zoom out on the map.
: Zoom out on the map.
![]() : Fit all elements of a map into the viewing pane.
: Fit all elements of a map into the viewing pane.
![]() : Center all selected elements of a map in the viewing pane.
: Center all selected elements of a map in the viewing pane.
The viewing pane displays the following two types of graphical elements:
- Nodes that represent devices, topology elements, and business services defined in Skylar One. The shape of the node represents its type: Services, such as business services, IT services, or device services, are represented by hexagons, while devices are represented by squares. The color of the outline specifies the current state of the node.
- Edges are lines that represent the relationships and hierarchies between nodes.
When you hover over a node, a pop-up Properties pane appears with the metadata for that node. Click the or link at the top of the pane to open the Investigator page for that service or device in a new browser window.
The Timeline Panel
The Timeline panel displays an interactive graphic that combines swim lanes and bar graphs to visualize the health, availability, and risk of your events. Swim lanes act as visual flowcharts, showing the progression of an event from start to finish. You can select any time range on the timeline to view Changes, Health, Availability, and Risk details specific to your device or service for that period. Timeline data is presented in 12‑hour segments, allowing you to navigate backward and review up to seven days of historical activity.
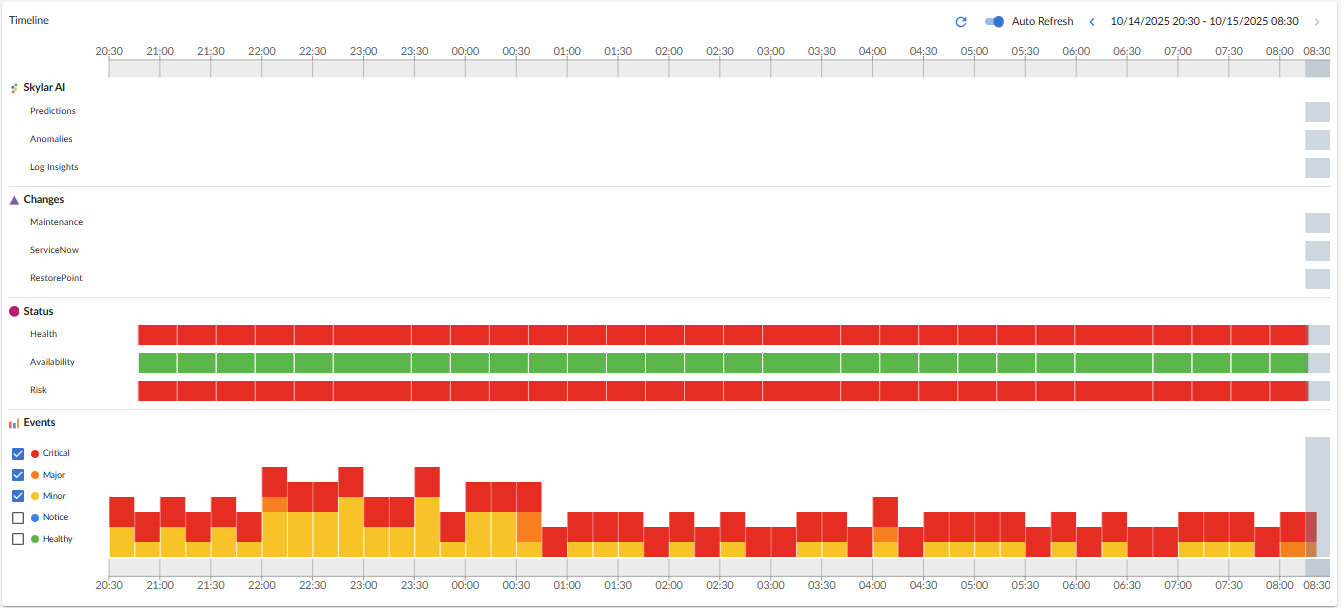
The Timeline panel consists of the following sections:
Starting in the AP2 Nougat release, the Skylar AI heading under the Timeline panel is renamed to Skylar Advisor.
Skylar Advisor Swim Lanes
You can view Skylar Automated RCA suggestions and alerts in the swim lanes of the Timeline panel on the Service Investigator page. To use this feature, you will need to set up the connection between Skylar Automated RCA and Skylar One. By default, suggestions and alerts cover the last 12 hours. For more information, see Configuring the Skylar Automated RCA Connector for Skylar One.
The section includes three swim lanes:
- Predictions, which shows predicted future events from start to finish.
- Anomalies, which shows events marked as anomalies from start to finish.
- Log Insights, which shows Skylar Automated RCA suggestions and alerts. The alerts are either "Confirmed" or "Suggested".
Confirmed Alerts
Confirmed alerts in the Log Insights swim lane of the section represent log events that Skylar Automated RCA has collected for your service or device. In Skylar Automated RCA, they appear as categorized events under Accepted/Custom. These logs typically contain metadata such as title, description, and so forth and use the Skylar AI to analyze and collect event logs that show abnormalities.
Suggested Alerts
Suggested alerts in the Log Insights swim lane of the section contain metadata such as title, description, and so forth; a root cause report, which is a set of correlated log lines that help to explain a problem; and a suggested alert rule consisting of one or two log event types that form the signature for this type of alert.
As logs are ingested, the Skylar AI analyzes your system or device logs for event patterns such as abnormally correlated rare and error events from across all log streams. When it detects one of these "abnormal" clusters, it will generate a suggested alert, which allows you to choose if you want these events to be recorded as event logs in the future.
You can choose to either accept or reject a suggested alert.
- If you accept a suggested alert, you can edit the metadata and alert rule. You can also decide on the action to take if the same kind of alert occurs again, such as sending a notification to Slack, email, or another communications platform.
- If you reject a suggested alert, the same kind of alert will not be recorded in the future and it will not offer you the options to either "accept" or "reject" it.
Changes Swim Lanes
The header on the Timeline panel is available to customers who have purchased Configuration and Change Management as part of their Skylar One Standard or Advanced subscription. This section displays a list of events that are created when PowerFlow pulls change data from ServiceNow or Restorepoint, including both active and cleared change events. By default, the events cover the last 12 hours.
This section contains the following swim lanes:
Starting in the AP2 Nougat release, the tab under the Changes heading of the Timeline panel is renamed to .
Maintenance
The Maintenance swim lane indicates whether a device is in maintenance mode. Devices in maintenance have start and end times, which are determined by a start event and an end event for each change data. The device's Collection State field will change from Active to Scheduled Maintenance, and then back to Active once maintenance reaches its end time.
You can see a device's collection state in the Collection State column on the Events page. To see a list of all devices in maintenance mode and their start times, end times, and duration, go to the Schedules tab of the Device Investigator page.
For more information, see
ServiceNow
The ServiceNow swim lane shows a visual representation of all Skylar One events that are synced with ServiceNow incidents in a specific time range.
You can permanently enable or disable ServiceNow swim lane diagrams on the Timeline panel through the nextui.conf file, or temporarily enable or disable them through GraphQL mutations. To do so, follow the instructions outlined in the Configuring and Enabling the Changes Tab section.
Skylar Compliance
Starting in the AP2 Nougat release, the tab under the Changes heading of the Timeline panel is renamed to .
The Skylar Compliance swim lane shows a visual representation of all Skylar One events on devices that are synced between Skylar One and Skylar Compliance. The events are created when PowerFlow pulls change data from Restorepoint.
You can permanently enable or disable Skylar Compliance swim lane diagrams on the Timeline panel through the nextui.conf file, or temporarily enable or disable them through GraphQL mutations. To do so, follow the instructions outlined in the Configuring and Enabling the Changes Tab section.
Status Swim Lanes
The section provides an overview of your service or device health, availability, and risk. Selecting a time range in the Timeline panel opens a pop‑over modal with Health, Availability, and Risk details for the selected device or service. By default, the status shows the health, availability, and risk statuses of events from the past 12 hours, which is the maximum supported time range.
Health
The Health swim lane displays device or service health over a period of time.
This swim lane indicates the current status of a device service—for example, the rate of processing or throughput for the devices in the service. In the case of Skylar One Database Servers, the "Rows Behind" value can provide a good measure of how effectively the Database Server is processing data from Data Collectors. Health is represented by a color-coded "severity" icon that corresponds to a numerical value between 0 and 100. For example, the Health value could indicate when a device is intermittently unavailable because of a power problem, thereby falling below the required level of performance. Health uses the following icons:
![]()
Availability
The Availability swim lane shows the availability status of your device or service over a period of time.
The availability of a device service is derived from the availability rules. This might or might not be linked to device availability. A service or device is considered unavailable if Skylar One is not able to collect data from the device or service, or if a device is usable or not usable. A value of 0 means a device or service is unavailable, and a value of 1 means a device is available. Availability uses the following icons:

Risk
The Risk swim lane displays the risk status of your device or service over a period of time.
This swim lane measures the risk status of your device or service using a percentage value between 0 and 100 that indicates how close a service is to being in an undesirable state. Use risk for data that is known to cause issues if left unchecked, such as critical events, swap usage, or low database logging space. The safest possible risk value is 0%, while the worst risk value is 100%.
These values are computed in this order because Skylar One uses Availability values to compute Health, and then uses both Availability and Health values to compute Risk.
![]()
Events Swim Lanes
The section contains five swim lanes that display the number of unique events of each severity level that impacted your service or device over a period of time. By default, the events cover the last 12 hours.
The Events Panel
The Events panel contains the following tabs:
Starting in the AP2 Nougat release, the tab under the Events panel is renamed .
Events Tab
The tab displays a list of events for the selected service or device. This tab has much of the same functionality as the Events page.
The tab in the Events panel at the bottom of the Service Investigator page displays the number of events of each severity type, after masking, that are currently impacting the service. When opened, the tab lists all events impacting the service, including masked events.
You can perform the following action from the tab:
- Use the drop-down menu to choose which type of change events display in the widget: Active or Cleared.
- Use the search field to search for specific events.
- For events that are aligned to devices, click the arrow icon (
 ) next to the event to open the Device Summary window, which displays the following panes:
If you select Active, Skylar One displays events that are currently active and whose most recent detection occurred within the selected time range. If you select Cleared, Skylar One displays events that were cleared within the selected time range. The selected time range spans a maximum of 12 hours.
- Tools. A set of network diagnostic tools or user-initiated actions that you can run on the device associated with the event. Click the search bar to search for a tool or action to run, or click one of the default tools or actions that are available based on the device type and your user permissions.
- Vitals. A widget displaying the past four hours of CPU and memory usage for the device related to the event. You can zoom in on a shorter time frame by clicking and dragging, and you can go back to the original timespan by clicking the button.
- Logs. A list of the log entries from the device's log file, sorted from newest to oldest by default.
- View the Organizational Summary page for the organization aligned with the event by clicking the link in the Organization column.
- View the Service Investigator or Device Investigator page for the service or device aligned with the event by clicking the link in the Name column.
- View the Event Investigator page for the event by clicking the link in the Message column.
- View or edit event notes by clicking the Note icon (
 ) in the Event Note column or by clicking the button (
 ) and selecting Edit Event Note. Event notes contain event definitions, probable causes, and resolutions for the event, along with a text field where you can add more information about the event or the service or device you are monitoring.
 - View more information about masked events by clicking the masked events icon (
 ) in the Masked Events column. Masked events are related events that occur in quick succession on a single device or service that are rolled up and posted together under one event description, with only the highest severity event displayed.
 - Acknowledge the event by clicking the button. When you acknowledge an event, you let other users know that you are aware of that event, and you are working on a response.
- Clear an event by clicking the button. When you clear an event, you let other users know that the event has been addressed.
- Create a ticket from the event.
- View the event policy.
- View a log of automations that have occurred for the event by clicking the icon () and selecting View Automation Actions.
- Select multiple events for action using the check boxes next to the events.
For more information about events, see
Changes Tab
The tab displays the number of active change events that are impacting the service. Events on this tab will automatically clear after 30 minutes.
The tab is available if you have purchased Configuration and Change Management as a part of your Skylar One Standard or Advanced subscription. This tab displays a list of events that are created when PowerFlow pulls change data from ServiceNow or Restorepoint, including both active and cleared change events. For more information on how to configure, enable, or disable the tab on the Events pane, see the section on Configuring and Enabling the Changes Tab.
You can perform the following actions on the tab:
- Use the drop-down menu to choose which type of change events display in the widget: Active or Cleared.
- Filter and search for events by their date; either by 5, 7, 14, 30 days, or more than 30 days.
- Use the Search field to search for specific change events.
- For active events that are aligned to devices, click the arrow icon () next to the event to open the Device Summary window, which displays the following panes:
If you select Active, Skylar One displays events that are currently active and whose most recent detection occurred within the selected time range. If you select Cleared, Skylar One displays events that were cleared within the selected time range. The selected time range spans a maximum of 12 hours.
- Tools. A set of network diagnostic tools or user-initiated actions that you can run on the device associated with the event. Click the search bar to search for a tool or action to run, or click one of the default tools or actions that are available based on the device type and your user permissions.
- Vitals. A widget displaying the past 24 hours of CPU and memory usage for the device related to the event. You can zoom in on a shorter time frame by clicking and dragging, and you can go back to the original timespan by clicking the button.
- Logs. A list of the log entries from the device's log file, sorted from newest to oldest by default.
- View the Organizational Summary page for the organization aligned with an active event by clicking the link in the Organization column.
- View the Service Investigator or Device Investigator page for the service or device aligned with an active event by clicking the link in the Name column.
- View the Event Investigator page for an active event by clicking the link in the Message column or the Event ID column.
- For ServiceNow integrations, view the ServiceNow ticket associated with an active event by clicking the link in the Ticket ID column.
- For ServiceNow integrations, view the ServiceNow ticket associated with a cleared event by clicking the link in the External Ticket column.
- Acknowledge an active event by clicking the button. When you acknowledge an event, you let other users know that you are aware of that event, and you are working on a response.
- Clear an active event by clicking the button. When you clear an event, you let other users know that the event has been addressed.
- Create a ticket from an active event.
- Align an event to an existing ticket.
- View the event policy for an active event.
- Select multiple active events for action using the check boxes next to the events.
Service Analysis Tab
The tab displays the Service Analysis of a device or service and shows what is causing either one to be unhealthy based on the Service Policy.
For more information about enabling Service Analysis for a service, see the section on Using the Service Analysis Feature.
You can use the drop-down menu to choose whether you want to view the service's Health, Availability, or Risk analysis.
If you select Active, Skylar One displays events that are currently active and whose most recent detection occurred within the selected time range. If you select Cleared, Skylar One displays events that were cleared within the selected time range. The selected time range spans a maximum of 12 hours.
The following columns appear on the tab:
- Service/Device Name. The name of the service or device that contributed to the health, availability, or risk status for the selected time period.
- Current State. The current health, availability, or risk status for the service or device.
- Condition. The equation that is used to determine the health, availability, or risk status for the service or device.
- Current Value. The current health, availability, or risk value for the service or device, as determined by the value of the equation used in the Condition column.
- Historical Value. The historical health, availability, or risk value for the service or device for the selected time period, as determined by the value of the equation used in the Condition column.
- Timestamp. The date and time the service analysis was collected from the service or device.
You can click on any of the column heading labels to sort the tab by the values in that column.
Skylar Advisor Tab
Starting in the AP2 Nougat release, the tab under the Events panel is renamed .
The tab displays a list of Skylar Automated RCA events.
You can view Skylar Automated RCA suggestions and alerts in the tab of the Events pane on the Service Investigator page. To use this feature, you will need to set up the connection between Skylar Automated RCA and Skylar One. For more information, see Configuring the Skylar Automated RCA Connector for Skylar One.
You can perform the following actions on the tab:
- Use the drop-down menu to choose which type of change events display in the tab: Active Events or Cleared Events.
- Filter and search for Skylar Automated RCA events by their date: either by 5, 7, 14, 30, or more than 30 days.
- Use the Search field to search for specific change events.
- For active events that are aligned to devices, click the arrow icon () next to the event to open the Device Summary window, which displays the following panes:
If you select Active, Skylar One displays Skylar AI sourced events that are currently active and whose most recent detection occurred within the selected time range. If you select Cleared, Skylar One displays events that were cleared within the selected time range. The selected time range spans a maximum of 12 hours.
- Tools. A set of network diagnostic tools or user-initiated actions that you can run on the device associated with the event. Click the search bar to search for a tool or action to run, or click one of the default tools or actions that are available based on the device type and your user permissions.
- Vitals. A widget displaying the past 24 hours of CPU and memory usage for the device related to the event. You can zoom in on a shorter time frame by clicking and dragging, and you can go back to the original timespan by clicking the button.
- Logs. A list of the log entries from the device's log file, sorted from newest to oldest by default.
- View the Organizational Summary page for the organization aligned with an active Skylar Automated RCA event by clicking the link in the Organization column.
- View the Service Investigator or Device Investigator page for the service or device aligned with an active Skylar Automated RCA event by clicking the link in the Name column.
- View the Event Investigator page for an active Skylar Automated RCA event by clicking the link in the Message column.
- For ServiceNow integrations, view the ServiceNow ticket associated with an active event by clicking the link in the Ticket External Reference column.
- For ServiceNow integrations, view the ServiceNow ticket associated with a cleared event by clicking the link in the External Ticket column.
- Acknowledge an active event by clicking the button. When you acknowledge a Skylar Automated RCA event, you let other users know that you are aware of that event, and you are working on a response.
- Clear an active Skylar Automated RCA event by clicking the button. When you clear a Skylar Automated RCA event, you let other users know that the event has been addressed.
- Create a ticket from an active Skylar Automated RCA event.
- View the event policy for an active Skylar Automated RCA event.
- Select multiple active Skylar Automated RCA events for action using the check boxes next to the events.
Using the Service Analysis Feature
Skylar One users can use the Service Analysis feature to determine what is causing a service to be unhealthy, troubleshoot that service, and refine its policies.
When you enable Service Analysis on a business service or IT service, it will also implicitly enable Service Analysis on any child IT services or device services.
Enabling Service Analysis
To enable Service Analysis:
- Click on the Business Services icon (
 ) to go to the Business Services page.
 - Click the Name of an existing service. The Service Investigator page for that service displays.
- On the Service Investigator page, click .
- Select one of the following options from the Service Analysis drop-down field:
- Disabled. The Service Analysis feature is disabled.
- Enabled (contributors only). The Service Analysis feature is continuously enabled only for contributing rules and devices. When you select this option, a full analysis will be generated and saved in the time series chart, but it will exclude results from non-contributing rules and devices.
- Enabled (next run only). The Service Analysis feature is enabled only for the next data collection.
- Enabled. The Service Analysis feature is continuously enabled for all rules and devices. When you select this option, a full analysis will be generated and saved in the time series chart, and it will include results from non-contributing rules and devices.
If a service has RCA Options set to Enabled and has a child service removed, Skylar One will not compute the health, availability, and risk values until the Service Topology Engine returns an updated topology, which occurs every 5 minutes by default.
Before deleting child services in a 3-tier hierarchy, check if the parent service has the RCA Options field set to Enabled. If it does, then set the field to Disabled before deleting the child services.
You might experience performance slowdown if Service Analysis is continuously enabled.
- Click .
Configuring and Enabling the Changes Tab
To use the tab on the Events panel, you must first configure and enable the tab. To do so:
- Ensure that you are running Skylar One version 12.1.0 or later and have "Business Services Base Pack" PowerPack version 2.2.0 or later installed in Skylar One. For more information, see
- Ensure that you are running Skylar One PowerFlow Platform version 2.2.2 or greater and one or more of the following PowerPacks, depending on your integration:
- For a ServiceNow integration:
- "ServiceNow CMDB" SyncPack version 3.2.0 or later installed in PowerFlow. For more information, see
- "ServiceNow Change Management" SyncPack version 3.2.1 or later installed in PowerFlow. For more information, see
- For a Restorepoint integration:
- "Restorepoint" SyncPack version 1.2.0 or later installed in PowerFlow.
- "Restorepoint" PowerPack version 102 or later installed in Skylar One.
- "Restorepoint Automation" PowerPack version 102 or later installed in Skylar One. For more information, see
-
In Skylar One, create a SOAP/XML credential to connect with PowerFlow and make note of its credential ID.
-
For a ServiceNow integration:
- In PowerFlow, sync Skylar One devices with ServiceNow and make note of the Configuration field value in the Sync Devices from Skylar One to ServiceNow application.
- In Skylar One, open the "ServiceNow: Send Change Request Event to PowerFlow" Run Book Action (which is included in the "Business Services Base Pack" PowerPack v2.1 and greater) and edit the input parameters to include the credential ID from step 3 and the Configuration field value from step 4a.
-
For a Restorepoint integration, follow the steps in
-
Do one of the following:
-
Permanently enable the tab by editing the NextUI configuration file on your Skylar One system.
-
Temporarily enable the tab by running a GraphQL mutation on your Skylar One system.
-
Creating a SOAP/XML Credential for PowerFlow
To create a SOAP/XML credential to connect Skylar One with Skylar Automation (PowerFlow):
- Follow the steps in the section
- After saving the credential, make note of the credential ID. This number can be found at the top of the Edit SOAP/XML Credential modal or in the ID column on the Credentials page (Manage > Credentials) or Credential Management page (System > Manage > Credentials).
Syncing Skylar One Devices with ServiceNow
To sync Skylar One devices with ServiceNow:
- Follow the steps in the section
- In the Configuration pane of the "Sync Devices from Skylar One to ServiceNow" application, make note of the value in the Configuration field.
Editing the Run Book Action
To edit the input parameters in the "ServiceNow: Send Change Request Event to PowerFlow" run book action:
- Go to the PowerPack Manager page (System > Manage > PowerPacks).
- Locate the "Business Services Base Pack" PowerPack and click its wrench icon (
 ). The Editing PowerPack modal appears.
 - In the Editing PowerPack modal, click Run Book Actions in the left Navbar. The Embedded Run Book Actions page appears in the modal.
- Click the wrench icon () for the "ServiceNow: Send Change Request Event to PowerFlow" run book action. The Policy Editor modal appears.
- In the Policy Editor modal, make the following edits to the Input Parameters field:
- Replace <sl1 credential id for powerflow> with the credential ID of the SOAP/XML credential you created for PowerFlow.
- Replace <pf config id> with the Configuration field value from the "Sync Devices from Skylar One to ServiceNow" application in PowerFlow.
- Click , then exit the Policy Editor modal.
- Exit the Editing PowerPack modal.
Syncing Skylar One Devices with Restorepoint
To sync Skylar One devices with Restorepoint:
- Follow the steps in the section
- In PowerFlow, open the Configuration pane for the "Restorepoint: Sync Devices" application and select Enable for the restorepoint_config field to allow device change detection.
- Make a note of the restorepoint_id value on the Configuration pane for the "Restorepoint: Sync Devices" application.
- In Skylar One, go to the Device Investigator page for the devices synced from Restorepoint, click on the tab, and ensure that the same restorepoint_id value was added to the Values column.
Permanently Enabling the Changes Tab
To permanently enable the tab using the NextUI configuration file, run the following steps on all appliances, including the Administration Portal, the Database Server, the Data Engine, and the All-In-One Appliance.
To permanently enable the tab:
-
Start an SSH session into one of the Skylar One appliances.
-
Using vi or another text editor, edit the /opt/em7/nextui/nextui.conf file. To do so, enter the following at the shell prompt:
sudo vi /opt/em7/nextui/nextui.conf
-
Add the following line at the bottom of the NextUI configuration file:
BUSINESS_SERVICES_CHANGE_EVENTS_TAB=enabled
-
Save your changes, and then restart the NextUI service by running the following command:
sudo systemctl restart nextui
-
Repeat steps 1-4 for the remaining Skylar One appliances.
Temporarily Enabling the Changes Tab
To temporarily enable the tab using GraphQL:
-
Go to the GQL Browser (System > Tools > GQL Browser).
-
In the main query pane, type the following mutation:
mutation updateChangeEventsTab {
	updateFeatureToggle(
		id: "system:BUSINESS_SERVICES_CHANGE_EVENTS_TAB"
		value: "enabled"
	) {
		id
		value
	}
}
Click the button to format the mutation and to add syntax highlighting to make the mutation easier to read. Note that the Prettify Query process removes the query syntax if only one query is present in the main query pane.
-
Click the (Play) button. The mutation executes, and the results appear in the pane on the right side.
If the tab does not appear in Skylar One after executing the mutation, refresh the page using the key or by clicking the refresh button in your web browser.
For more information about GraphQL, see the GraphQL documentation.