![]()
This
The Service Investigator page has two different user interfaces and viewing options depending on the SL1 version you are running:
-
Default Service Investigator. The default view of the Service Investigator page in SL1 version 12.2.0 and earlier.
-
Enhanced Service Investigator. The enhanced view of the Service Investigator page. This page is disabled by default and requires a minimum SL1 version of 12.2.0 or later, and a minimum of AP2 Biscotti version 8.0.20.
For instructions on how to download and install AP2 Biscotti version 8.0.20, see
For instructions on how to enable to disable the enhanced Service Investigator page, see
The following video explains how you can use the features on the Service Investigator page to help you avoid business service impact and lower Mean Time to Repair (MTTR):
Use the following menu options to navigate the SL1 user interface:
- To view a pop-out list of menu options, click the menu icon (
 ).
). - To view a page containing all of the menu options, click the Advanced menu icon (
 ).
).
Viewing the Default Service Investigator
To view the Service Investigator page, select a service from the list on the Business Services page (![]() ).
).
Starting in SL1 version 12.2.0, you can view Zebrium suggestions and alerts in the Timeline widget and the Log Insights tab of the Service Investigator page. For SL1 12.2.0, you will need to set up the connection between Zebrium and SL1. For more information, see Configuring the Zebrium Connector for SL1.
The Tabs on the Default Service Investigator Page
The Service Investigator page contains the following tabs:
Each of these tabs is described in the following sections.
The Overview Tab
The tab provides a single-page view of your services. This tab enables users to determine the behavioral correlation between a service's health, availability, and risk values and the events, anomalies, or other causes that might be impacting those values. This behavioral correlation feature provides users with a "big picture" view of the service and enables them to determine the root cause of any problems the service might be experiencing and then troubleshoot those problems.
The tab consists of the following widgets:
- Sunburst or Map dashboard widget
- Health, Availability, and Risk widgets
- Changes widget
- Events widget
- Anomalies widget
Each of these widgets is described in the following sections.
Sunburst Widget
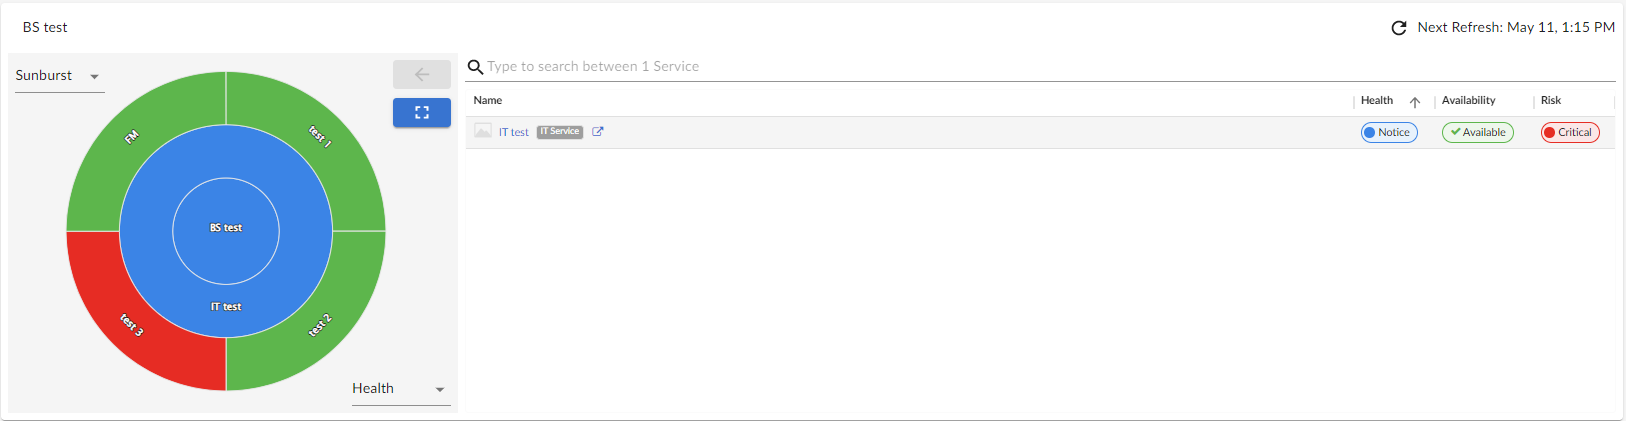
The top dashboard widget of the tab displays either a Sunburst chart view or a Map view of your services. Use the drop-down menu in the top left corner of the widget to select which view you want to appear.
When you select the Sunburst view:
- The left pane includes a sunburst chart that displays the current Health, Availability, and Risk values for the service, as well as for any constituent IT services or device services that belong to that top-level service. For device services, the sunburst includes the device name and Health values for any devices that belong to the service. Additionally, this pane indicates the maximum number of constituent services or devices that will be used for computing health, availability, and risk.
- The right panel includes a list of constituent services or devices. Each service in this panel includes icons that represent that service's Availability, Health, and Risk metrics; devices include icons that represent each device's Health value. The right panel also includes a search bar at the top of the panel that enables you to search for specific constituent services or devices.
In the sunburst chart, the center circle represents the selected service. The selected service drives the context for the page title and Info drawer, as well as all the other panels and widgets on the tab. This means that the right panel, widgets, and other elements on the page will all reflect the metrics for the service in the center circle of the sunburst.
You can navigate through services on the widget in the following ways:
- In the left panel, you can click any of the constituent IT services or device services in the sunburst to select that service. To return to the parent IT service or business service, click the center circle or click the button.
- In the right panel, you can click the service name of any of the constituent IT services or device services to select that service. To return to the parent IT service or business service, click the breadcrumb links that appear in the top-left corner of the widget.
By default, the sunburst displays the Health value for the selected service and its constituent services or devices. To view the current Availability or Risk value for the selected service, click the drop-down button in the lower-right corner of the left pane and select Availability or Risk.
To collapse the sunburst widget, click the up arrow icon (![]() ) in the top-right corner of the widget. To reopen it, click the down arrow icon (
) in the top-right corner of the widget. To reopen it, click the down arrow icon (![]() ).
).
Map Widget
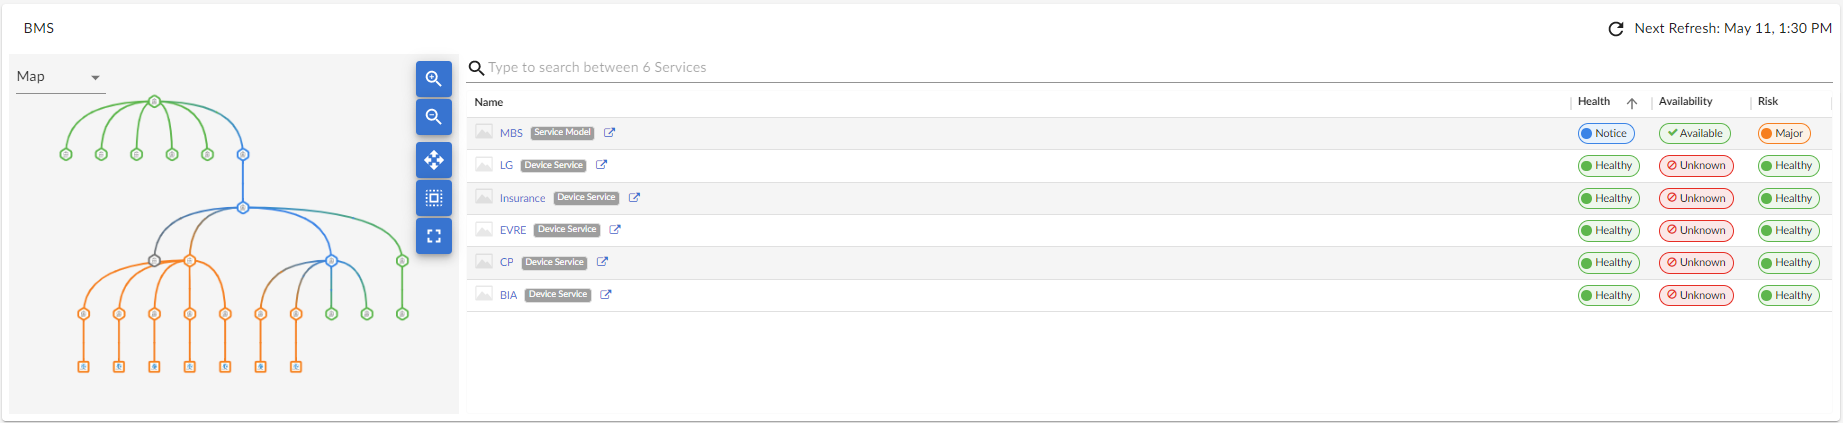
The top dashboard widget of the tab displays either a Sunburst chart view or a Map view of your services. Use the drop-down menu in the top left corner of the widget to select which view you want to appear.
When you select the Map view:
- The left pane includes a map of the service and any constituent services and devices that belong to that top-level service.
- The right panel includes a list of constituent services or devices. Each service in this panel includes icons that represent that service's Availability, Health, and Risk metrics; devices include icons that represent each device's Health value. The right panel also includes a search bar at the top of the panel that enables you to search for specific constituent services or devices.
In the map view, you can click on the top-level service or any of its constituent services or devices. The selected service drives the context for the page title and Info drawer, as well as all the other panels and widgets on the tab. This means that the right panel, widgets, and other elements on the page will all reflect the metrics for the service that you have clicked in the map view.
In the map view, use the following buttons to manipulate the map in the left pane:
![]() : Zoom in on the map.
: Zoom in on the map.
![]() : Zoom out on the map.
: Zoom out on the map.
![]() : Fit all elements of a map into the viewing pane.
: Fit all elements of a map into the viewing pane.
![]() : Center all selected elements of a map in the viewing pane.
: Center all selected elements of a map in the viewing pane.
The viewing pane displays the following two types of graphical elements:
- Nodes that represent Devices, Topology Elements, and Business Services defined in SL1. The shape of the node represents its type: Services, such as business services, IT services, or device services, are represented by hexagons, while devices are represented by squares. The color of the outline specifies the current state of the node.
- Edges are lines that represent the relationships and hierarchies between nodes.
When you hover over a node, a pop-up Properties pane appears with the metadata for that node. Click the or link at the top of the pane to open the Investigator page for that service or device in a new browser window.
Health, Availability, and Risk Widgets

The Health, Availability, and Risk widgets display a time series chart with the historical values of those metrics for the selected service from each polling cycle over the previous 24 hours.
From these widgets, you can do the following:
- Hover your mouse over the chart to view the value for each polling cycle from the previous 24 hours.
- Click and drag your mouse over a series of bars in the chart to zoom in on that specific timespan. To return to the 24-hour view, click .
- Click a specific polling cycle to view the historic Health, Availability, and Risk values for that polling cycle.
If the RCA Options field is enabled, you can also view Root Cause Analysis information for the service to help you troubleshoot the root cause of a particular Health, Availability, or Risk value for a specific polling cycle. To view Root Cause Analysis information, click one of the polling cycles in the time series chart.
For more information about Health, Availability, and Risk, see the section Understanding Health, Availability, and Risk.
Changes Widget

The Changes widget is available to customers who have purchased Configuration and Change Management as part of their SL1 Standard or Premium subscription. This widget displays a list of events that are created when PowerFlow pulls change data from ServiceNow or Restorepoint, including both active and cleared change events.
The Changes widget appears only if it has been properly configured and enabled.
The Changes widget tile displays the number of active change events that are impacting the service. Events on the widget will automatically clear after 30 minutes.
From the Changes widget, you can do the following:
- Use the drop-down menu to choose which type of change events display in the widget: Active Events or Cleared Events.
- Filter and search for events by their date; either by 5, 7, 14, 30 days, or more than 30 days.
- Use the Search field to search for specific change events.
- For active events that are aligned to devices, click the down-arrow icon (
 ) next to the event to open the Event Drawer panel, which displays the following panes:
- Vitals. A widget displaying the past 24 hours of CPU and memory usage for the device related to the event. You can zoom in on a shorter time frame by clicking and dragging, and you can go back to the original timespan by clicking the button.
- Tools. A set of network diagnostic tools or user-initiated actions that you can run on the device associated with the event. Click the search bar to search for a tool or action to run, or click one of the default tools or actions that are available based on the device type and your user permissions.
- Logs. A list of the log entries from the device's log file, sorted from newest to oldest by default.
- View the Organizational Summary page for the organization aligned with an active event by clicking the link in the Organization column.
- View the Service Investigator or Device Investigator page for the service or device aligned with an active event by clicking the link in the Name column.
- View the Event Investigator page for an active event by clicking the link in the Message column.
- For ServiceNow integrations, view the ServiceNow ticket associated with an active event by clicking the link in the Ticket External Reference column.
- For ServiceNow integrations, view the ServiceNow ticket associated with a cleared event by clicking the link in the External Ticket column.
- Acknowledge an active event by clicking the button. When you acknowledge an event, you let other users know that you are aware of that event, and you are working on a response.
- Clear an active event by clicking the button. When you clear an event, you let other users know that the event has been addressed.
- Create a ticket from an active event.
- View the event policy for an active event.
- Select multiple active events for action using the check boxes next to the events.
Configuring and Enabling the Changes Widget
To use the Changes widget, you must first configure and enable the widget. To do so, perform the following steps:
- Ensure that you are running SL1 version 11.2.0 or later and have Business Services Base Pack PowerPack version 2.2.0 or later installed in SL1. For more information, see
- Ensure that you are running SL1 PowerFlow Platform version 2.2.2 or greater and one or more of the following PowerPacks, depending on your integration:
- For a ServiceNow integration:
- ServiceNow CMDB SyncPack version 3.2.0 or later installed in PowerFlow. For more information, see
- ServiceNow Change Management SyncPack version 3.2.1 or later installed in PowerFlow. For more information, see
- For a Restorepoint integration:
- Restorepoint SyncPack version 1.2.0 or later installed in PowerFlow.
- Restorepoint PowerPack version 102 or later installed in SL1.
- Restorepoint Automation PowerPack version 102 or later installed in SL1. For more information, see
- In SL1, create a SOAP/XML credential to connect with PowerFlow and make note of its credential ID.
-
For a ServiceNow integration:
- In PowerFlow, sync SL1 devices with ServiceNow and make note of the Configuration field value in the Sync Devices from SL1 to ServiceNow application.
- In SL1, open the "ServiceNow: Send Change Request Event to PowerFlow" Run Book Action (which is included in the Business Services Base Pack PowerPack v2.1 and greater) and edit the input parameters to include the credential ID from step 3 and the Configuration field value from step 4.
-
For a Restorepoint integration, follow the steps in
-
Finally, do one of the following:
-
Permanently enable the Changes widget by editing the NextUI configuration file on your SL1 system.
-
Temporarily enable the Changes widget by running a GraphQL mutation on your SL1 system.
-
Creating a SOAP/XML Credential for PowerFlow
To create a SOAP/XML credential to connect SL1 with PowerFlow:
- Follow the steps in the section
- After saving the credential, make note of the credential ID. This number can be found at the top of the Edit SOAP/XML Credential modal or in the ID column on the Credentials page (Manage > Credentials) or Credential Management page (System > Manage > Credentials).
Syncing SL1 devices with ServiceNow
To sync SL1 devices with ServiceNow:
- Follow the steps in the section
- In the Configuration pane of the "Sync Devices from SL1 to ServiceNow" application, make note of the value in the Configuration field.
To edit the input parameters in the "ServiceNow: Send Change Request Event to PowerFlow" Run Book Action:
- Go to the PowerPack Manager page (System > Manage > PowerPacks).
- Locate the Business Services Base Pack PowerPack and click its wrench icon (
 ). The Editing PowerPack modal appears.
 - In the Editing PowerPack modal, click Run Book Actions in the left Navbar. The Embedded Run Book Actions page appears in the modal.
- Click the wrench icon () for the "ServiceNow: Send Change Request Event to PowerFlow" Run Book Action. The Policy Editor modal appears.
- In the Policy Editor modal, make the following edits to the Input Parameters field:
- Replace <sl1 credential id for powerflow> with the credential ID of the SOAP/XML credential you created for PowerFlow.
- Replace <pf config id> with the Configuration field value from the "Sync Devices from SL1 to ServiceNow" application in PowerFlow.
- Click , then exit the Policy Editor modal.
- Exit the Editing PowerPack modal.
Syncing SL1 Devices with Restorepoint
To sync SL1 devices with Restorepoint:
- Follow the steps in the section
- In PowerFlow, open the Configuration pane for the "Restorepoint: Sync Devices" application and select Enable for the restorepoint_config field to allow device change detection.
- Make a note of the restorepoint_id value on the Configuration pane for the "Restorepoint: Sync Devices" application.
- In SL1, make sure that the same restorepoint_id value was added to the Values column on the tab on the Device Investigator page for the devices synced from Restorepoint.
Permanently Enabling the Widget
To permanently enable the Changes widgetusing the NextUI configuration file, run the following steps on all appliances, including the Administration Portal, the Data Collector, the Database Server, the Data Engine, and the All-In-One Appliance.
To permanently enable the Changes widget:
-
Start an SSH session into one of the SL1 appliances.
-
Using vi or another text editor, edit the /opt/em7/nextui/nextui.conf file. To do so, enter the following at the shell prompt:
sudo vi /opt/em7/nextui/nextui.conf
-
Add the following line at the bottom of the NextUI configuration file:
BUSINESS_SERVICES_CHANGE_EVENTS_TAB=enabled
-
Save your changes, and then restart the NextUI service by running the following command:
sudo systemctl restart nextui
-
Repeat steps 1-4 for the remaining SL1 appliances.
Temporarily Enabling the Widget
To temporarily enable the Changes widget using GraphQL:
-
To access the GraphiQL interface, type the URL or IP address for SL1 in a browser, add /gql to the end of the URL or IP address, and press . The GraphiQL interface appears.
-
In the main query pane, type the following mutation:
mutation updateChangeEventsTab {
	updateFeatureToggle(
		id: "system:BUSINESS_SERVICES_CHANGE_EVENTS_TAB"
		value: "enabled"
	) {
		id
		value
	}
}
Click the button to format the mutation and to add syntax highlighting to make the mutation easier to read. Note that the Prettify process removes the query syntax if only one query is present in the main query pane.
-
Click the (Play) button. The mutation executes, and the results appear in the pane on the right side.
If the Changes widget does not appear in SL1 after executing the mutation, refresh the page using the key or by clicking the refresh button in your web browser.
For more information about GraphQL, see the GraphQL documentation. For more information about the GraphiQL user interface, see the GraphiQL user interface documentation.
Events Widget
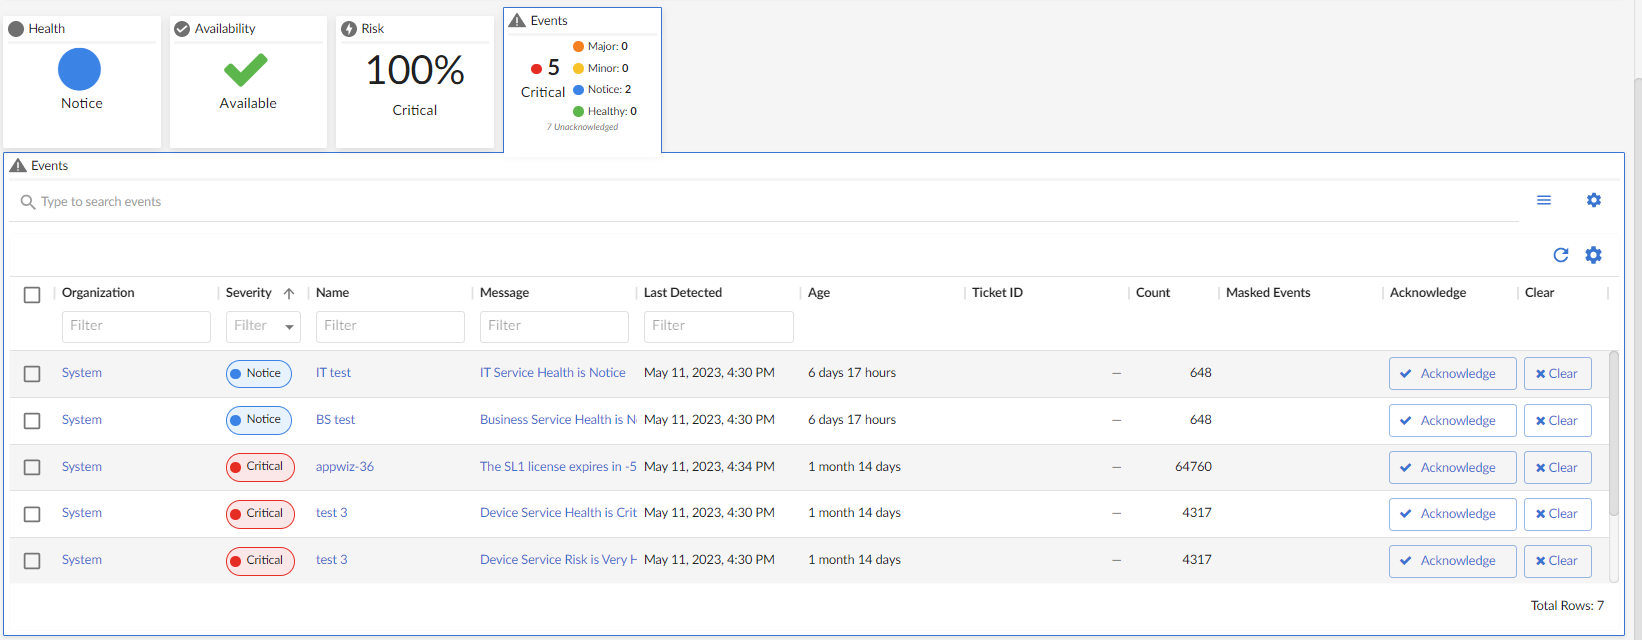
The Events widget displays a list of events for the selected service. This widget has much of the same functionality as the Events page.
The Events widget tile displays the number of events of each severity type,
From the Events widget, you can do the following:
- Use the search field to search for specific events.
- For events that are aligned to devices, click the down-arrow icon (
 ) next to the event to open the Event Drawer panel, which displays the following panes:
- Vitals. A widget displaying the past 24 hours of CPU and memory usage for the device related to the event. You can zoom in on a shorter time frame by clicking and dragging, and you can go back to the original timespan by clicking the button.
- Tools. A set of network diagnostic tools or user-initiated actions that you can run on the device associated with the event. Click the search bar to search for a tool or action to run, or click one of the default tools or actions that are available based on the device type and your user permissions.
- Logs. A list of the log entries from the device's log file, sorted from newest to oldest by default.
- View the Organizational Summary page for the organization aligned with the event by clicking the link in the Organization column.
- View the Service Investigator or Device Investigator page for the service or device aligned with the event by clicking the link in the Name column.
- View the Event Investigator page for the event by clicking the link in the Message column.
- View or edit event notes by clicking the Note icon (
 ) in the Event Note column or by clicking the button (
 ) and selecting Edit Event Note. Event notes contain event definitions, probable causes, and resolutions for the event, along with a text field where you can add more information about the event or the service or device you are monitoring.
 - View more information about masked events by clicking the masked events icon (
 ) in the Masked Events column. Masked events are related events that occur in quick succession on a single device or service that are rolled up and posted together under one event description, with only the highest severity event displayed.
 - Acknowledge the event by clicking the button. When you acknowledge an event, you let other users know that you are aware of that event, and you are working on a response.
- Clear the event by clicking the button. When you clear an event, you let other users know that the event has been addressed.
- Create a ticket from the event.
- View the event policy.
- View a log of automations that have occurred for the event by clicking the icon () and selecting View Automation Actions.
- Select multiple events for action using the check boxes next to the events.
For more information about events, see
Anomalies Widget
If one or more devices within a business, IT, or device service has anomaly detection enabled, the Anomalies widget will appear on the tab of the Service Investigator. The Anomalies widget displays a list of all the devices within the selected service that have anomaly detection enabled.
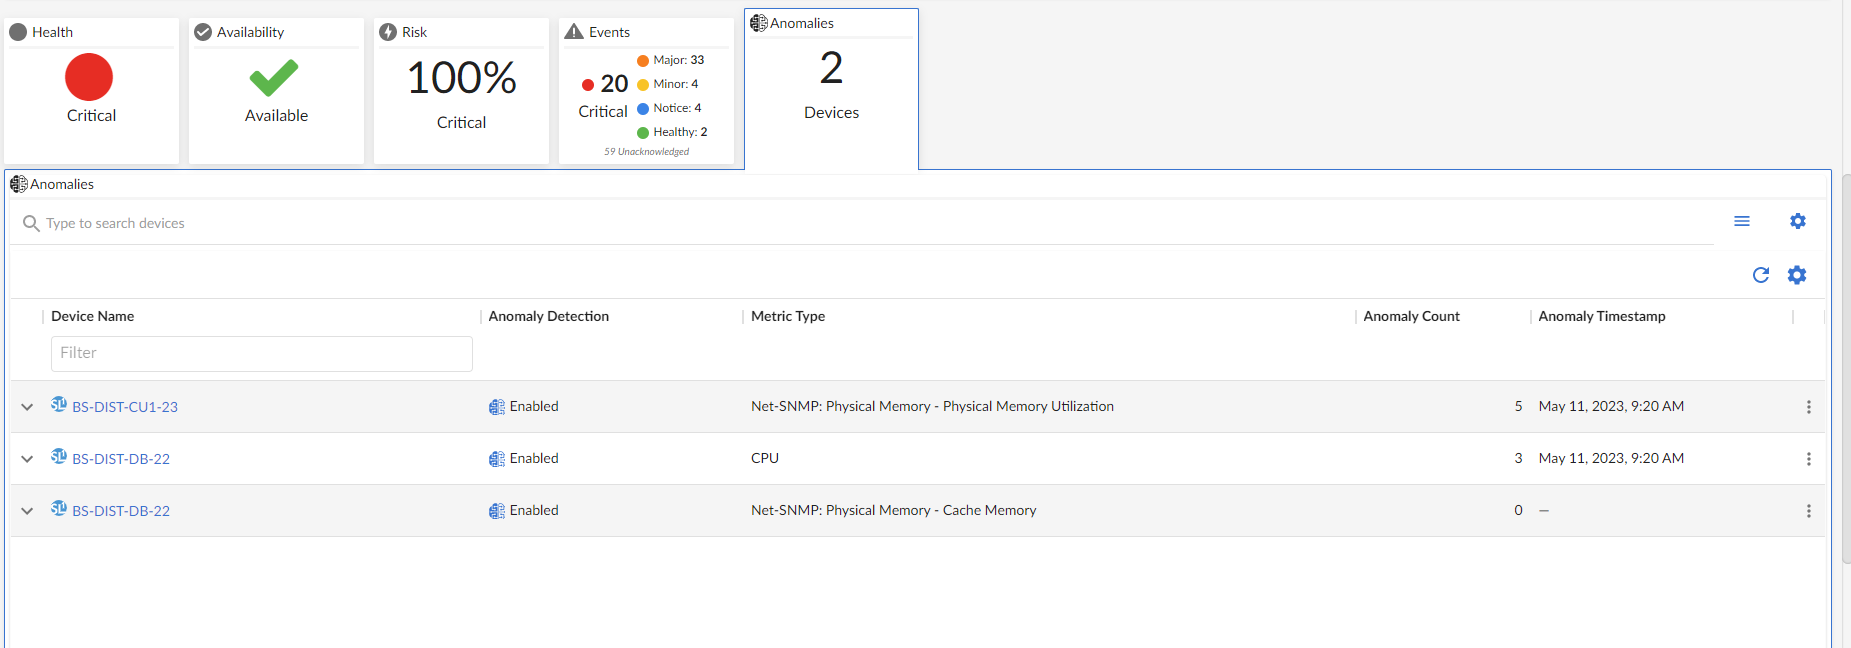
The Anomalies widget appears only if you have at least one device in the selected service that has anomaly detection enabled. For more information about enabling anomaly detection, see
Machine learning and anomaly detection are available only in SL1 Premium solutions. To upgrade, contact ScienceLogic Customer Support.
You can filter the items on this inventory page by typing filter text or selecting filter options in one or more of the filters found above the columns on the page. For more information, see
On the widget of the Device Investigator, you can view a list of devices that are enabled for anomaly detection. Each device has a set of graphs that tracks the anomaly detection data for that device.
You can view these graphs by clicking the Expand icon (![]() ) next to the device or the metric for the device. The Anomaly Chart modal appears, displaying the "Anomaly Index" chart above the chart for the specified metric you are monitoring.
) next to the device or the metric for the device. The Anomaly Chart modal appears, displaying the "Anomaly Index" chart above the chart for the specified metric you are monitoring.
The "Anomaly Index" chart displays a graph of values from 0 to 100 that represent how far the real data for a metric diverges from its normal patterns. The lines in the chart are color-coded by the level of event that gets triggered as the data diverges further and further. You can define the thresholds for the Anomaly Index, and whether those values generate alerts, on the Machine Learning Thresholds page (Machine Learning > Thresholds). For more information, see Enabling Alerts and Thresholds for the Anomaly Index.
In the second graph, the blue shape represents the expected value range for the selected device metric over the given time period, the green line indicates the actual values that SL1 collected over that time period, and the small red dots at top left represent the anomalies where the actual value fell outside of the expected range.

You can hover over a value in one of the charts to see a pop-up box with the Expected Range and the metric value. The Anomaly Index value also displays in the pop-up box, with the severity in parentheses: Normal, Low, Medium, High, or Very High.
The second graph displays the following data:
- A blue band representing the range of probable values that SL1 expected for the device metric.
- A green line representing the actual value for the device metric.
- A red dot indicating anomalies where the actual value appears outside of the expected value range.
You can use the time span filter on the Anomalies widget to adjust the time span of anomalies that appears in the graph. The default filter is Last 24 hours, but you can select a time span ranging from Last Hour up to Last 2 Years. You can also zoom in on a shorter time frame by clicking and dragging your mouse over the part of the chart representing that time frame, and you can return to the original time span by clicking the button.
The Services/Devices Tab
For business services and IT services, the tab displays the services currently being used in the service; for device services, the tab displays devices included in the service.
You can edit the query at the top of the tab to control which services or devices appear on the page when you click .
The "ANY" search option is disabled on the or tab.
For more information about the or tab for business services, IT services, and device services, see the section on Creating Business, IT, or Device Services.
For Custom Service Models, the tab displays two tabs:
- Hierarchy. Enables you to edit your service hierarchy by adding, moving, or deleting service groups.
- Details. Includes two sub-tabs:
- Overview. Enables you to update the managing organization and visible organizations for the individual levels within your service model hierarchy.
- Status Policy. Enables you to create a new status policy or apply an existing status policy for the individual levels within your service model hierarchy.
To make changes on either of these tabs, click , make your updates, and then click .

For more information about the tab for service models, see the section on Creating a Custom Service Model.
The Status Policy Tab
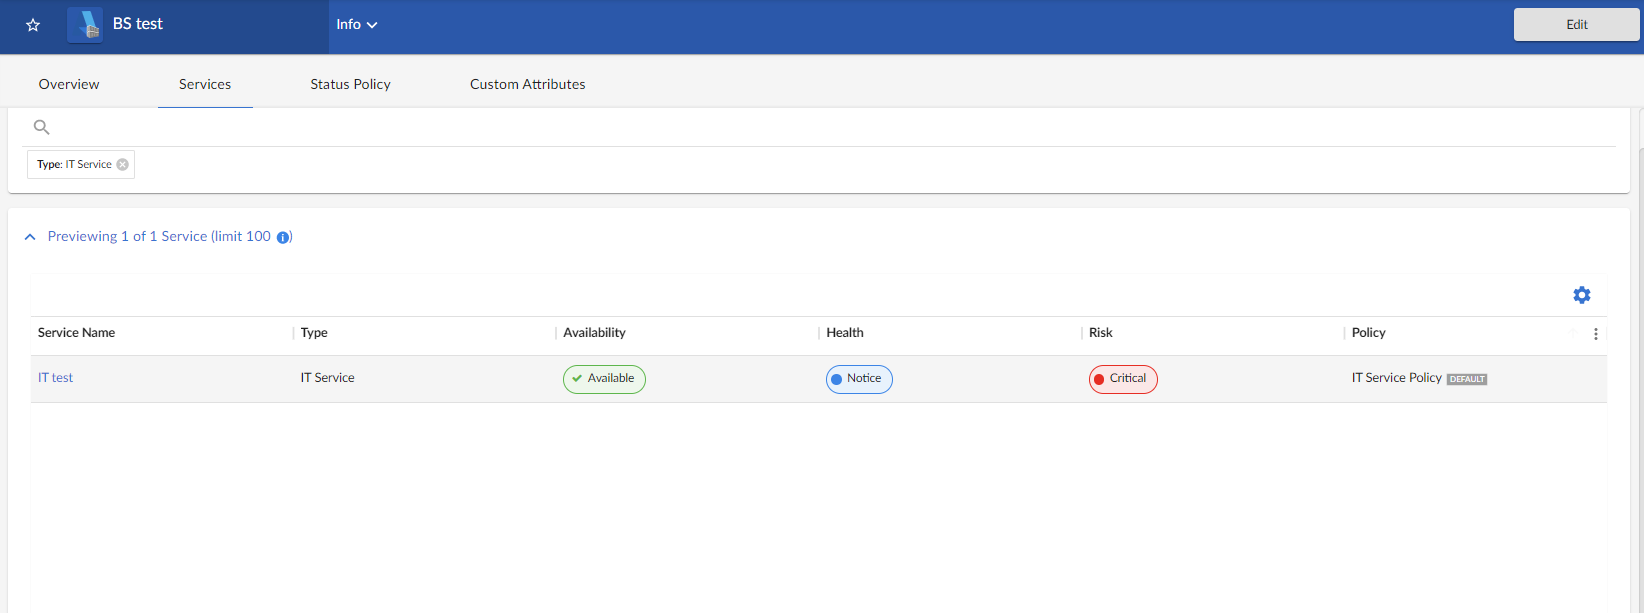
The tab displays a list of all the policies of that service type that are currently in the system and that can be chosen to associate with the service being viewed.
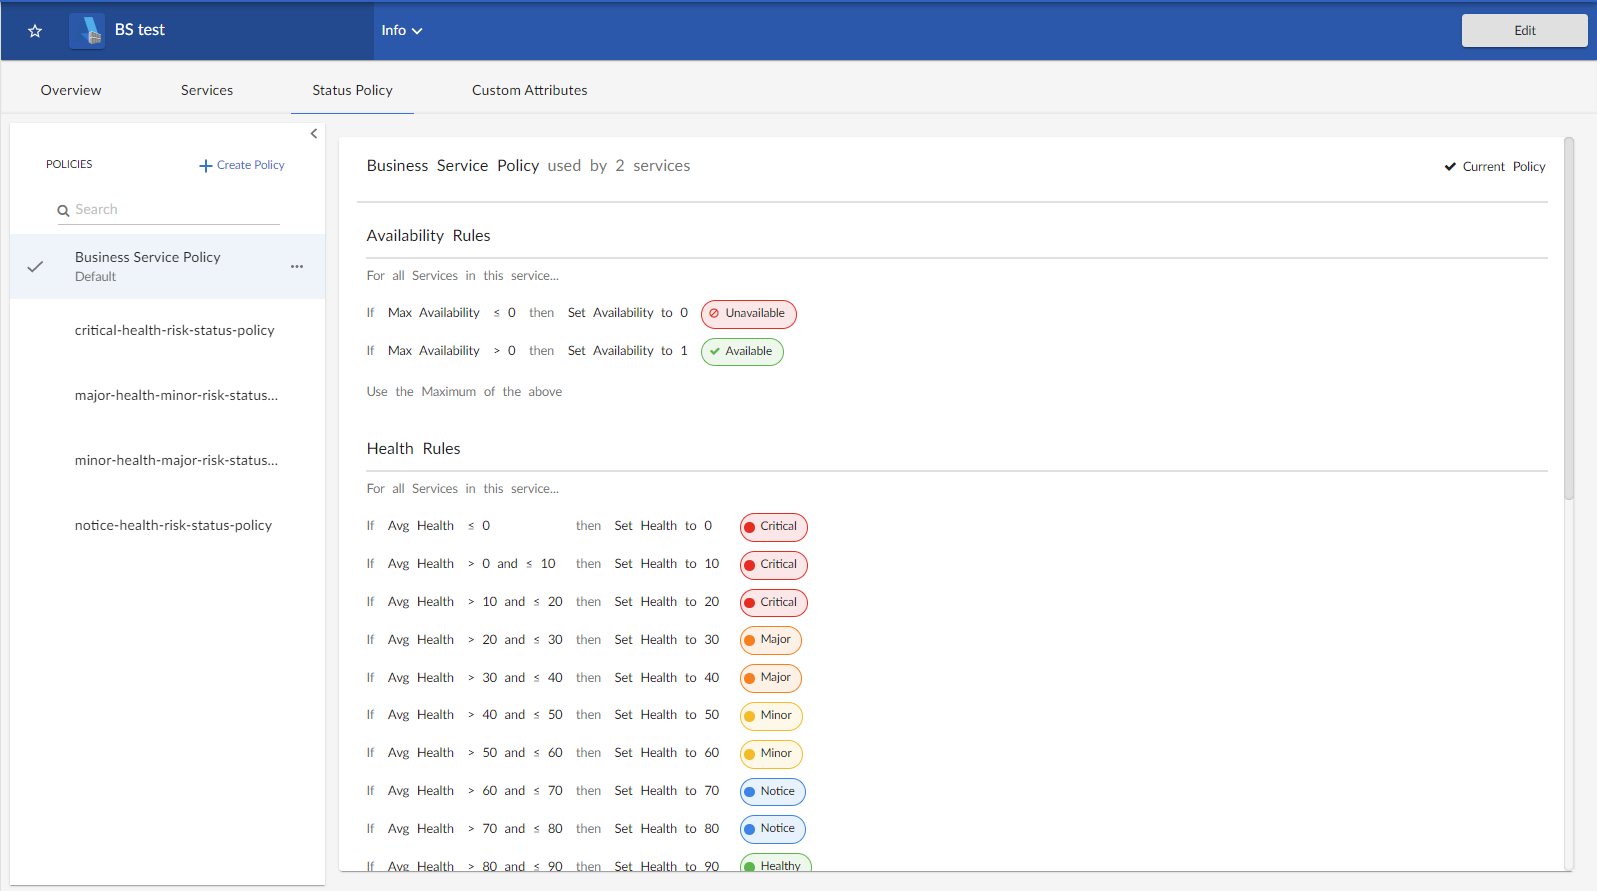
On this tab, you can change the policy used by a service, and you can also create a new service policy. A Default label appears next to the default policies.
For more information about selecting or changing a service policy, see the section on Selecting a Service Policy. For more information about creating a new service policy, see the section on Creating a Service Policy.
Depending on the thresholds you configured on the Business Services Thresholds page (Business Services > Thresholds), SL1 generates an alert message if a threshold is crossed.
For more information about thresholds, see the section on Managing Service Thresholds.
The Custom Attributes Tab
The tab displays a list of all of the custom attributes that are aligned with your service. On this tab, you can align additional custom attributes to the service, edit the values for the custom attributes, and unalign custom attributes from the service.

Custom Attributes are customized name-value pairs. You can use custom attributes to add custom fields to services. In SL1, you can create and update custom attributes via the API, in configuration Dynamic Applications, and on the Custom Attributes page (Manage > Custom Attributes).
You can use custom attributes when importing services from an integrated system to handle incoming properties that are not defined in SL1.
There are two categories of custom attributes:
- Base Custom Attributes. Base custom attributes for services are aligned to all services. Therefore, all base custom attributes in your SL1 system that have a Resource Type of Service will appear on the tab for all services. You can edit the value of a base custom attribute for a particular service, but you cannot unalign a base custom attribute from a service.
- Extended Custom Attributes. Extended custom attributes that have a Resource Type of Service can be aligned individually to one or more services. For example, you could align an extended custom attribute only to those services to which the custom field applies. You can also edit an extended attribute value for a particular service or unalign an extended custom attribute from a service.
From the tab, you can click the button to do the following:
- Click to align an extended custom attribute to the service and define its value.
- Click the Actions button () and then select Edit Attribute to edit an attribute value.
- Click the Actions button () and then select Unalign Attribute to unalign an extended custom attribute.
Custom attributes cannot be used in dashboards for business services.
For more information about custom attributes, see
The Info Drawer on the Default Service Investigator Page
The Info drawer at the top of the Service Investigator page displays the following:
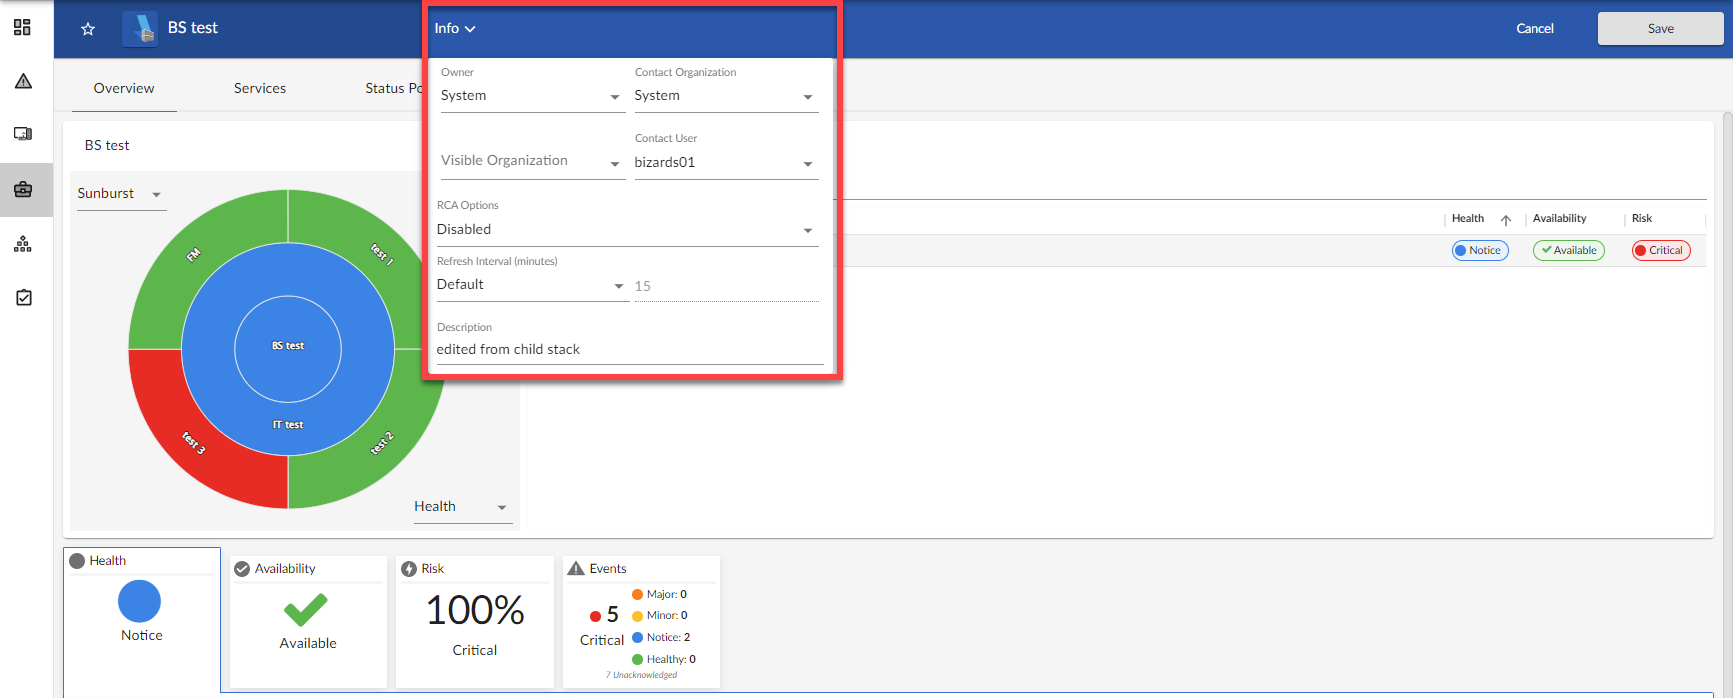
- Owner. The organization that owns the service.
- Contact Organization. The organization that should be contacted with any questions about the service.
-
Visible Organizations. A list of organizations from which you can select devices to use in Device Services or IT Services. For example, if you selected Acme for this field, then any service that is aligned with Acme can access devices in the Acme organization. This implies the devices can be included in IT Services. There are two uses for Visible Organizations:
- Device Services. Allow the inclusion of devices from the owning organization, as well as the visible organizations.
- IT Services. Allow the inclusion of Device Services from the owning organization, as well as the visible organizations.
- Contact User. The user who should be contacted with any questions about the service.
- RCA Options. Allows you to enable or disable the Root Cause Analysis feature, an advanced feature for troubleshooting. For more information, see Using the Root Cause Analysis Feature.
- Refresh Interval (minutes). Allows users with edit permissions to edit the Har Provider's Poll Frequency time. The value allows a minimum of 1 minute and a maximum of 24 hours (in minutes). Default minute value is 15 minutes.
- Description. A description of the service. You can use this field as a metadata tagging field that can be exploited in the search by a parent service. For example, if a collection of Device Services all have a description of "Shared Infrastructure", then an IT Service can search to include every Device Service in the same organization that has a description of "Shared Infrastructure". As you add more "Shared Infrastructure" device services, the IT Service will automatically expand to include them. This makes building service trees quick and self-maintaining, without resorting to rigid service names.
- Include devices from visible organizations. Allows you to include devices from other organizations in a Device Service. Turn the toggle on (blue) to include other organizations' devices; turn it off (gray) to exclude other organizations' devices. This option appears only on the Service Investigator page for Device Services.
Click the button to edit the content on all three tabs and to edit the fields on the Info drawer. You can also edit the service name and the icon associated with the service. Click to save your changes.
Using the Root Cause Analysis Feature
SL1 users can use the Root Cause Analysis feature to determine what is causing a service to be unhealthy, troubleshoot that service, and refine their policies.
NOTE: When you enable Root Cause Analysis on a business service or IT service, it will also implicitly enable Root Cause Analysis on any child IT services or device services.
NOTE: Root Cause Analysis is a beta feature.
Enabling Root Cause Analysis
To enable Root Cause Analysis:
- Click on the Business Services icon (
 ) to go to the Business Services page.
 - Click the Name of an existing service. The Service Investigator page for that service displays.
- On the Service Investigator page, click .
- Click the Info drawer and select one of the following options from the RCA Options drop-down:
- Disabled. The Root Cause Analysis feature is disabled.
- Enabled (contributors only). The Root Cause Analysis feature is continuously enabled only for contributing rules and devices. When you select this option, a full analysis will be generated and saved in the time series chart, but it will exclude results from non-contributing rules and devices.
- Enabled (next run only). The Root Cause Analysis feature is enabled only for the next data collection.
- Enabled. The Root Cause Analysis feature is continuously enabled for all rules and devices. When you select this option, a full analysis will be generated and saved in the time series chart, and it will include results from non-contributing rules and devices.
NOTE: You might experience performance slowdown if Root Cause Analysis is continuously enabled.
- Click .
Viewing Root Cause Analysis
You can view the Root Cause Analysis for a service's Health, Availability, or Risk metrics by clicking one of the time stamps in the time series chart for that metric. When you do so, a pane appears that explains which child devices or services contributed in the calculation for the resulting Health, Availability, or Risk for the selected time period:

The following columns appear on the Root Cause Analysis pane:
- Service/Device Name. The name of the service or device that contributed to the Health, Availability, or Risk status for the selected time period.
- Current State. The current Health, Availability, or Risk status for the service or device.
- Condition. The equation that is used to determine the Health, Availability, or Risk status for the service or device.
- Current Value. The current Health, Availability, or Risk value for the service or device, as determined by the value of the equation used in the Condition column.
- Historical Value. The Health, Availability, or Risk value for the service or device for the selected time period, as determined by the value of the equation used in the Condition column.
You can click on any of the column heading labels to sort the Root Cause Analysis pane by the values in that column.