![]()
This ![]() ). From there, you can select a device from the list to view detailed data on the Device Investigator page for that device.
). From there, you can select a device from the list to view detailed data on the Device Investigator page for that device.
Use the following menu options to navigate the Skylar One user interface:
- To view a pop-out list of menu options, click the menu icon (
 ).
). - To view a page containing all of the menu options, click the Advanced menu icon (
 ).
).
Viewing the Global List of Devices
The Devices page allows you to view all of your managed devices in Skylar One. This section explains how to gather more information about a device from this page.
To navigate to the Devices page, click the Devices icon (![]() ):
):

In a Global Manager system:
- When the button on the Devices page is toggled on, you can view a list of all of the devices discovered across all of the stacks in your Global Manager system.
- When the button on the Devices page is toggled off, you can view a list of devices discovered only on the Global Manager system itself.
You cannot add devices from the Devices page while in Global View mode. You can add devices on a particular stack only while on that stack in non-Global View mode.
If you are looking for a very specific set of devices, click the gear icon (![]() ) to the right of the Search field and select Advanced. In this mode you can create an advanced search using "AND" or "OR" for multiple search criteria. For more information, see Performing an Advanced Search.
) to the right of the Search field and select Advanced. In this mode you can create an advanced search using "AND" or "OR" for multiple search criteria. For more information, see Performing an Advanced Search.
To rearrange the columns in the list, click and drag the column name to a new location. You can adjust the width of a column by clicking and dragging the right edge of the column. For more information about editing and adding columns, see
You can filter the items on this inventory page by typing filter text or selecting filter options in one or more of the filters found above the columns on the page. For more information, see
You can adjust the size of the rows and the size of the row text on this inventory page. For more information, see the section on
For each device, the Devices page can display the following information:
- ID. The Device ID. This is a unique number that Skylar One automatically assigns to the device during discovery.
- Device Name. Name of the device. For devices running SNMP or with DNS entries, the name is discovered automatically. For devices without SNMP or DNS entries, the device's IP address will appear in this field.
- IP Address. The device's IP address.
- Class. The manufacturer and type of device. The device class is automatically assigned during discovery, at the same time as the category.
- Category. The category assigned to the device. Categories include servers, routers, switches, firewalls, and printers, among others. The category is automatically assigned during discovery, at the same time as the as device class. For more information about device categories, see the
- Organization. The organization to which the device is assigned.
- State. The current condition of the device, based upon events generated by the device. The device can have one of the following States:
- Critical. Device has a serious problem that requires immediate attention.
- Major. Device has a problem that requires immediate attention.
- Minor. Device has a less-serious problem.
- Notice. Device has an informational event associated with it.
- Healthy. Device is running with no problems.
- Collection State. The current condition of data collection for the device. The device can have one or more of the following Collection States:
- Active. Skylar One is collecting data from the device.
- Unavailable. Skylar One cannot connect to the device, and will not collect data from the device until the device becomes available. A physical device falls back to executing the availability ping every five minutes, unless you have critical ping enabled. Component devices get their availability calculated by the component discovery Dynamic Application of the parent device.
- User-Disabled. Skylar One is not currently collecting data from the device because the user has disabled collection.
- System-Disabled. Skylar One is not currently collecting data from the device because the system has disabled collection.
- Scheduled Maintenance. Skylar One is not currently collecting data from the device because it is currently in scheduled maintenance mode.
- User-Initiated-Maintenance. Skylar One is not currently collecting data from the device because it has manually been put into maintenance mode by a user.
- Component Vanished. The component device has vanished, i.e. is not currently being reported by its root device. Skylar One cannot collect data from the device at this time.
Depending on the circumstances, more than one collection state might appear for a single device. For example, if a device is in a scheduled maintenance mode, the Collection State might be Unavailable / Scheduled Maintenance / System-Disabled.
- Collector Group. The collector group to which the device belongs. Collector groups are groups of Skylar One Data Collectors, which are defined on the Collector Groups page (Manage > Collector Groups).
- SNMP Credential. The name of the SNMP credential used to monitor the device.
- SNMP Version. The version of SNMP used to monitor the device.
- Hostname. The fully qualified hostname for the device, for devices that are discovered and managed by hostname (instead of IP address). This column does not appear by default, but you can add it by clicking Grid Settings > Column Preferences.
- Date Created. The date and time on which the device was created.
- Organization ID. The unique numeric identifier of the organization to which the device is assigned.
- Class ID. The unique numeric identifier of the device class.
- Category ID. The unique numeric identifier of the device category assigned to the device.
- Type. The type of device. Options include:
- Physical. A hardware-based device with an IP address.
- Component. An entity that runs under the control of a management device.
- Virtual. A container for collected data.
- Collector Group ID. The unique numeric identifier of the collector group to which the device belongs.
- Asset ID. The ID of any asset associated with the device. The asset ID displays as a hyperlink that you can click to view the asset's properties. For more information about assets, see
- Last Poll. The date and time at which Skylar One last polled the device.
- Uptime. The amount of time since the device was last initialized.
- SL Agent. Indicates whether an Skylar One agent is installed on the device. If so, you can click the Yes hyperlink to display a modal where you can update the agent's configuration.
- Stack Name. The name of the stack on which the device was discovered.
- Stack ID. The numeric ID of the stack on which the device was discovered.
If you have defined any custom attributes for your devices, you can also add those custom attributes as columns that appear on the Devices page.
Viewing Additional Data about a Device
On the Devices page, you can click the Expand icon (![]() ) next to a device name to open a drop-down panel called the Device Drawer. The Device Drawer contains additional data about that device:
) next to a device name to open a drop-down panel called the Device Drawer. The Device Drawer contains additional data about that device:

The Device Drawer contains the Vitals graph pane and the Logs pane.
- The Vitals pane displays graph data for the past four hours of CPU usage, memory usage, and latency for that device, where relevant. You can zoom in on a shorter time frame in the Vitals graph by clicking and dragging your cursor over a timeframe, and you can go back to the original time span by clicking the button.
- The Tools pane enables you to run a set of diagnostic tools or user-initiated actions in the Activity Center, or to click on custom links that will open in a separate browser window. Click the search bar to search for tools, actions, or custom links that are available for the device. For more information, see the section on Using the Activity Center.
- The Logs pane displays a list of events associated with that device.
From the list of devices, click the device name to go to the Device Investigator page for more details about that device. For more information, see the Device Investigator section.
Using the Device Investigator
You can view detailed data about a specific device by clicking the device name on the Devices page to open the Device Investigator page for that device:

The tabs on the Device Investigator page provides access to data associated with a device.
Only tabs relevant to the selected device are available on the Device Investigator page. For example, the tab does not display if the selected device does not use interfaces. Also, widgets on the tab display as empty where no metrics exist for that widget.
The Device Investigator page can include the following menus and buttons:
- Info. This drawer on the tab displays additional information about the device, along with the most recently updated values for uptime and collection time.
- Tools. This button opens the Activity Center, where you can run a set of diagnostic tools or user-initiated actions, or click on custom links that will open in a separate browser window.
- Manage. In Global View mode, the Device Investigator displays only a few of the tabs that appear in the Device Investigator in non-Global View mode. The tabs that appear in the Device Investigator in Global View mode let you view some device data but not manage the device or change any of its settings. Click the button to view the full Device Investigator and manage the device on its native stack in a separate browser window. After editing the device and saving your changes, you can either close the window to return to Global View mode or keep it open to continue managing the device on its native stack in non-Global View mode.
The Device Investigator page contains the following tabs:
- Investigator. Displays metrics about a device. For most devices, the default metrics include Logs and the three Vitals: CPU Utilization (percentage), Physical Memory (percentage), and Latency (milliseconds). You can select additional metrics from the Add a metric drop-down list under the Device List pane on the left side of the screen. You can also compare devices on this tab.
- Settings. Enables you to manage your preferences for that device, such as whether to auto-clear events, accept all logs, run daily port scans, and more. You can also set user maintenance preferences and disable or enable collection on that device.
- Configs. Displays configuration information collected from the device by Dynamic Applications. If the device does not have any configuration data, this tab does not appear.
- Events. Displays a list of active and cleared events for the device. You can acknowledge events from this tab or add event notes.
- Interfaces. Displays information about the interfaces used by the device. If this device does not use interfaces, this tab does not appear.
- Software. Displays a list of all software installed on the device.
- More. This drop-down list lets you select additional tabs to display on the Device Investigator page by clicking the star icon next to the tab name. You can search for specific items on a tab and the relevant tab will appear in the search results. You can also remove a tab by clicking the star icon again, turning it from blue to white. Your tab selections are saved and persist until you change them.
Using the Info Drawer on the Device Investigator Page
On the Device Investigator page, you can view read-only information about the device in the Info drawer:
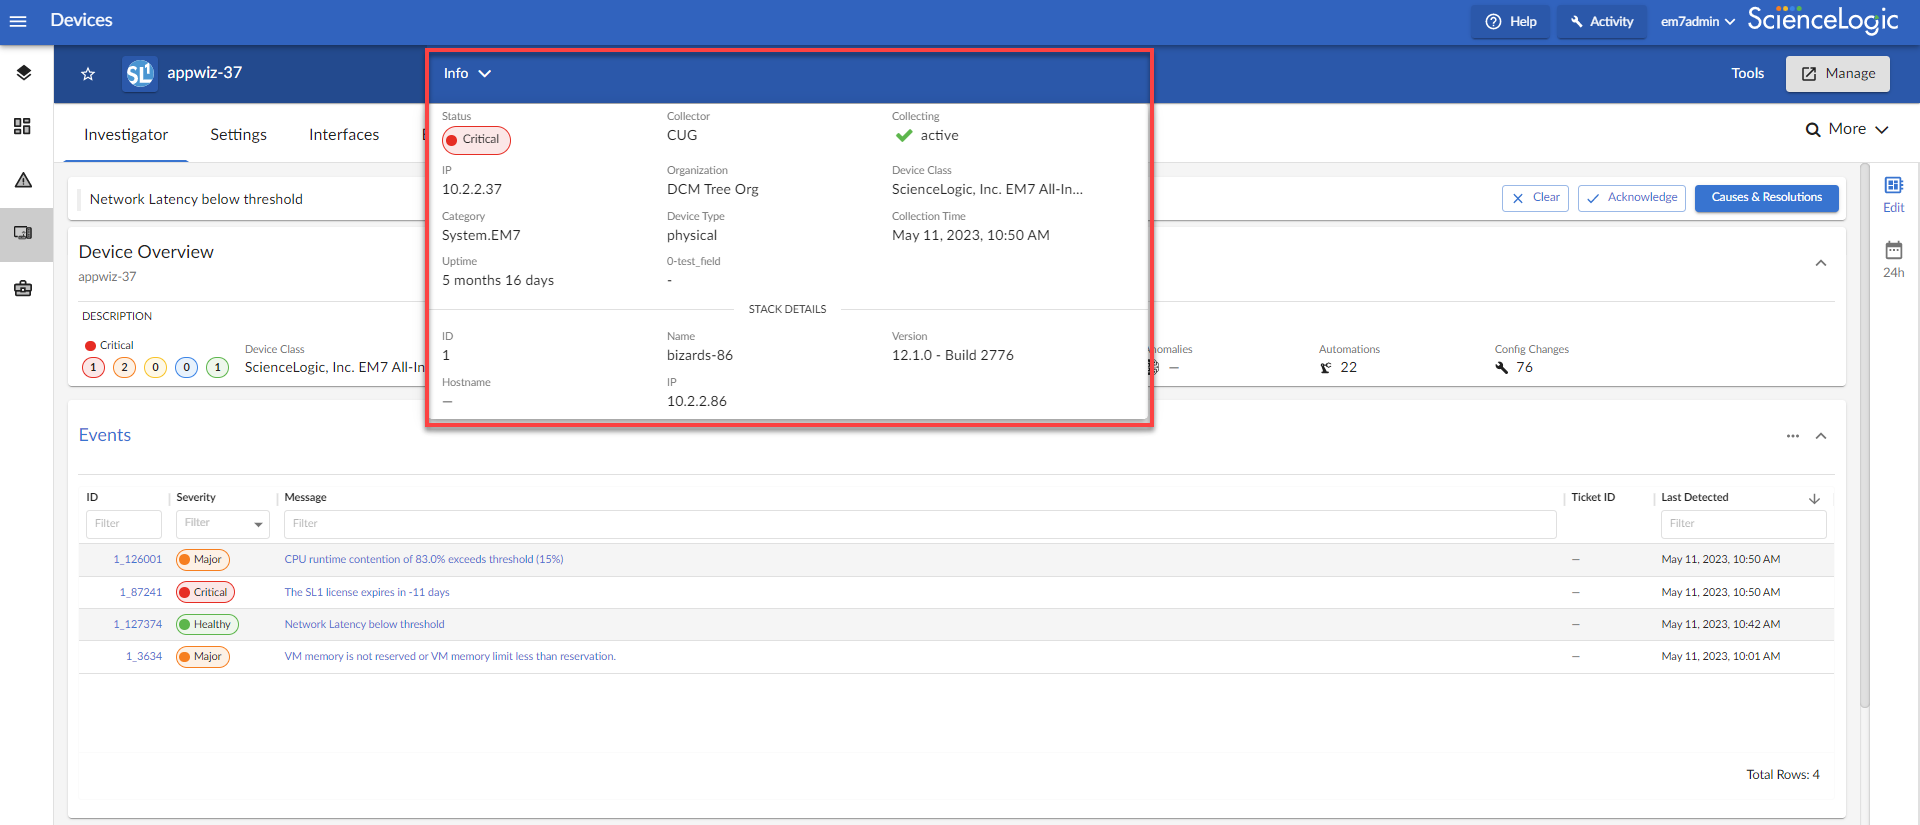
The Info drawer displays the following information for the device:
- Status. The status of the device.
- Collector. The Collector Group that was last used to collect data from the device. For All-In-One Appliances, this field will contain the name of the default, built-in Collector Group.
- Collecting. Indicates that the device collection is "Collecting" with a green check mark icon (
 ), meaning Skylar One is periodically collecting data from the device, or "Not Collecting" with a prohibition icon (
 ), meaning the Skylar One is not currently collecting data from the device.
- IP. IP address of the device.
- Organization. The organization to which this device belongs. Click the organization name to view a detail page for the organization.
- Device Class. Device class for the device. A device class usually describes the manufacturer of the device.
- Category. The device category associated with the device. The device category usually describes the primary function of the device, such as a "server", "switch", or "router".
- Device Type. Specifies whether the device is a physical device or a virtual device.
- Collection Time. Date and time of the most recent collection.
- Uptime. The number of days and hours that the device has been continuously up and communicating with Skylar One.
- More Attributes. This lower section lists any custom attributes that might be aligned with this device.
Additionally, the Info drawer also displays the following stack information for devices in Global Manager systems:
- ID. The numeric ID of the stack on which the device was discovered.
- Name. The name of the stack on which the device was discovered.
- Version. The Skylar One (SL1) version running on the stack on which the device was discovered.
- Hostname. The hostname of the stack on which the device was discovered.
- IP. The IP address of the stack on which the device was discovered.
Using Device Tools in the Action Runner
On the Device Investigator page, you can click the Tools menu to display the Action Runner. The Action Runner enables you to run a set of diagnostic tools or user-initiated actions, or to click on custom links that will open in a separate browser window.
NOTE: The tools and actions that are available in the Action Runner are based on the device type and your user permissions, as determined by your organization assignment and access hooks. For example, if a device does not have an IP address, only the Availability tool will be available.
NOTE: For more information about user-initiated actions, see
To use the Action Runner:
- Access the Action Runner for devices in one of the following ways:
- On the Devices page, open the Device Drawer for a particular device. Click the search bar in the Tools pane.
- On the Device Investigator page, click the button in the top navigation bar.
- Click in the navigation bar at the top of any page in Skylar One. Click the search bar.
- When you click the search bar, a list appears of the default tools, actions, or custom links that are available for the selected device. Click one of these tools, actions, or custom links, or use the search bar to search for a tool or action that is not listed. The following default tools are available in the Action Runner:
- Availability. Displays the results of an availability check of the device, using the port and protocol specified in the Availability Port and Availability Protocol fields on the tab for this device.
- Ping. Displays statistics returned by the ping tool. The ping tool sends a packet to the device's IP address (the one used by Skylar One to communicate with the device) and waits for a reply. Skylar One then displays the number of seconds it took to receive a reply from the device and the number of bytes returned from the device. If the device has an IPv6 address, Skylar One uses the appropriate IPv6 ping command.
- Who Is. Displays information about the device's IP, including the organization that registered the IP and contacts within that organization.
- Port Scan. Displays a list of all open ports on the device at the time of the scan.
- Deep Port Scan. Displays a list of all open ports and as much detail about each open port as the deep port scanner can retrieve.
- ARP Lookup. Displays a list of IP addresses for the device and the resolved Ethernet physical address (MAC address) for each IP address.
- ARP Ping. Displays the results from the ARP Ping tool. The ARP Ping tool is similar in function to ping, but it uses the ARP protocol instead of ICMP. The ARP Ping tool can be used only on the local network.
- Trace Route. Displays the network route between Skylar One and the device. The tool provides details on each hop to the endpoint. If the device has an IPv6 address, Skylar One uses the appropriate IPv6 traceroute command.
The tools found in the Action Runner can also be found in the Device Toolbox in the classic Skylar One user interface.
- If you clicked a custom link, the link opens in a new browser window. If you clicked on a tool or action, then as it runs, its progress and results appear in a log in the Activity Center.
- After the tool or action has run, if you want to run it again, click the button. This button appears only for activities completed during your current session.

The left pane of the Activity Center displays a list of devices for which you have most recently used the Action Runner, with the current device at the top of the list. To use the Action Runner for any of the other recently used devices or to view historical logs for the tools or actions that have been run on those devices, click on the device name.
Managing a Device in a Separate Window
In Global View mode, the Device Investigator displays only a few of the tabs that can appear in the Device Investigator in non-Global View mode. The tabs that do appear in the Device Investigator in Global View mode enable you to view some device data but not manage the device or change any of its settings.
To manage a device, click the button in the top-right corner of the Device Investigator while in Global View mode. When you do so, Skylar One opens the full Device Investigator for that device on its native stack in a separate browser window.
For more information about all of the device management options available in non-Global View mode, see
Overview of the Device Investigator Tabs
The following section provides an overview of how to use the tabs on the Device Investigator page for a selected device.
The Investigator Tab
The tab of the Device Investigator page displays a customizable set of metrics about the selected device:
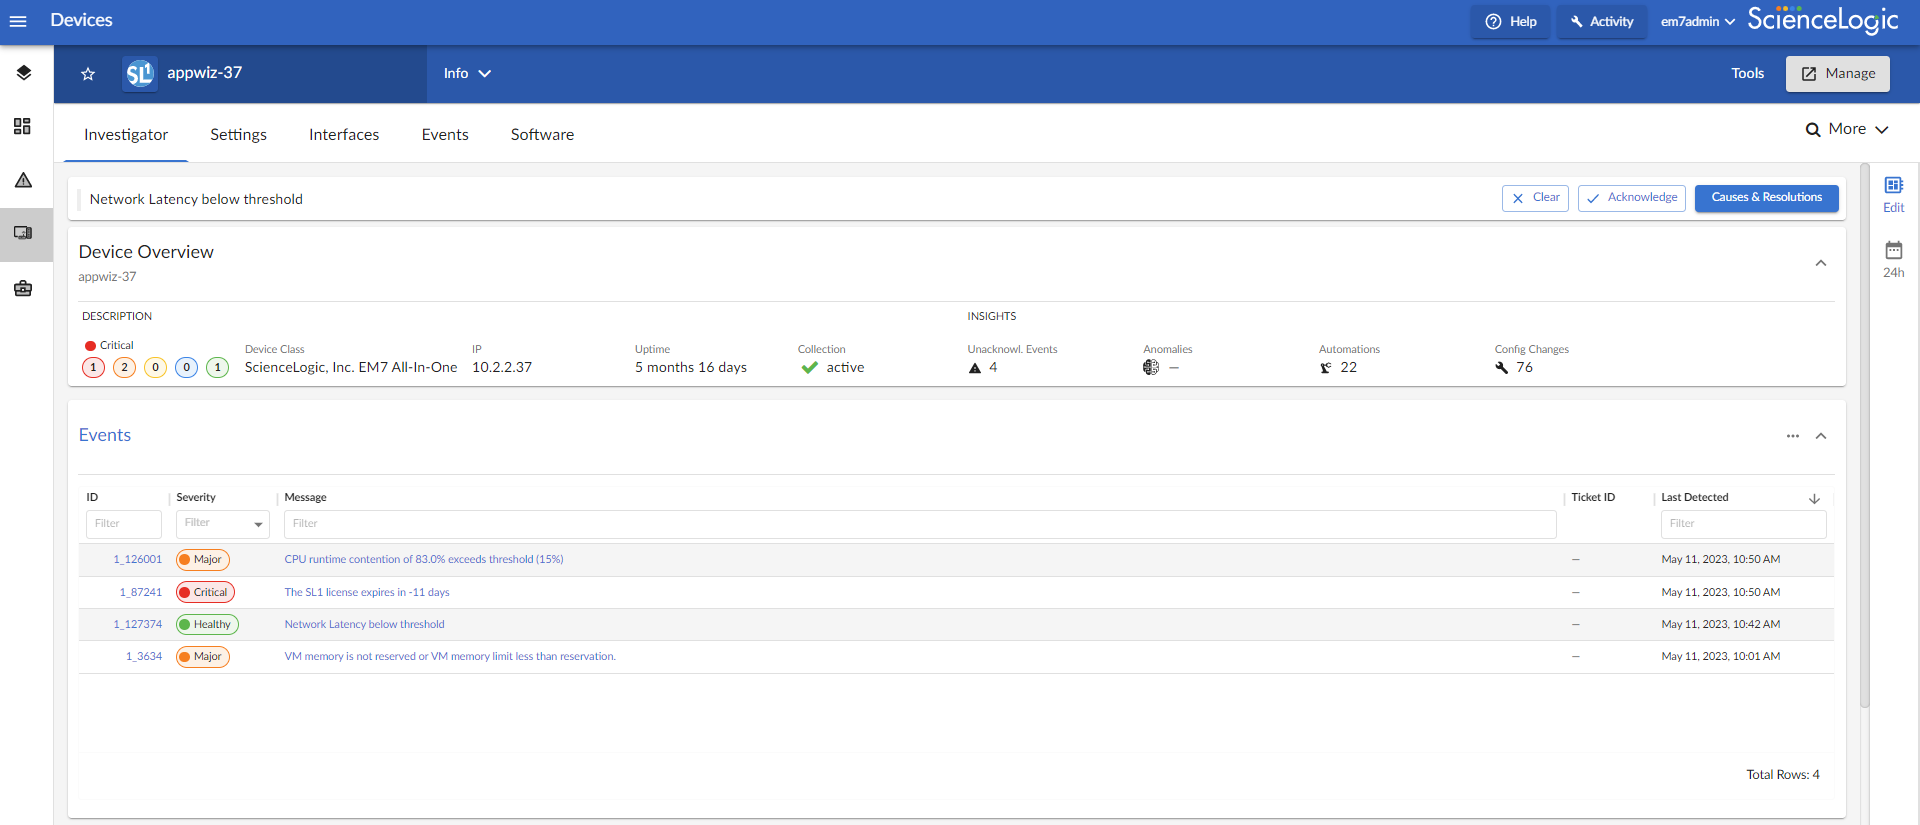
The device type determines which metrics appear in the tab. For most devices, the following panels appear by default:
- Device Overview. Displays a panel that includes basic information about the device, including its current state, device class, IP address, uptime, collection status, unacknowledged event count, machine learning-based anomaly detection status, automated actions count, and configuration changes count.
- Events. Displays a panel with the list of events aligned with this device. In the right-hand pane, you can click the ID or Message field to view the Event Investigator page for that event.
- Logs. Displays a panel with a list of the logs for the device, sorted from newest to oldest by default. You can use the Search field to search device logs for specific event messages, event IDs, date ranges, source types, and other relevant text for troubleshooting. You can also click on the column headers for Date/Time, Source, Event ID, Severity, and Message to sort by that column.
- Relationships and Membership. Displays a panel that includes details about the other devices that have relationships to the selected device, as well as the device groups and services to which the device belongs or has membership.
- The tab displays the name, relationship type, relationship discovery method, and health for each device that has a relationship with the selected device. You can click the hyperlink in the Device Name column to go to the Device Investigator for the related device.
- The tab displays the name, device count, and ID for each device group to which the selected device belongs or has membership.
- The tab displays the name, type, status, description, health, availability, and risk for each service to which the selected device belongs or has membership. You can click the hyperlink in the Service Name column to go to the Service Investigator for the related service.
- Map. Displays a panel with a map of the device and all of the devices with which the device has relationships. You can also click the Map panel heading to go to the tab for that device. This panel is disabled by default, but can be enabled by clicking the button, and then selecting the Map checkbox.
If your device has Skylar Automated RCA suggestions, custom alerts, or accepted alerts, you can click the link on the banner that appears at the top of the Device Investigator page to go to the tab for that device to review the Skylar Automated RCA content.
From the Event Investigator or Service Investigator pages, if you click the name of the device where an event has occurred, you are redirected to the Device Investigator page for that device, with an event context panel displaying at the top of the page. From this panel, you can acknowledge, clear, or view causes and resolutions relating to that specific event.
You can customize the appearance of the widgets on the page, including changing their height or width. For more information, see the section on Customizing the Appearance of Widgets on the Investigator Tab.
The Device Investigator page also includes the following sidebar buttons:
- Edit. Click the button on the right panel to edit the content that appears on the tab and its layout. For example, you can add or remove metrics, edit the metric panel order, or combine charts on the tab.
- Timespan. Click the timespan button on the right panel to adjust the timespan of data that appears in all of the metric panels on the tab. The default timespan is Last 24 Hours.
Select the Always display raw data checkbox at the top of the timespan selector to ensure that the metric data that appears in the panels on the tab always includes the most recent data available. If you do not select that checkbox, Skylar One will still display raw data when you select a timespan of less than 2 days, but will automatically display rolled up hourly data for timespan selections of 2-45 days and rolled up daily data for timespan selections of more than 45 days.
Adding and Removing Metrics on the Investigator Tab
Optionally, you can add metrics to the tab for Dynamic Applications, interfaces, and the Skylar One Agent (if applicable), among other things. You can also remove metrics from the tab.
To add and remove metrics on the tab:
- To add a metric panel that is not currently on the tab, click the button on the right sidebar to expand the layout panel, click , and then click the Add a metric field. A list of metrics appears:
- Select a metric from the list, or type the name of a metric and select it from the list. The metric is added to the right pane, and a corresponding widget appears in the left pane.
- Some metrics might require you to make additional selections, such as the network interfaces associated with a device. Click the field and add one or more additional metrics, as needed.
You can select up to eight additional metrics per widget.
- To remove a metric panel from the tab, uncheck the corresponding box in the right panel. The metric remains listed in the right panel, but the panel is removed from the tab.
- To completely remove the metric and its corresponding panel from the tab, click the button (
 ) for that metric in the right panel.
The tab retains any changes you made to the set of device metrics displayed for each device, on a per-user basis.
Editing the Metric Panel Order on the Investigator Tab
You can prioritize the order in which information is presented on the tab of the Device Investigator by changing the order in which the metric panel widgets appear on the page. You can click the button on the right side of the page and then drag and drop the panels up or down in the right panel to edit the order in which the metric panels appear on the left panel.
To edit the order in which widgets appear on the tab:
- On the tab of the Device Investigator page, click the button on the right sidebar to expand the layout panel.
- Hover your mouse over the "Panel" heading of the panel that you want to move until you see an open hand icon appear.
- Click and hold down the left button on your mouse to grab the panel, and then use your mouse to drag the panel to a different location in the list. When you do so, the open hand icon becomes a closed hand icon, and a blue dotted box appears around the panel.
- Release the left mouse button to drop the panel in your desired location. The new right-hand panel order will be reflected in the left-hand widget panel.
The tab retains any changes you made to the set of device metrics displayed for each device, on a per-user basis.
Combining Charts on the Investigator Tab
On the tab of the Device Investigator page, you can combine charts for different time-series metrics to see all of the combined data for those metrics in a single chart.
To combine charts:
- On the tab of the Device Investigator page, click the button on the right sidebar to expand the layout panel.
- Hover your mouse over a time-series metric name until you see an open hand icon appear.
- Click and hold down the left button on your mouse to grab the metric, and then use your mouse to drag the metric into the panel of a different time-series metric in the list. When you do so, the open hand icon becomes a closed hand icon, and the panel containing the combined metrics turns blue.
- Release the left mouse button to drop the metric into the desired panel. The newly combined metric panel will be reflected in a "Combined Charts" widget in the left-hand widget panel.
The tab retains any changes you made to the set of device metrics displayed for each device, on a per-user basis.
The Settings Tab
On the tab of the Device Investigator page, you can manage your preferences for that device, such as whether to auto-clear events, accept all logs, run daily port scans, and more.
Click the button to change your settings. When you are done making changes, click .

On the tab of the Device Investigator page, you can manage your preferences for that device, such as whether to auto-clear events, accept all logs, run daily port scans, and more.

Click the button to change your settings. When you are done making changes, click .
The Agent section appears only for agent-type devices.
Set the following Agent data collection preferences:
- Disk Space. Specify the amount of disk space in MB that the agent can use to store data. If the agent loses connectivity to Skylar One, this disk space will be used to store collected data until the connection to Skylar One is restored. When connectivity is re-established, the agent uploads all of its stored data.
- Excludes. Type a list of processes and directories, separated by semi-colons, that you do not want the agent to monitor.
-
Includes. Type a list of processes and directories, separated by semi-colons, that you want the agent to monitor. This field ensures that specific processes are monitored.
If a process or directory is included in both the Excludes field and the Includes field, the item in the Includes field will override the item in the Excludes field.
- Collect File Information. Select this option if you want the agent to report the names of files accessed by each monitored process.
- Collect Named Pipe Information. Select this option if you want the agent to collect named pipe information.
- Collect Socket Information. Select this option if you want the agent to collect socket information.
- Collect Thread Information. Select this option if you want the agent to collect thread information.
- Collect Non-Intercepted Processes. Select this option if you want the agent to collect limited information for processes that do not contain the agent library.
- Processes Aggregation. Specify how you want the agent to collect limited information for processes that do not have the agent library in them, and how to aggregate short-lived processes. Your options include the following:
- All: Aggregate every short-lived process into its parent.
- None: Do not aggregate any short-lived process.
- Without Sockets: Aggregate short-lived processes unless those processes have sockets.
- Upload Interval. Specify how often the agent should upload data. Your options include the following:
- 20 Seconds. Upload a data snapshot every 20 seconds.
-
60 Seconds. Upload a data summary every 60 seconds. This is the default setting starting with Skylar One version 11.1.0, and version 174 of the Linux agent and version 133 for the Windows agent. This option uses an improved data format that requires fewer Skylar One resources. The Skylar One agent continues to internally collect and poll data every 20 seconds, but the agent summarizes and uploads that data every 60 seconds. There is no data loss even though the data is uploaded less frequently.
Starting with Skylar One version 11.3.0, if you specify 60 seconds for the upload interval, the summary upload now will include "watched" or "monitored" files, just like the snapshot upload does.
Set the following Collection preferences:
- Enable Collection. Select this option to enable collection using the collector group specified in the following field.
- Collection Poller. Select the name of collector group you want to use for collection on this device.
- Collection Type. Select the type of collection you want to use on this device. Your options include Standard or DHCP.
Set the following Monitoring preferences:
- SNMP Read. Select the community string for read-only access to SNMP information on the device.
- SNMP Write. Select the community string for read-and-write access to SNMP information on the device.
- Availability Protocol. Select the protocol to monitor that determines if the device is available.
- Availability Port. Select the port to monitor that determines if the device is available.
- Latency Protocol. Select the protocol to monitor that determines latency for the device.
- Latency Port. Select the port to monitor that determines latency for the device.
- Auto-Update. This checkbox specifies whether or not you want Skylar One to perform a nightly discovery of the device and update records with changes to the device. If this field is unchecked, Skylar One will not perform nightly discovery. Changes to the device, including newly opened ports, will not be recorded by Skylar One.
- Scan All IPs. If the device uses multiple IP Addresses, Skylar One will scan for open ports on all IPs during initial discovery and nightly discovery.
Set the following Topolgy preferences:
The following topology-related fields are available if you have installed AP2 8.29.41 (Nougat) or later.
The device's topology settings are initially inherited from the system-wide topology settings that are set on the Behavior Settings page (System > Settings > Behavior), or from the topology settings for the device's class. However, you can change these settings on a per-device basis by editing one or more of the fields below. For more information about the system-wide topology settings, see
-
L2. Select the Override checkbox to override the system-wide Layer-2 topology settings that are set on the Behavior Settings page (System > Settings > Behavior). When selected, this field becomes editable, and you can select from the following options:
-
Disabled. Disables Layer-2 topology collection and processing for the device.
-
Processing Enabled. Enables Layer-2 topology processing for the device using the "Enterprise Database: Topology Crunch" process to determine Layer-2 topology relationships based on device category and connects network devices to each other using methods other than the standard SNMP protocol for collection.
-
Collection and Processing Enabled. Enables Layer-2 topology collection and processing for the device using the standard SNMP collection methods and the "Enterprise Database: Topology Crunch" process to determine Layer-2 topology relationships based on device category, with the purpose of connecting network devices to each other.
-
Enhanced Processing Enabled. Enables advanced Layer-2 topology processing for the device, but using methods other than the standard SNMP for collection. This enhanced processing can form Layer-2 relationships between any devices that match a MAC address from the BRIDGE-MIB or sourced from Dynamic Applications, regardless of device category.
-
Collection and Enhanced Processing Enabled. Enables advanced Layer-2 topology processing and collection for the device using the standard SNMP collection methods. This enhanced processing can form Layer-2 relationships between any devices that match a MAC address from the BRIDGE-MIB or sourced from Dynamic Applications, regardless of device category.
-
-
L3. Select the Override checkbox to override the system-wide Layer-3 topology settings that are set on the Behavior Settings page (System > Settings > Behavior). When selected, this field becomes editable, and you can select from the following options:
-
Disabled. Disables Layer-3 topology collection and processing for the device.
-
Processing Enabled. Enables Layer-3 topology processing for the device using the "Enterprise Database: Topology Crunch" process to determine Layer-3 topology relationships. This option requires all hops in a traceroute to respond and match devices within Skylar One to form the relationship.
-
Collection and Processing Enabled. Enables Layer-3 topology collection and processing for the device using the "Enterprise Database: Topology Crunch" process to determine Layer-3 topology relationships. This option requires all hops in a traceroute to respond and match devices within Skylar One to form the relationship.
-
Enhanced Processing Enabled. Enables advanced Layer-3 topology processing for the device, where the system forms relationships between any two hops that respond and match devices in Skylar One rather than discarding incomplete traceroutes or results that include unmatched hops.
-
Collection and Enhanced Processing Enabled. Enables advanced Layer-3 topology processing and collection for the device, where the system forms relationships between any two hops that respond and match devices in Skylar One rather than discarding incomplete traceroutes or results that include unmatched hops.
-
-
CDP. Select the Override checkbox to override the system-wide Cisco Discover Protocol (CDP) topology settings that are set on the Behavior Settings page (System > Settings > Behavior). When selected, this field becomes editable, and you can select from the following options:
-
Disabled. Disables CDP topology collection and processing for the device.
-
Processing Enabled. Enables CDP topology processing for the device using the "Enterprise Database: Topology Crunch" process to determine CDP topology relationships between two devices that both respond with CDP neighbor data, show each other as neighbors, and are managed devices in Skylar One. This option uses methods other than standard SNMP for collection.
-
Collection and Processing Enabled. Enables CDP topology collection and processing for the device using standard SNMP collection methods and the "Enterprise Database: Topology Crunch" process to determine CDP topology relationships between two devices that both respond with CDP neighbor data, show each other as neighbors, and are managed devices in Skylar One.
-
Enhanced Processing Enabled. Enables advanced CDP topology processing for the device, but using methods other than standard SNMP for collection. This advanced processing can form CDP relationships between two devices if at least one of those devices responds with CDP neighbor data and is a managed device in Skylar One.
-
Collection and Enhanced Processing Enabled. Enables advanced CDP topology processing and collection for the device using standard SNMP collection methods. This enhanced processing can form CDP relationships between two devices if at least one of those devices responds with CDP neighbor data and is a managed device in Skylar One.
-
-
LLDP. Select the Override checkbox to override the system-wide Link Layer Discovery Protocol (LLDP) topology settings that are set on the Behavior Settings page (System > Settings > Behavior). When selected, this field becomes editable, and you can select from the following options:
-
Disabled. Disables LLDP topology collection and processing for the device.
-
Processing Enabled. Enables LLDP topology processing for the device using the "Enterprise Database: Topology Crunch" process to determine LLDP topology relationships between two devices that both respond with LLDP neighbor data, show each other as neighbors, and are managed devices in Skylar One. This option uses methods other than standard SNMP for collection.
-
Collection and Processing Enabled. Enables LLDP topology collection and processing for the device using standard SNMP collection methods and the "Enterprise Database: Topology Crunch" process to determine LLDP topology relationships between two devices that both respond with LLDP neighbor data, show each other as neighbors, and are managed devices in Skylar One.
-
Enhanced Processing Enabled. Enables advanced LLDP topology processing for the device, but using methods other than standard SNMP for collection. This enhanced processing can form LLDP relationships between two devices so long as at least one of those devices responds with LLDP neighbor data and is a managed device in Skylar One.
-
Collection and Enhanced Processing Enabled. Enables advanced LLDP topology processing and collection for the device, using the standard SNMP collection methods. This enhanced processing can form LLDP relationships between two devices so long as at least one of those devices responds with LLDP neighbor data and is a managed device in Skylar One.
-
Set the following User Maintenance preferences:
- Enable User Maintenance. Specifies whether the device is in user maintenance mode. User maintenance is an option that allows a user to manually put a device in to "maintenance mode". During maintenance mode, for the selected devices, Skylar One generate only events with a severity less than the system-wide Maintenance Minimum Severity setting. If you select Enabled, the device is put in user maintenance mode, and the device will remain in this state until you or another user disables user maintenance mode.
- Enable Collection During Maintenance . Specifies whether Skylar One will poll the device when user maintenance mode is enabled. If you select Enabled, Skylar One will continue to poll and collect data from this device during user maintenance mode.
Set the following Alerts and Events preferences:
- Event Mask. Specify the time frame for masking events. When a device uses the Event Mask setting, Skylar One groups together events that occur on that device within the specified span of time.
- Always Create Latency Alert. Select this option to generate two alerts when availability and latency checks fail. Deselect to generate only an availability alert and suppress latency alerts.
- Allow Events to Auto-Clear. Deselect this option to override an event policy's auto-clear setting for this device.
- Critical Ping. Pings the device and creates an event if the device does not respond. When enabled you can select between 5 and 120 seconds.
Set the following Other device preferences:
- Accept All Logs. This checkbox specifies whether or not you want to keep and save all logs for this device. If you want to retain only logs associated with events, uncheck this field.
- Daily Port Scans. This checkbox specifies whether or not you want Skylar One to perform a daily scan of the device for open ports.
- Preserve Device Name. If selected, the name of the device in Skylar One will remain the same, even if the name of the actual device is changed. If unselected, the Skylar One name for the device will be updated if the name of the actual device is changed.
- Disable Asset Update. If selected, Skylar One will not automatically create a new asset record for the device or update the existing asset record for the device. For the single device, this checkbox over-rides any settings defined in the Asset Automation page (System > Settings > Assets).
-
Bypass Interface Inventory. Specifies whether or not the discovery session should discover network interfaces. Your options include:
- Selected. Skylar One will not attempt to discover interfaces for this device during re-discovery and nightly auto-discovery.
- Not Selected. Skylar One will attempt to discover network interfaces for this device during re-discovery and nightly auto-discovery using the Interface Inventory Timeout value and Maximum Allowed Interfaces value specified in the Device Thresholds page.
- Dynamic Discovery. If selected, Skylar One will automatically assign the appropriate dynamic applications to the device during discovery.
The Configs Tab
On the tab of the Device Investigator, you can view configuration information that has been collected from the device by Dynamic Applications. You can also view a list of all changes that occurred with a Dynamic Application between two specific snapshot reference points.

All objects of type "config" are included on the tab. Usually, "config" objects contain static information about hardware and configuration settings, such as serial numbers, version numbers, and hardware status.
For more information about this tab, see
The Events Tab
On the tab of the Device Investigator, you can view a list of events associated with the device.

To rearrange the columns in the list, click and drag the column name to a new location. You can adjust the width of a column by clicking and dragging the right edge of the column. For more information about editing and adding columns, see
You can adjust the size of the rows and the size of the row text on this inventory page. For more information, see the section on
You can toggle between Active events and Cleared events by using the drop-down to the left of the Search field. On this tab, you can also acknowledge and clear an event if you have permission for those actions.
For each event, the tab displays the following information:
- Event ID. The unique ID for the event, generated by Skylar One. The ID appears as a hyperlink. To view the Event Investigator page for the event, click the ID hyperlink. For more information about the Event Investigator page, see
- Severity. The severity of the event. Possible values are:
- Critical
- Major
- Minor
- Notice
- Healthy
-
Message. The message generated for the event. The message appears as a hyperlink. To view the Event Investigator page for the event, click the Message hyperlink. For more information about the Event Investigator page, see
-
Age. The amount of time (in days, hours, and minutes) since the event first occurred or since its last occurrence without having been cleared.
-
Ticket ID. If a ticket has been created for the event, this column displays the ticket ID of that ticket.
-
Count. The number of times this event has occurred, the number of child events associated with the event, or the number of masked events associated with the event.
-
Last Detected. The date and time at which the event last occurred on the device.
-
External Ticket. The numeric ID associated with a ticket from an external ticketing system (that is, a ticket that was not created in Skylar One). If this field displays a value, you can click on that value to spawn a new window and view the external ticket.
NOTE: To link an external ticket to an event, you must create a custom Run Book Automation policy and a custom Run Book Action or use the ScienceLogic APIs. For help with these tasks, contact ScienceLogic Customer Care.
- Event Note. A user-defined note to accompany the event. To create or edit a note, click the Note icon (
 ). The Edit Event Note window appears, where you can create or edit a note and save your changes.
 - Acknowledge. If the event has been acknowledged, this column displays a check mark and the username of the user who acknowledged the event. If the event has not yet been acknowledged, this column displays an button; click the button to acknowledge the event. When you acknowledge an event, you let other users know that you are aware of that event and are working on a response.
- Clear. Click the button to clear the event. When you clear an event, you let other users know that this event has been addressed. Clearing an event removes a single instance of the event from the tab. If the same event occurs again on the same device, it will reappear in the tab, even if you have previously cleared that event.
- Event Source. The system or application that generated this event. Possible values are:
- Syslog. Event was generated from a system log generated by a device.
- Email. Event was generated by an email from an external agent. For example, Microsoft Operations Manager (MOM).
- Internal. Event was generated by Skylar One.
- Trap. Event was generated by an SNMP trap.
- Dynamic. Event was generated by a Dynamic Application collecting data from the device.
- API. Event was generated by a snippet Run Book Action, a snippet Dynamic Application, a request to the ScienceLogic API, or by an external system.
- Skylar One agent. Message is generated by log file messages collected by the Skylar One agent.
- Skylar Automated RCA. Event was generated by a Skylar Automated RCA. You can view Skylar Automated RCA events, including suggestions, custom alerts, and accepted alerts. You can also filter the contents of the tab by Skylar Automated RCA events, active events, and cleared events.
- Masked Events. If the event has occurred multiple times on the same device that uses the event mask setting, click the masked events icon (
 ) to open the Masked Events Overview modal, where you can view details about the masked events. For more information, see the section Filtering for Masked Events.
 - Automated Actions. The number of times the event has triggered the execution of an automation policy. If the event has triggered one or more automated actions, click the number hyperlink to go to the Event Actions Log, where you can view a log of all automated actions that have occurred for the event. For more information, see the section Viewing Automation Actions.
You can also view the Event Actions Log modal page by clicking the button (![]() ) for the event and selecting View Automation Actions.
) for the event and selecting View Automation Actions.
Clicking the Actions menu (![]() ) next to an event gives you the following options, based on your permissions:
) next to an event gives you the following options, based on your permissions:
- View Event. Navigates to the Event Investigator page for that event.
- Edit Event Note. Lets you update the Note associated with this event.
- Create Ticket. Opens a new ticket in the Skylar One Ticket Editor, if you are using Skylar One for your ticketing.
- Edit Ticket. Opens an existing ticket in the Skylar One Ticket Editor, if you are using Skylar One for your ticketing.
- Create External Ticket. Creates a new ticket for the event if you are using an external ticketing system instead of Skylar One.
- View Event Policy. Opens the Event Policy page for the policy aligned with this event.
- View Device Thresholds. Opens the Device Thresholds page for the device on which the event occurred.
- Suppress Event for this Device. Suppresses the current event on the current device. When you suppress an event, you are specifying that in the future, if this event occurs again on the same device, the event will not appear in
- View Automation Actions. Displays a log of automations that have occurred for that event. This option is hidden if the event does not have any automation actions aligned to it.
The Interfaces Tab
On the tab of the Device Investigator, you can view information about the various interfaces used by the device, including Port, Hardware Description, MAC Address, Connection Speed, and other details for each interface.

For more information about this tab, see

For more information about this tab, see
The Software Tab
On the tab of the Device Investigator, you can view a list of all the software installed on the device.

For each installed software title, the tab displays the following information:
- Name. Name of the software.
- Install Date. Date and time the software was installed on the device.

For more information about this tab, see